
The battle begins again: Pandora FMS Vs Nagios. ¡FIGHT!
NagiosXI is the proprietary heir of one of the best-known tools in IT to monitor systems without a license, that is, as a free product. As a free product, Nagios (without XI) is a product that is almost 20 years old and suffers from many shortcomings, but for many years it has been the standard among “free” products and it fulfilled its role in those cases where the budget was quite short or the features needed were just a few. In recent years, its role as a free tool has been replaced by the more modern Zabbix.
Product features
Nagios XI is not a product as such, but rather it combines several pre-existing independent components. The best example is, for example, Nagios XI WEB management interface, with several elements, each one with its own credential system. Other system components installed on the Nagios XI appliance include:
- Nagios XI UI: “Overlying” interface on the “basic” Nagios interface.
- Nagios Core: Traditional interface.
- NSCA: Agent for passive and plugin tests (not maintained since 2011).
- NSPA: Agent for passive and plugin tests, with remote management.
- NRPE: Agent for running Nagios plugins.
- NRDP: Agent, theoretically a replacement for NSCA, whose development has not been updated since 2012.
- Nagios Plugins: Monitoring scripts. There have been several community “forks”.
- NagiosFusion: System similar to Pandora FMS Metaconsole.
- Netflow Analyzer: Specific component to work with Netflow/SFlow flows.
- Nagios Log Server: Log storage and monitoring system.
Each component with WEB interface has its own “look & feel”, its own user management system and, of course, its own configuration and integration with other elements. And these are elements designed by the company itself, Nagios Enterprise.
Third-party “OpenSource” components
- PNP: Plugin to monitor performance using RRD binary databases.
- Nagvis (maps): User-defined maps.
- NDOUtils: Information export from nagios to SQL.
- NSClient ++: Alternative agent that supports Nagios/Icinga.
- NagiosQL (modified): Administration interface with data storage in MySQL.
None of these elements, which make up the “Nagios XI” solution, are even by Nagios itself, so the compatibility and coherence between them is relative. In many cases, no one can guarantee the quality or maintainability of those pieces of software.
Feature table comparison between Pandora FMS and Nagios
| General features | Nagios | Pandora |
| User Experience monitoring | NO | YES |
| Availability monitoring | YES | YES |
| Performance monitoring | Partial | YES |
| Event management | NO | YES |
| Event correlation system | NO | YES |
| Multitenant | NO | YES |
| Log collection | YES | YES |
| Centralized management using monitoring policies | YES | YES |
| Certified Security Updates | YES | YES |
| Geolocation | NO | YES |
| Command line management | NO | YES |
| LDAP/AD authentication | YES | YES |
| Virtualization and cloud computing | YES | YES |
| High availability | YES | YES |
| Horizontal scalability (Metaconsole) | YES | YES |
| Service monitoring (BAM) | NO | YES |
| Customizable visual console | YES | YES |
| Synthetic modules (dynamic creation of data on existing data) | NO | YES |
| Historical database for long-term data storage | NO | YES |
| Centralized plugin distribution | YES | YES |
| z/OS monitoring | NO | YES |
| SAP R3 & S4 monitoring | NO | YES |
| Remote control (eHorus) | NO | YES |
| Agent technology | Nagios | Pandora |
| Multiplatform agents for Windows, HP-UX, Solaris, BSD, AIX and Linux | YES | YES |
| Remote management of software agent configuration (with policies and manually) | YES | YES |
| Agents for Android, IOS and embedded systems | NO | YES |
| Remote inventory or with agents | NO | YES |
| Centralized virtualization monitoring: Vmware, RHEV, XenServer, HyperV | YES | YES |
| Oracle, Informix, SyBase, DB2, Weblogic, Jboss, Exchange, Citrix, WebSphere monitoring (among others) | Partial | YES |
| Reports and graphs | Nagios | Pandora |
| Customization of reports (first page, header, images, dynamic content, static content) | NO | YES |
| Up to 6 decimals of precision in SLA reports | NO | YES |
| Fine-grain ACL system. 100% multitenant ready for SaaS | NO | YES |
| SLA advanced reports (daily, weekly, monthly) | NO | YES |
| Dashboard | YES | YES |
| Planned stops and exclusion | NO | YES |
| Report templates | NO | YES |
| Network features | Nagios | Pandora |
| Network L2 topology detection and self-discovery | NO | YES |
| IPAM (IP Address Management) | NO | YES |
| Decentralized SNMP and WMI monitoring (proxy servers, satellite servers) | NO | YES |
| SNMP trap monitoring | YES | YES |
| Dynamic network navigable maps, modifiable by the user in a graphical environment (Network console) | NO | YES |
| High-speed ICMP and SNMP scanning | NO | YES |
| Netflow | YES | YES |
| SSH/Telnet Console | YES | YES |
Points against Nagios
Monitoring current technologies
New check creation is based on wizards or plugins. In both cases, you have to be an expert to modify any of them (you have to program at command level, know the specific template definition language and manually debug), which makes it difficult to broaden the variety of checkups or customize one of them easily from the interface itself. In Pandora FMS, any extension can be carried out using the WEB interface, without getting down to the console level, in addition to offering a bigger plugin collection for business software that does not require any kind of coding.
When applying settings, you need to “compile” them so that if something goes wrong, changes cannot be applied until they are corrected. This would be insane in an environment with many hosts. Deleting an agent without first deleting the service it contains prevents you from making the change, but it does not solve it, for example. In Pandora FMS, the entire operation is in real time, or in the case of applying major changes, managed in the background by the system, without interruptions or the need to interact at a low level with the system.
Management automation
In general, monitoring is so manual that it would take a long time to monitor 100 agents, unless low-level scripts are created to automate the whole process, so there is no standard nor tools that allow automation, or good practices, it depends exclusively on the ability of the “nagios expert” to automate these tasks efficiently, which is a completely manual process.
Reports
Although Nagios has “custom” reports, this customization is limited to parameterizing the already available reports, which are only of 20 types. Each report shows a type of information available with a pre-set presentation, for example the SLA:
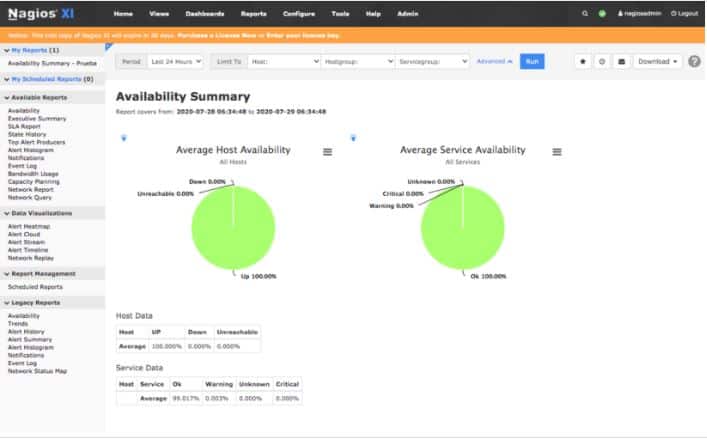
Filters can be added and saved as favorites, but it is not a report that can be much more customized. To sum up, reports are intended for the technician’s use, never to be used for an internal or external client. Reports do not allow to combine different types of elements or to show generic graphs of specific metrics.
Usability in large environments
Console load for very few agents is extremely high. The usability with a high number of systems is very poor. Although it can be made to monitor many systems, it clearly has not been designed for it. Pandora FMS is currently being used to operate and manage systems with more than 100,000 nodes.
Windows Agents
Nagios “Advanced” Agents for Windows (NSCA) are from 2011 and there have been no updates since then. There are several “Forks” (iCinga, ISCA-NG), but not for Windows. Despite the fact that Nagios has up to four types of agents (NRPE, NSCA), their performance and power is far from being comparable to that of Pandora FMS, especially in Windows environments.
Performance monitoring
Until very recently, Nagios used third-party software to manage performance data and graphics. It has now been integrated, but it remains a tailored third-party component, and not part of its initial architecture. Pandora FMS is a native capacity tool, it can be used to elaborate dashboards, since it works with data and an SQL engine from its first version.
Lack of event management
Nagios does not perform event-based management, it cannot automatically validate events from monitors that have been retrieved, it cannot group them, and it cannot specify event-based alerts. To tell you the truth, there is no “event” concept in Nagios as in other tools (OpenView, Tivoli, Patrol, SCOM, Spectrum, etc). Pandora FMS has evolved based on requirements of former users of these tools, so the level of compliance with industry standards is very high.
For Nagios, the events consist of a text log for a simple visual review, as seen in the following screenshot:
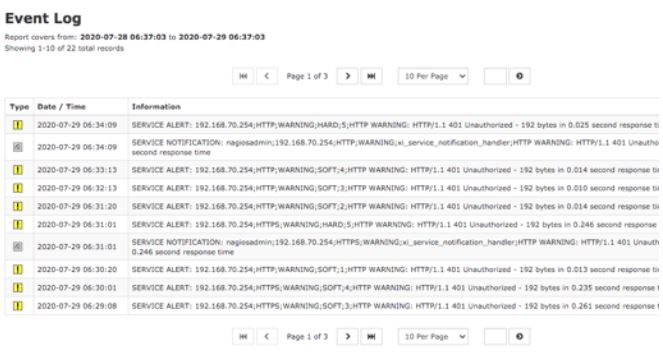
Nagios cannot do a root cause analysis,
Since there is no event correlation. PandoraFMS does have it, and it also has multiple tools (L2 Maps, Services, Alert Escalation, Cascade Protection) that help the user in this regard.
Nagios cannot do BPM (service monitoring)
With Nagios you cannot set a hierarchy based on weights of different elements from different systems. Pandora FMS has a specific component (Service Maps) for this specific point.
Network level deficiencies.
Nagios cannot display a physical network, since it is not capable of detecting or displaying link-level topologies. This limits switch and router monitoring. Furthermore, its network maps are not interactive nor can they be edited or customized unlike Pandora FMS Enterprise.
Its SNMP trap monitoring is not integrated with monitoring and therefore no added graphs, reports or alerts can be displayed. The same applies for its Netflow monitoring interface, which is conceived as an auxiliary tool.
Dashboard and custom visual displays
The closest thing to Pandora FMS visual consoles on Nagios are the third-party NAGVIS plugin that has barely evolved in the last 15 years. Nagvis is an external plugin, which is not even fully integrated with Nagios XI. Even going so far as to have a different look & feel:
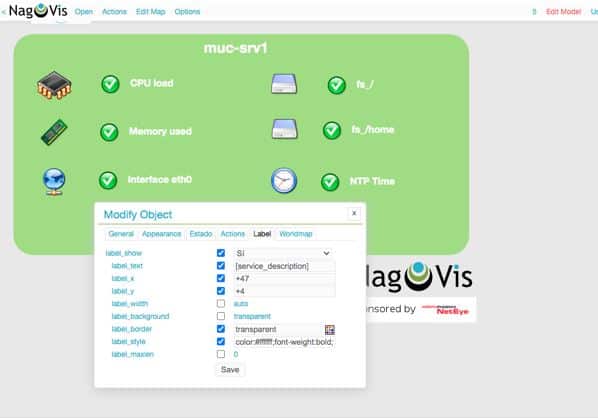
Although Nagios also has a Dashboard with a concept similar to that of Pandora FMS, it does not have basic elements, such as showing graphs of each monitored element, or numerical data of the collected values. It happens in a similar way with reports, which have “predefined” elements that provide little or no flexibility when it comes to building your own dashboards.
Permission management and Multi-tenancy
NagiosXI is not intended to work in a complex organization, where different administrators and users with access to different groups of machines can coexist. Its access segregation is very basic:
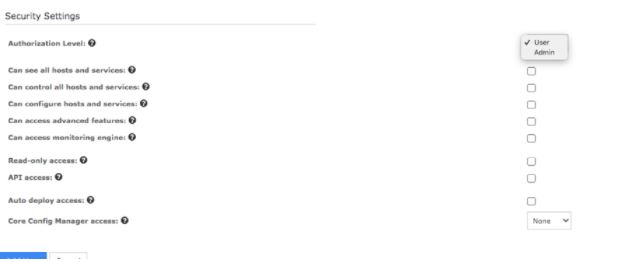
The scenario where you may have several dozen, with different ACL permissions by user groups is not even contemplated. Although it has an audit log, it is not useful to know what the administrator or users do with the tool, it is more like a server diagnostic tool.
Conclusions
Nagios is a software tool that can be useful in environments where there is already a person with advanced knowledge of Nagios who takes care of everything and adapts it manually according to the needs of the environment. The company does not have a “Nagios”, it has a “person who knows about Nagios”, so the cost of the total solution is really the cost of that person, including a possible replacement. In this case you don’t pay for license nor maintenance, but the hidden costs are of other nature. Tool customization and evolution depends entirely on that person. It is not a standard solution, it is a completely “ad-hoc” solution.
100% of our clients, prospects or consulted companies that use Nagios, actually use the “free” version of Nagios, which has less features than those included in this comparison. There are many Nagios forks, the most popular are Icinga or Centreon. There are commercial alternatives with a higher quality than that of Nagios XI, the best representative would be OP5.
Nagios XI is a tool whose main strength is its license price, which in most cases is free, and which even in the case of paying for the “Enterprise” version is more competitive than Solarwinds or Whatsup Gold just to name a few.
Pandora FMS is a tool that competes – and has already replaced in several cases – tools from IBM, HP, CA and BMC such as Tivoli, OpenView, Spectrum and Patrol. The scope, resources and scope of the projects are clearly different.
Pandora FMS’s editorial team is made up of a group of writers and IT professionals with one thing in common: their passion for computer system monitoring. Pandora FMS’s editorial team is made up of a group of writers and IT professionals with one thing in common: their passion for computer system monitoring.