
Virtual server monitoring: key points to keep in mind
It is undeniable that today we really live in cloud… of virtual servers. It is so because the vast majority of services and applications “rely” on them: any survey shows, outright, that users use them very frequently (banks, universities, e-commerce, etc.). But, how is virtual server monitoring done? Pandora FMS has done its homework and today I will explain how.

Caption: ‘La Sortie de l’opéra en l’an 2000’:
this is how they imagined in 1902 our life would be in 2000
(Source: Wikipedia, public domain image)
I find the above image funny because our ancestor colleagues always imagined their sci-fi future always thinking about physical mobilization. Now, in the 21st century, we had to face forced remote work, fully realizing that it is not necessary to be physically present in a certain place to work and even less in the case of monitoring virtual servers (successors of physical and real servers).
I am not claiming that hardware as such does not deserve attention. In fact, when starting from scratch with our servers, we will ask ourselves important questions such as what do we build, blade servers or rack servers? or what kind of hypervisor will we use? These questions will have an impact on our virtual servers, whether we are programmers or users!
Of course, after parking, connecting and configuring our physical servers, which will later house our virtual servers, Pandora FMS will accompany you along their mandatory monitoring in the so-called Data Centers or server farms.
Virtual server monitoring
I consider that there are at least two kinds of virtual servers that, of course, were born from their real counterparts. That is why I oversimplify it (if you are experts you may be shocked by what comes next):
- Complete virtual servers.
- Containerized virtual servers.
Complete virtual server monitoring
Let’s say we use the VirtualBox hypervisor (my favorite), which is open source software for several platforms, Microsoft Windows® and GNU/Linux® included. It is no secret to anyone that GNU/Linux reigns over both real and virtual servers (the rest of the article I only talk about servers with GNU/Linux®). So we have already downloaded a huge file containing an installation image of our favorite distribution.
With all this at hand, the process of creating and then monitoring virtual servers is not much of what we do in real life with the hardware in hand, that is, within our physical reach. By the way, the latter is called bare metal. From there, from hypervisors, interesting options have been created for their automation. The latter is possible because hypervisors accept commands through command lines and even through the Application Programming Interface (API) we can create, run, modify and destroy our virtual machines. What is the difference between manual and automated installation?

Caption: Sextant in the Paulista Museum of Brazil (Wikipedia) https://commons.wikimedia.org/wiki/File:Sextante,_Acervo_do_Museu_Paulista_da_USP_(5).jpg
What you see above is a sextant with a compass: every good sailor always has one next to the list of the brightest stars in the sky, so that day or night and being in the open sea, he can reach a safe port. But in this century it is most likely that it will be guided by the Global Positioning System (GPS) and even ships are driven almost automatically. I emphasize the word almost because we will always have to configure our virtual servers with at least some templates in standardized languages for specialized software.
The specific software for these tasks may be Vagrant or any other that allows creating virtual machines with different hypervisors and here is where automation begins. Vagrant keeps installation images of the main operating systems and can download them for you as long as you have a very good internet connection, because we are talking about several gigabytes.
You can also -or rather should- download and install all the software you need from the official repositories. Here we return to the topic of virtual server monitoring, because at this point you can add, organize and install Pandora FMS Software Agents so that they collect the metrics (monitoring data) and send them to your Pandora FMS server. Also Pandora FMS Software Agents can be installed with the help of Ansible or Puppet, among others.
Some of the advantages of using Pandora FMS Software Agents to monitor virtual servers are:
- Employees doing remote work use Virtual Private Networks (VPN) to encrypt and protect information. Pandora FMS closely monitors this network traffic and will alert if there is any issue (congestion, number of users, etc.).
- Monitor the disk space on each virtual server and notify you in advance so that you can make your forecasts.
- Applications that depend, let’s say, on a virtual web server will be able to be monitored and stay constantly online.
- Directly ask the operating system about the temperature of the computer on the hypervisor side. I limit this so that we never lose sight of what underlies the virtual server monitoring, since with a single Software Agent in the bare metal it will save us dozens of Software Agents that would be needed for each of the virtual servers that are on a single real server.
Virtual server monitoring in containers
As you may guess, a complete virtual server is an isolated environment that works in a public or private network just like another machine, including its own IP address(es) on its own virtual network card(s).
In the case of containers, we will save an important component by sharing it with virtual servers: the kernel of the operating system. This means that we can only use GNU/Linux® servers, since Docker®, the most used software in containers, only works on a virtual level on this kernel.
This means that our containerized virtual servers will access -with the appropriate permissions that we grant- the real components, bare metal, which results in speed, memory saving and use of the Central Processing Unit (CPU), etc. Remember Pandora FMS Software Agents? Our Pandora FMS servers can also work without them and periodically check these containers. Again, here I mention the case of a virtual nginx server. A remote query with curl must return an HTTP 200 code every minute and if it fails three consecutive queries, you will get an alert from our console or Pandora FMS Metaconsole.
All this overview and way of working is broadening: on the horizon you can see Podman, another hypervisor for virtual servers in containers.
Virtual server monitoring automation in containers
Despite the lengthy – and perhaps scary – title of this section, as I told you, Pandora FMS has done its homework very well. However, I must first explain something important to you.
For virtual containers, there are so-called “orchestra conductors” with which, by means of the credentials and token of our APIs, we can manage hundreds or thousands of virtual machines that use Docker. In the case of Docker Swarm Pandora FMS runs in virtual mode to enter and be part of the environment and obtain the necessary metrics. In turn we can unify it in a Metaconsole (Enterprise version) with other Pandora FMS servers.
But the best known of these “orchestrators” is Kubernetes, for which, from Pandora FMS version 738, there is a plugin that will indicate the CPU usage percentage of a node, amount of pods and other metrics, with all of which you can mass monitor virtual servers. As I said, our Pandora FMS server can run virtually in a container. You may monitor it with Software Agents or another Pandora FMS server, but there are also other alternatives.
Prometheus and Grafana
Prometheus has become a key part of Kubernetes monitoring, taking advantage of the fact that it was written natively for that environment. In other words, it was programmed from scratch, always thinking and taking into account virtual server containers.
Prometheus, without delving too deep, uses recent technology such as time series records or just time series, using specialized databases to store key-value pairs and thus check and summarize graphically with Grafana.
A time series is a series of data points collected and indexed, or arranged in time order. Most commonly, a time series is a sequence taken at successive, equally spaced points in time. Therefore, it is a discrete temporal data stream. Examples of time series are ocean tidal heights, sunspot counts, or, as in our case, virtual server monitoring.
Now, I argue that this automation has a cost: Prometheus uses a data model that implies that the metrics to be collected must have a strict metric name or naming pattern. In regular expressions or regex it must comply with the following formula:
[a-zA-Z_:][a-zA-Z0-9_:]*
Popular advice says that if we can solve a problem using regex then we have two problems (a bit of humor). In Pandora FMS we can name our metrics however we want, because internally they use an absolute identifier. What Prometheus does is work with metadata, that is, the data describes itself. In Pandora FMS, the data is strongly typed (or normalized, according to the norm). The main advantage of strongly explicit metrics is that it allows to turn units into a post-processed. In addition, it allows you to save abstract concepts such as cascade protection, something not contemplated in Prometheus. All this is much better explained in the chapter devoted to Pandora FMS monitoring introduction. I highly recommend reading it.
Thus, Pandora FMS allows to explicitly declare that in a metric to be collected, its unit is bits and then we want its graphical representation in bytes, so we must divide by eight. Prometheus advises the units to be in the name or in the metric label (but not both), such as http_request_duration_seconds where the word “seconds” indicates that the number that accompanies the key is expressed in seconds. Why did Prometheus choose this path? Well, to be able to check and create graphs fast and automatedly. I clarify that I do not imply that Prometheus invents anything new, in fact they are ruled by the rules of the OpenTDBS.
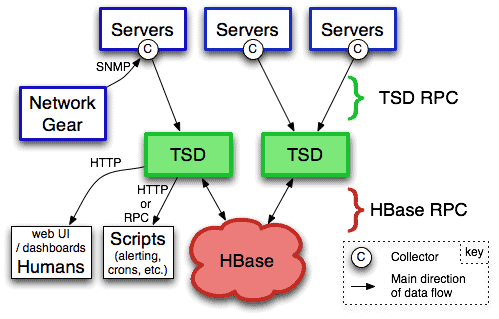
Caption: Service architecture and command in OpenTSDB (http://opentsdb.net/overview.html)
Let me delve into this point: let’s say that in Prometheus we want to see percentage metrics (for example free disk space). In this query we must include the keyword ratio… That’s a great idea! What could possibly go wrong? That whoever created the metric forgot to put the keyword in the name or label of the metric… The way to deal with these ambiguities or possible failures is that Prometheus includes lots of preconfigured metrics. It is as if we developed a software that identifies cats in pictures and we added thousands of pictures of cats to help it identify them… For this last example, do not take the wrong way, it is not my intention to go against the collection of time series: in fact for anomaly detection the theory of time series is used.
In addition, Pandora FMS uses LogStash and ElasticSearch for log collection, with the premise of taking data from any source, organizing it and presenting it in real time. Pandora FMS takes the reins in this matter because virtual machine monitoring takes a surprisingly huge amount of data that costs time and money for its storage and processing, something that almost no company can afford.
Also the flexibility of Pandora FMS allows adding this type of technology for monitoring, and in fact uses Grafana quickly and easily in the console.
Before finishing, remember Pandora FMS is a flexible monitoring software, capable of monitoring devices, infrastructures, applications, services and business processes.
Would you like to find out more about what Pandora FMS can offer you? Find out clicking here .
If you have to monitor more than 100 devices, you can also enjoy a FREE 30-day Pandora FMS Enterprise DEMO . Get it here .
Finally, remember that if you have a reduced number of devices to monitor, you can use the Pandora FMS OpenSource version. Find more information here .

Traductora a francés e inglés. Me encantan las lenguas. Amante de la ropa oversize, la tarta de queso y el chocolate caliente en invierno. Me gusta leer, escuchar música, viajar y explorar cosas nuevas. Mi frase más temida por aquellos que me conocen es “he estado pensando…”
Translator into French and English. I love languages. Lover of oversized clothes, cheesecake and hot chocolate in winter. I like reading, listening to music, travelling and exploring new things. My most feared phrase by those who know me is “I’ve been thinking…”