The total monitoring solution for full observability
You can’t control what you don’t know. Knowledge involves identifying every element, every piece, every relationship between components and this often involves hundreds of technologies from different departments.
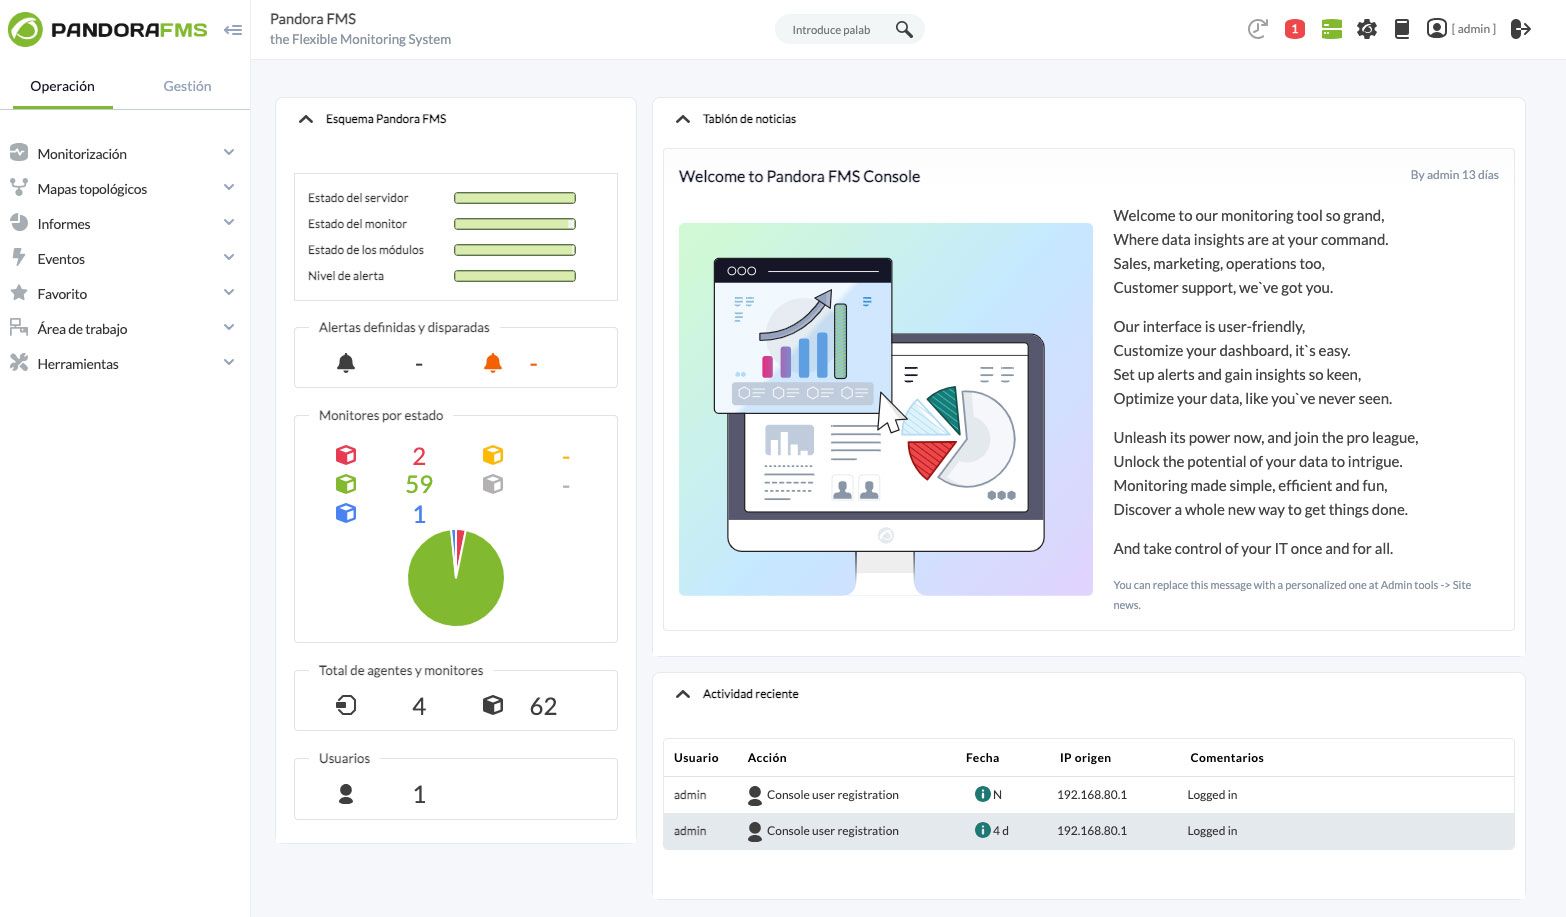
Can a single tool offer global visibility?
What is Pandora FMS for?
Pandora FMS shows in real time what happens with your organization’s technology.
Generate alerts, analyze trends of years and share that information with customers or suppliers. Our clients use this information to save money, time and above everything else help their IT teams optimize their work.
For any type of organization
SAP can be employed in many ways, just like an Oracle database or Amazon or Azure cloud instances of “things”.
The difference is that few software on the market can present you with the status of each piece of your company’s IT puzzle on the same screen.

How can it help you?
It helps you optimize. This can be seen as saving your technicians’ time in management tasks by having reliable and real-time information, cost savings in licenses by doing everything with the same software, savings in hardware or services by simplifying supervision and management or an improvement in the perception of your service’s quality by customers or suppliers.
But none of this is enough, the most important thing is that Pandora FMS offers light, order and purpose where before there was chaos and shadows.
What makes it different?
Other products don’t cover all current needs (log, network, application, server, SAP, as400, database or cloud management). Other manufacturers integrate different products into a single suite, like a technological frankenstein.
Other manufacturers say they cover all areas but have a time-consuming “do-it-yourself” proposition that takes a lot of time and investment in development and integration resources.
Pandora FMS is the only manufacturer that integrates an all-in-one solution and offers professional services to help companies throughout the implementation process.
And most importantly: our license is very simple to understand.
Getting started with Pandora FMS
Download the Open Source version and find all the answers on how to use Pandora FMS in our documentation, find answers in the Community or try Pandora FMS 30 days for free.
We offer implementation, integration, migration and support services in different formats. Ask us to build a pilot or a proof of concept so that you can evaluate how Pandora FMS adapts to your organization. We work fast and have partners in many countries.
Licensing
Software as a Service
Cloud Monitoring as a Service is designed so that you don’t have to spend time installing software, maintaining hardware, an operating system, or managing security patches or updates.
You may enjoy a Pandora FMS cloud instance, maintained by us but at your disposal 24/7.
Open Source
We have a totally free version under OpenSource license (GPL2). You may use it without limits, and if one day you decide to use the Enterprise version, you can migrate the OpenSource system automatically.
On-Premise
Traditional software license, to install Pandora FMS on your own computers, perpetually (for life). You will only have to pay for the license once, support is optional and you will have to pay for it every year.
The cost of support is 30% of the cost of the license and it is unlimited, that is, you can make all the queries you need, access all the updates and product improvements and have unlimited access to the plugin and integration library. Additionally, you may get training through our e-learning system at no extra cost.
OEM
You may customize Pandora FMS Enterprise to operate with another look, with another name and with customization that includes installers, logs, configuration files and any other aspect from the point of view of the end user.
Pandora FMS is ready to use components on Android, ARM and other embedded systems that can be completely customized. Contact us about Pandora FMS possibilities in OEM environments.
Integrated Monitoring
Network monitoring
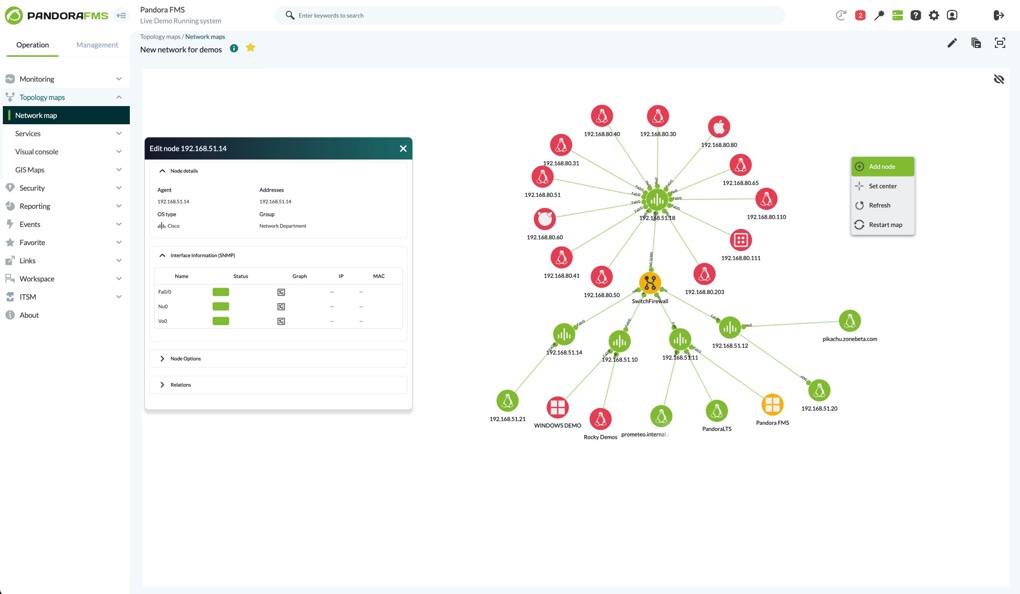
Pandora FMS allows you to discover all your network equipment and represent its topology throughout maps that connect interfaces and display the structure of your network in detail. Go further, unifying device management with full network observability.
Auto-discovery and network maps
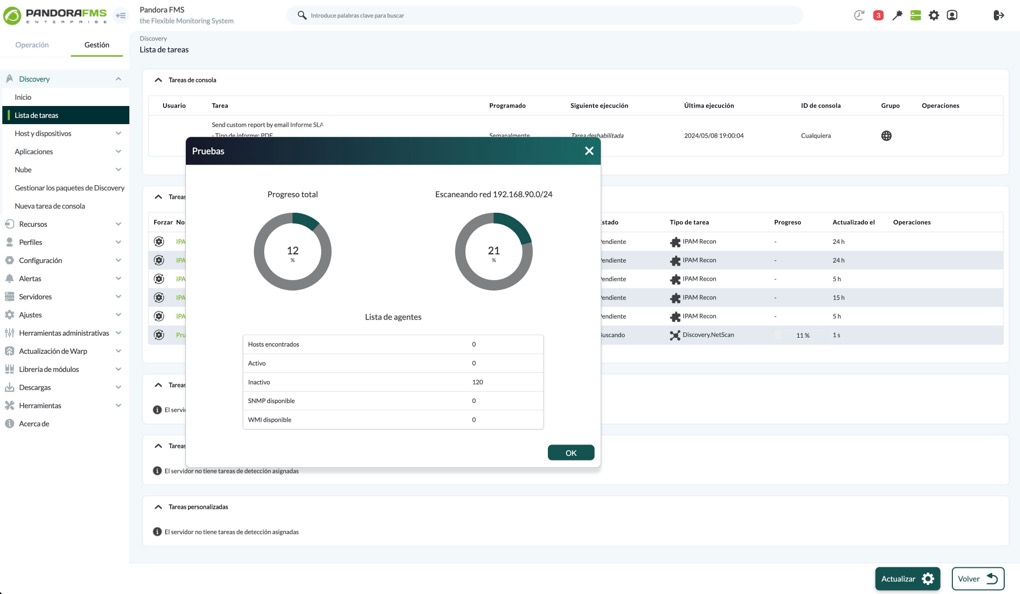
Network maps with dynamic topology at link level. SNMP v1, v2 and v3. Dynamic network interface detection, trap management and decentralized auto-discovery.
IPAM
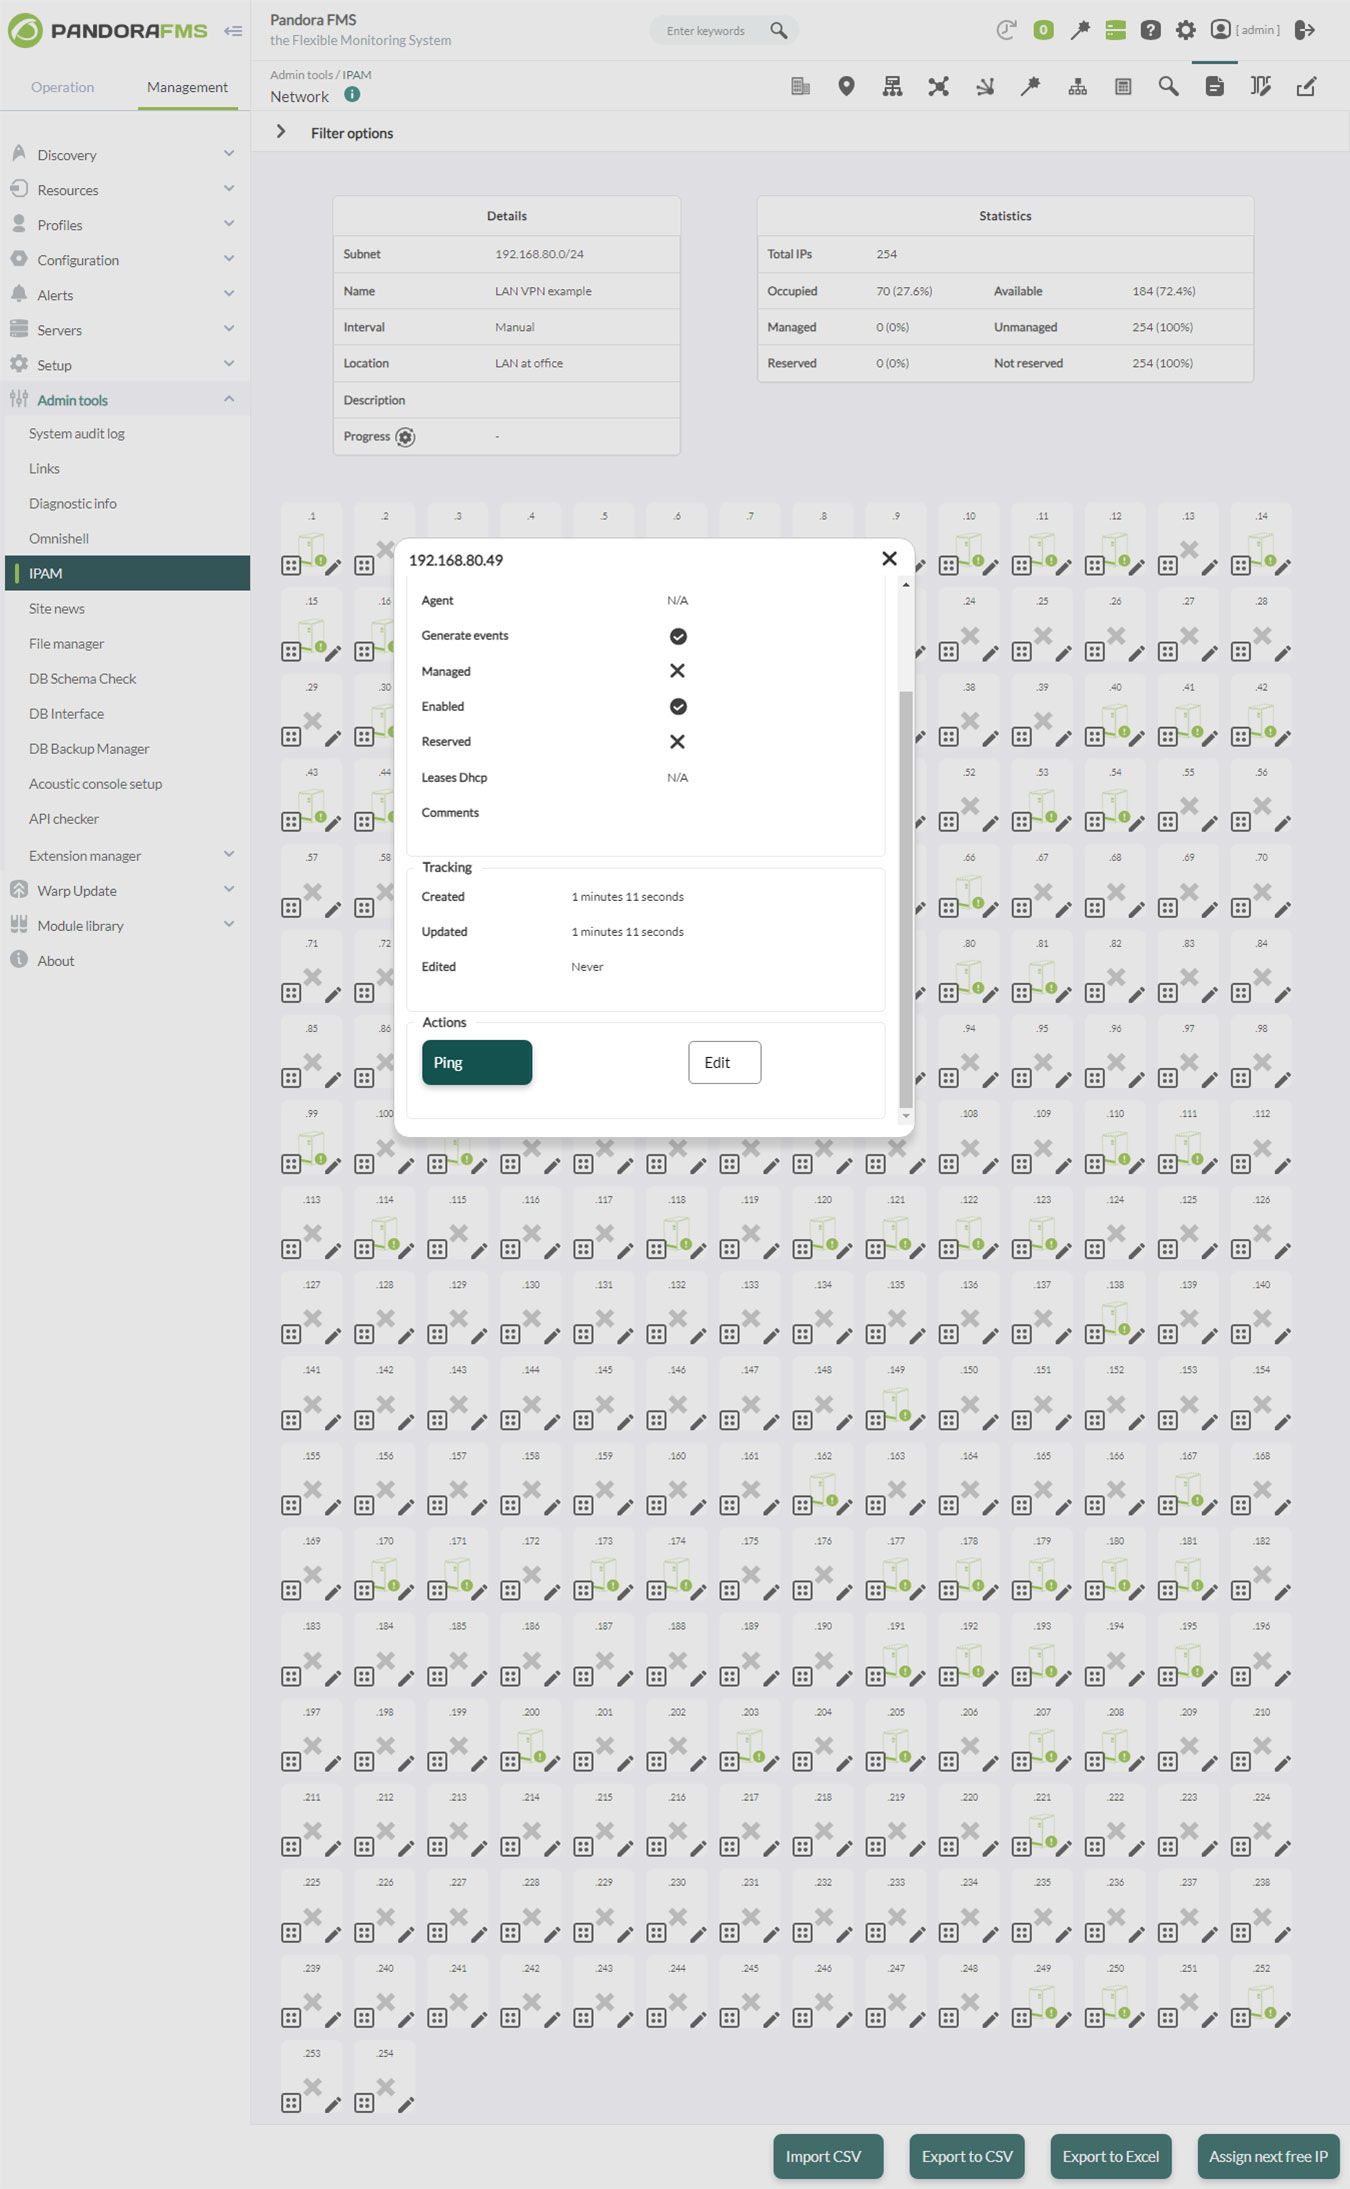
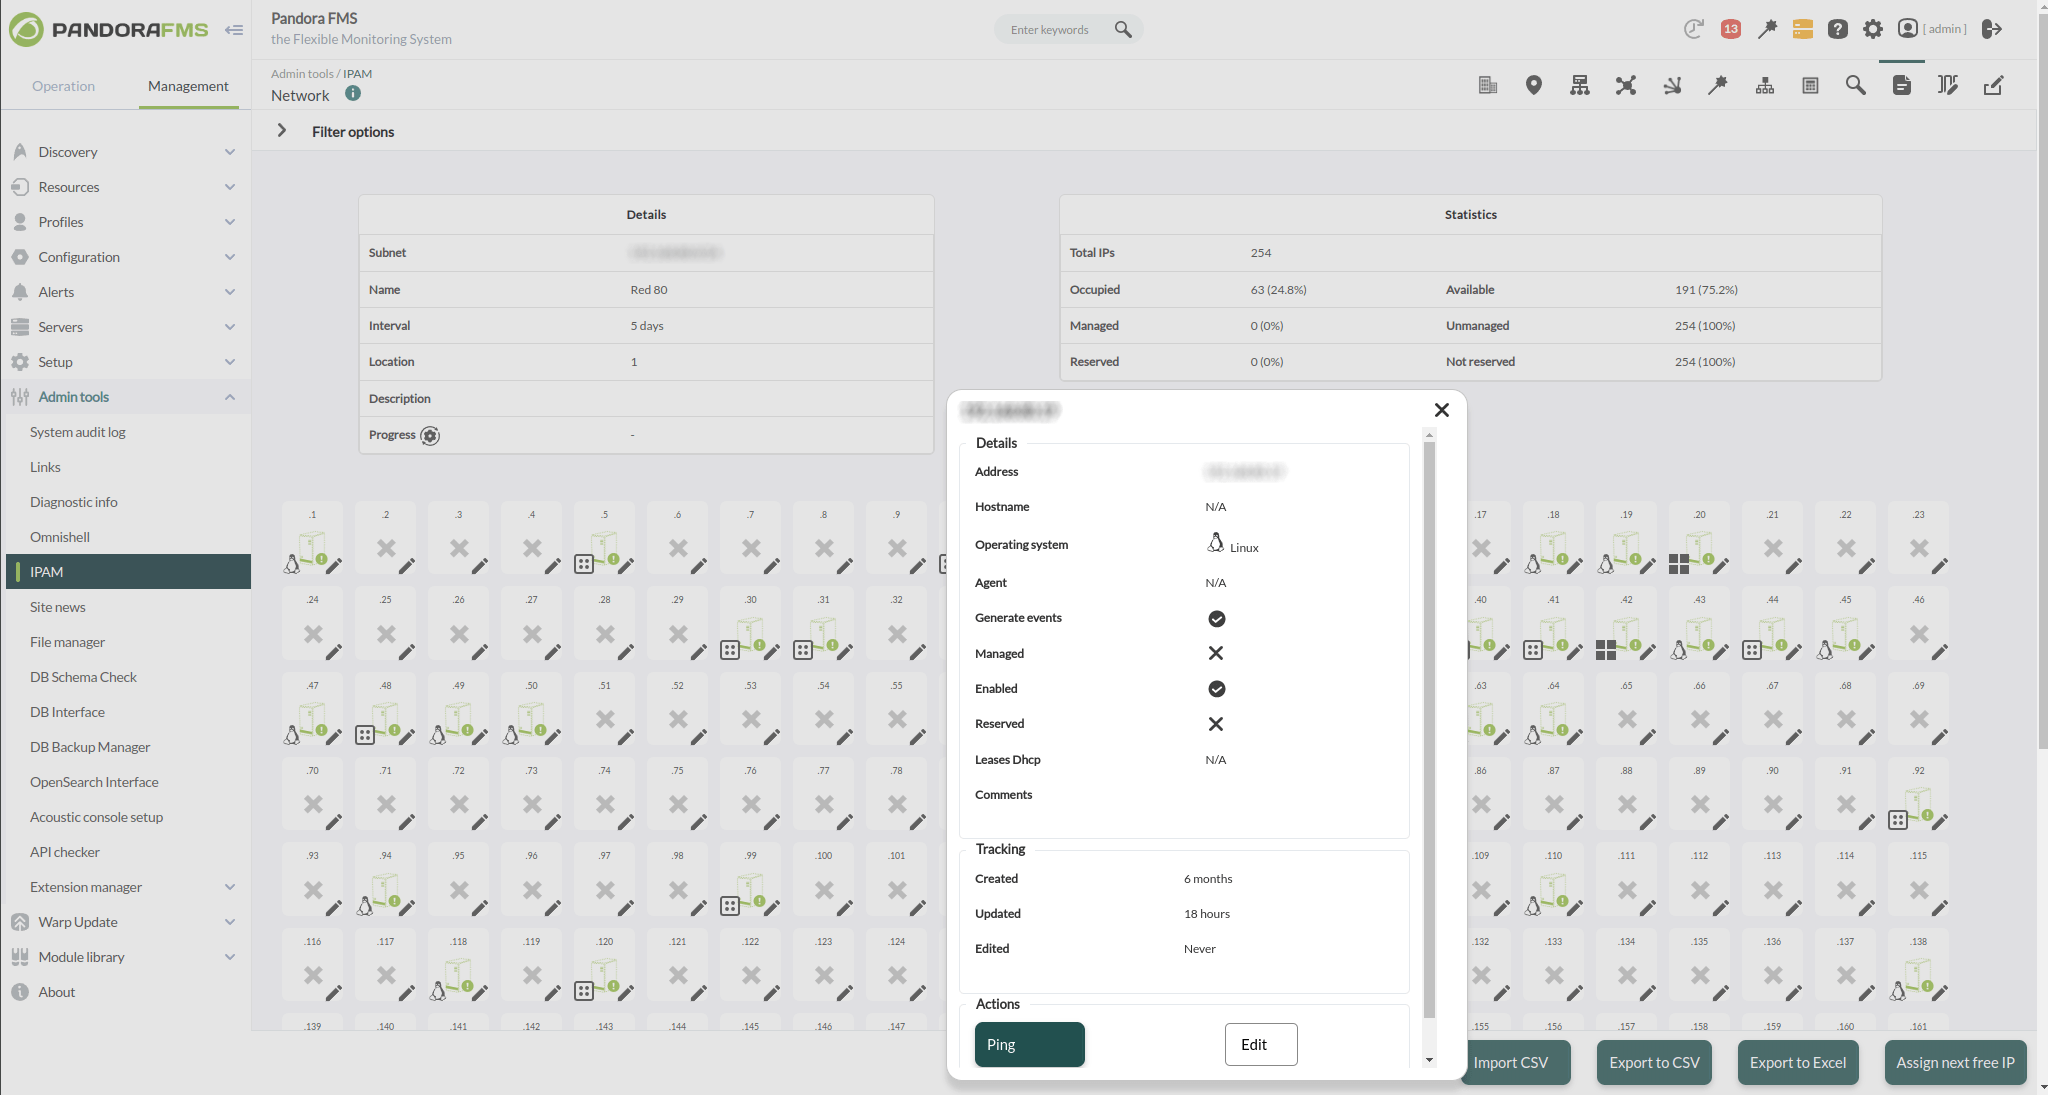
Manages networks and super-networks. Physical locations, IP reservations and various usage maps. Get alerts when you run out of available IPs. Can be integrated with an external DHCP server.
Netflow
Get real-time statistics of your network equipment (routers, switches, firewalls) and provide usage reports, bottlenecks or diagnose problems.
Network Configuration Manager
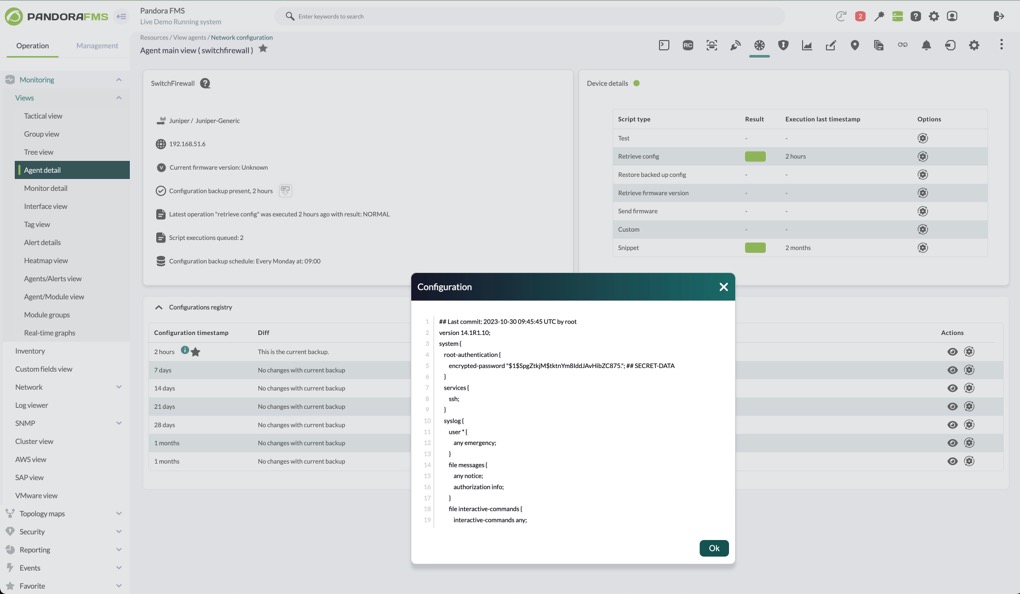
Massively update firmwares, distribute configuration changes with a single click and make configuration backups. Detect configuration changes in your equipment and recover the last known configuration.
Cloud and Virtual Monitoring
Unify the monitoring of your applications regardless of their operating model, in physical infrastructures, SaaS, PaaS or IaaS. Pandora FMS integrates natively with AWS, Azure and Google Cloud as well as the major virtualization systems in the market.
Log supervision
Collect and store all types of logs (including Windows events) to be able to search and set alerts. Logs are stored in a non-SQL storage that allows you to save data from many different sources for a long time and help you detect issues.
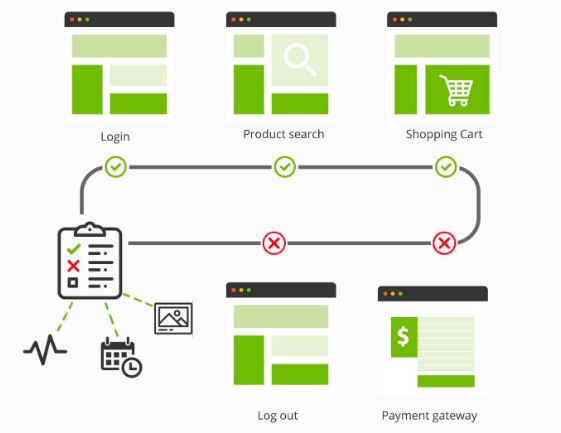
User Experience monitoring
Detect failures before your customers do. You’ll be able to check that the app works as expected.
Monitor overall performance and each of the steps separately. Get SLA reports, real-time alerts, and even a screenshot of the page that fails, so if there’s a problem, you’ll know where it happens. Perfect for detecting bottlenecks in certain steps of the transaction or for testing in different physical locations to detect network issues.
Hardware and software monitoring
You will be able to unify different sources of information in a single point: base operating system, applications, logs, storage, networks, user experience, etc.
From hardware to user applications, with default policies for each operating system, application and usage environment: Windows, Linux, Unix, Android, IBM Power i and IBM z/os. Create your own checks and deploy them centrally from Pandora FMS console. You may turn any data into valuable metrics and do all kinds of reports and dashboards with your own data.
Application monitoring
Help your IT operations teams solve application performance issues before they affect your users. Verify you application SLAs and generate service maps with what you really care about.
We have plugins for more than 500 current business technologies including corporate business applications such as Oracle, SAP and many others.
System inventory
You can’t control what you don’t know. Not only will you have a real-time view of what is happening on your systems, you will also have a detailed inventory of hardware, IP addresses, users, applications, environments, firmware versions.
Business process monitoring
Thanks to technology, business process monitoring allows the CIO and the CEO to see in real time what is happening in their business.
You will have several completely customized dashboards. In there you may see key data for your business. These data will be updated in real time, stay available 24/7 and accessible anywhere: at the office, at home, on from any phone and tablet.
You will also be able to set alerts that warn you of any anomalies and of course, you will be able to share this information with third parties easily.
Features
Dashboards
Each user can create their own dashboard that highlights the most relevant critical metrics for their team and their operations. Keep all members informed of your system’s performance levels.
These screens can be displayed in full screen, shared with external users via a URL, switched one after the other automatically with a timer, or link them together to create custom drilldowns.
The screens allow you to infinitely extend the way of displaying information, adapting it to each organization.
Reports
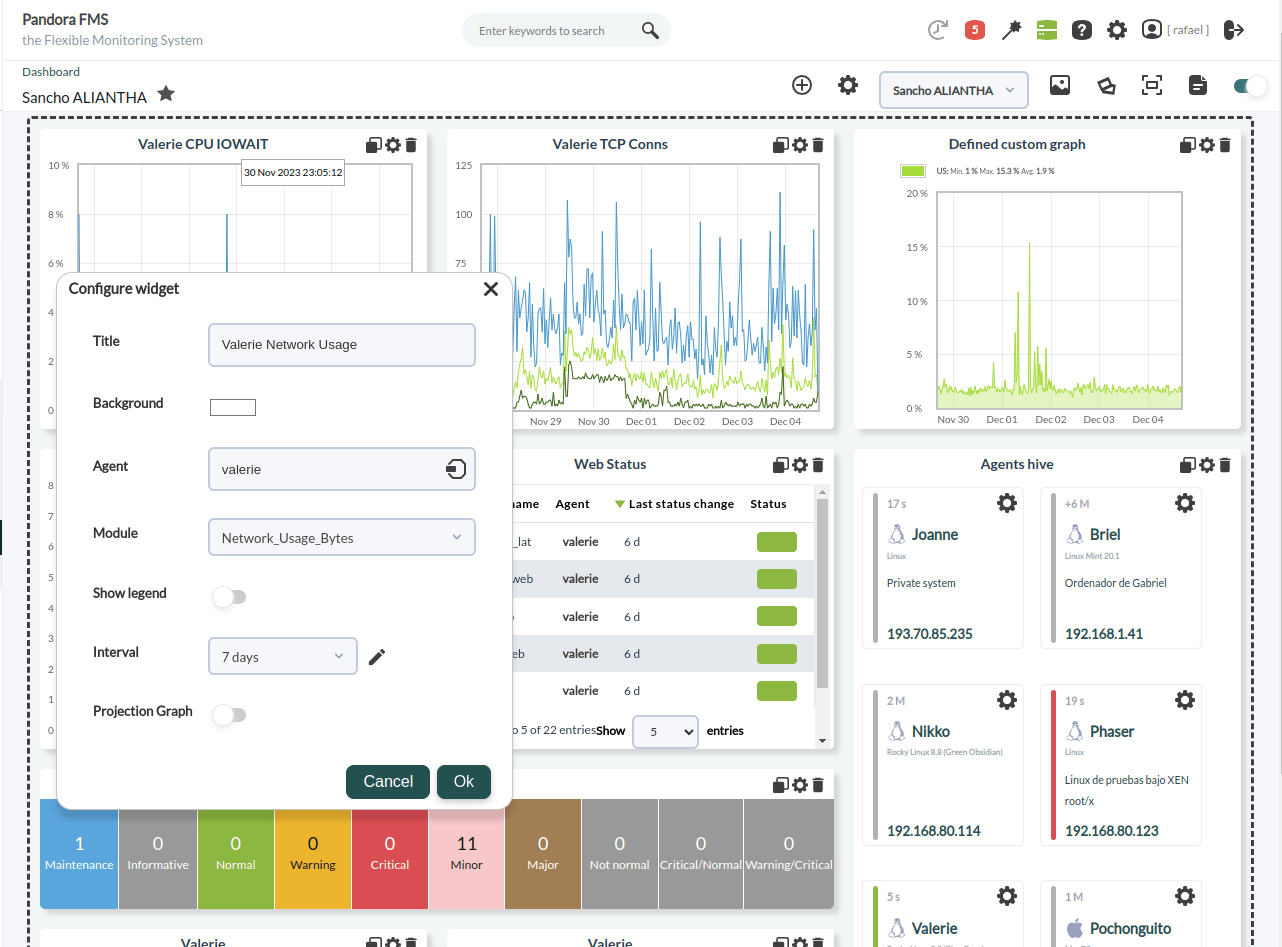
The report builder allows you to design your own reports, customized with covers, headers and different content.
Custom layouts, similar to dashboards, can be defined to display data in real time and with a history of several years. There are predefined reports for availability calculations, Top-N, SLA (monthly, weekly or daily), histograms, graphs, capacity planning reports, reporting events, inventory, configuration and more.
In addition, with the template system you can offer your own customers reports you designed yourself.
API
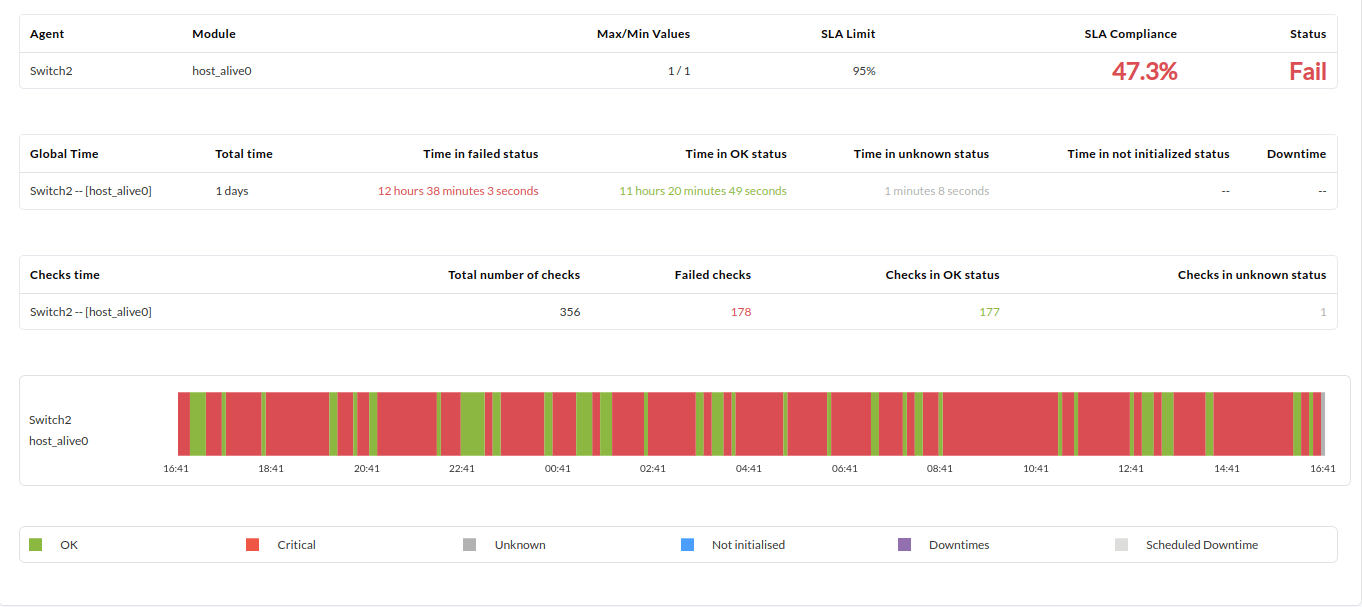
Pandora FMS has a complete API to be able to integrate your own business processes, both in configuration management, as well as notifications, provisioning processes, inventory processes, CMDB and many others. Clients like Rakuten use our API to streamline their internal processes. Check our documentation for the scope of the API.
Our API is constantly evolving, but always retaining backward compatibility so that any integration already made keeps on working.
Multitenant / MSP
Multiple customers with different views, sharing a single platform, with no limits. Common reporting templates so they only have to apply it to those assets they see. A dashboard system that allows you to offer customers real-time information, or schedule PDF reports for their periodic forwarding by eMail.
Pandora FMS allows you to provide service to your customers (or even self-service) in an all-in-one solution.
Alerts and notifications
Pandora FMS alerts are designed to integrate into existing work cycles, from the most basic like an email to the most up-to-date like Slack or Telegram. Notifications also help schedule automatic actions such as turning on/off remote systems, activating actuators or creating incidents through Remedy, Zendesk, Jira, OTRs, etc.
Alerts include escalations, special day exceptions, scheduled downtimes, weekends, and many other customization options.
Policies
They allow homogenization of the monitoring and to deploy a standard monitoring by technologies.
They allow the configuration of hundreds of agents in a simple way, with a couple of clicks. Without policies, managing thousands of computers consistently is very difficult and time consuming. Policies allow for reuse and distribution of changes across large system groups.
Distributed monitoring
In complex environments, there are inaccessible networks that are difficult to monitor through centralized discovery. Our Satellite Servers are capable of obtaining information from the network and systems in an autonomous, distributed and integrated manner. Perfect for remote customer networks.
Omnishell
IT automation: centralized remote command execution. For server and workstation management and configuration. Taking advantage of monitoring agent deployment, you may also run advanced scripts remotely.
High scalability
The federated structure of Pandora FMS allows to distribute the whole load between different nodes, so that the processing load is shared and processed in parallel. Our Command Center allows to display and manage all the information together. We have licenses for several hundred thousand operating agents.
Root cause monitoring
We help you find the needle in the haystack. It is much more efficient to visually show the source of the failure than to simply receive hundreds of events per second. Pandora FMS offers the value of its service monitoring, which allows you to filter all information and show only what is critical for each department.
Pandora FMS Features Map
+500 integrations: Expand the power of your monitoring with the best plugins
At Pandora FMS, we offer real solutions to everyday problems through application plugins, in collaboration with our customers. We have integrations of current technologies, used in production in environments around the world.
We support emerging, established technologies and even legacy systems.
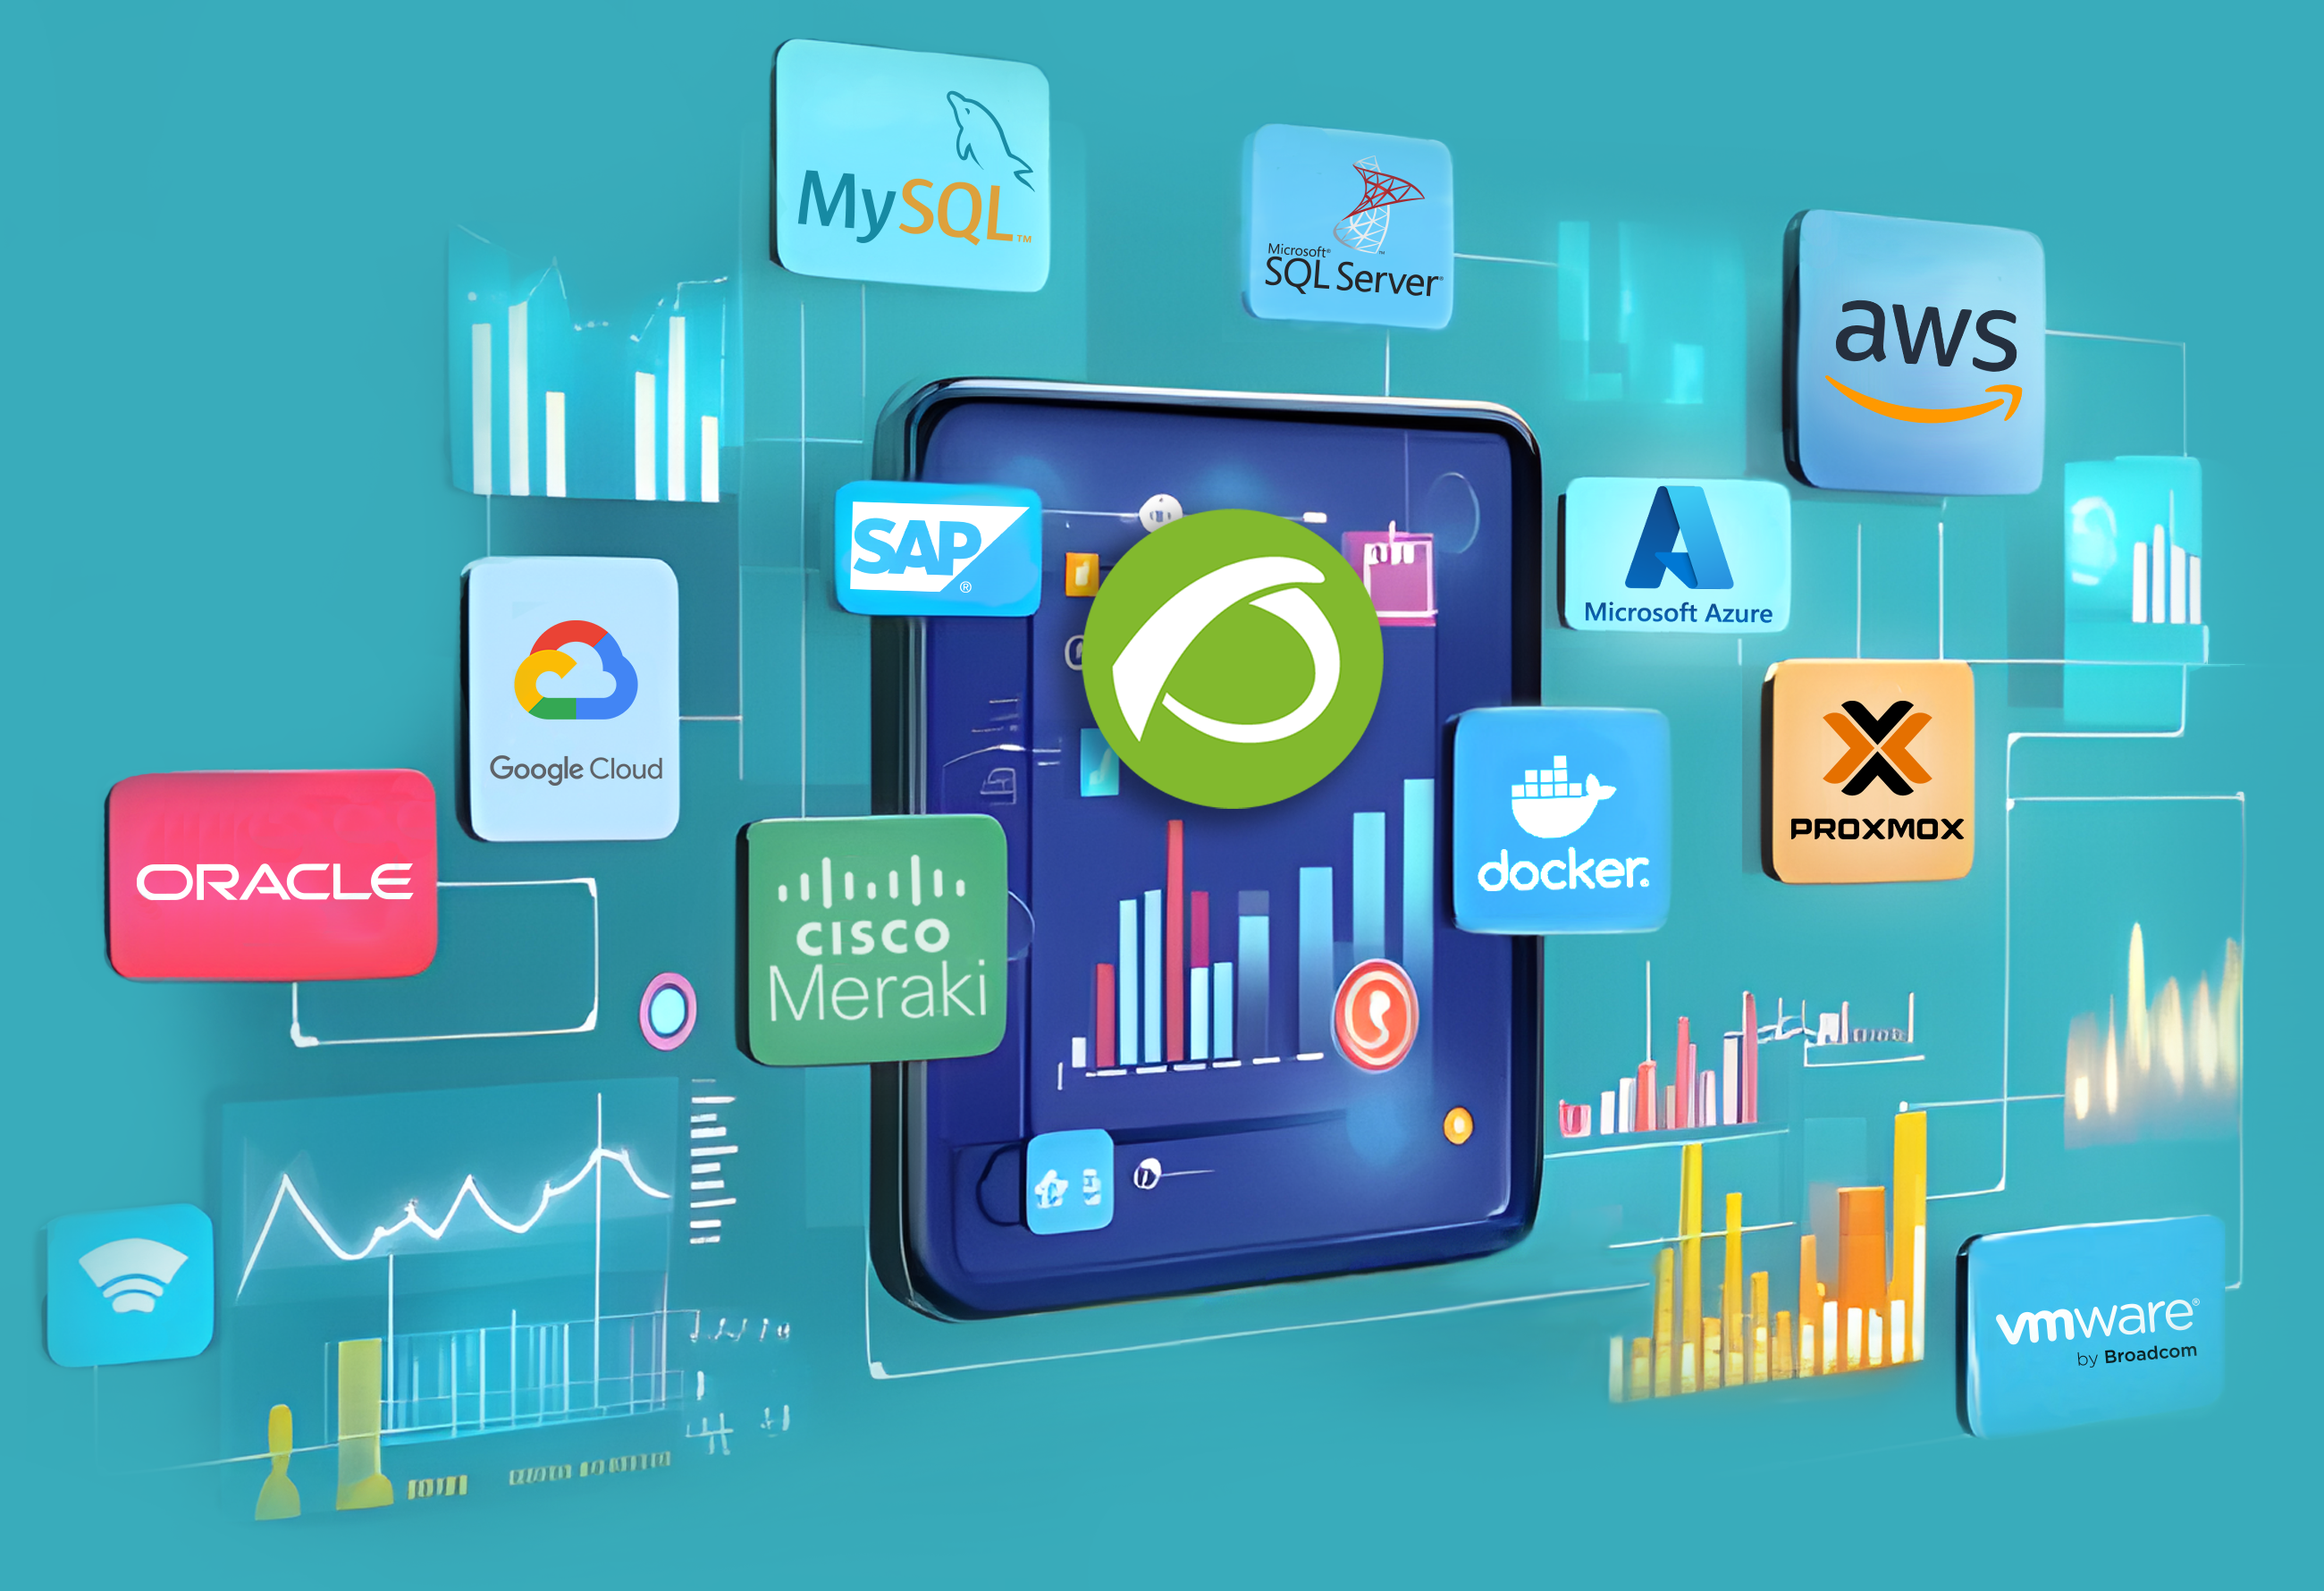
Since we started our project in 2005, customers from different parts of the world have relied on Pandora FMS. This is just a sample.


An effort from our entire workforce, users and customers that makes Pandora FMS better every day. This is a recognition of our entire trajectory and shows that Opensource is still alive and that we are one of the leading and pioneering projects in Europe.

Doubts, suggestions or comments?
Does our proposal sound appealing?


