






Observabilidad ITIT observabilityObservabilité ITITオブザーバビリティIT-наблюдаемость
Observabilidad IT para analizar y diagnosticar tu entornoIT observability to analyze and diagnose your environmentObservabilité IT pour analyser et diagnostiquer votre environnementIT環境の分析と診断を支えるオブザーバビリティIT-наблюдаемость для анализа и диагностики вашей среды
Unifica la observabilidad IT de redes, servidores, aplicaciones y servicios en entornos híbridos y distribuidos. Consulta métricas, eventos, alertas, logs e históricos en Pandora FMS para analizar el rendimiento, detectar anomalías e investigar incidencias con dashboards y mapas de servicio.Unify IT observability across networks, servers, applications and services in hybrid and distributed environments. Explore metrics, events, alerts, logs and historical data in Pandora FMS to analyze performance, spot anomalies and investigate incidents using dashboards and service maps.Unifiez l’observabilité IT des réseaux, serveurs, applications et services dans des environnements hybrides et distribués. Consultez métriques, événements, alertes, logs et historiques avec Pandora FMS pour analyser les performances, repérer les anomalies et examiner les incidents grâce aux tableaux de bord et cartes de service.Pandora FMSで、ハイブリッド・分散環境のネットワーク、サーバー、アプリケーション、サービスに関するITオブザーバビリティを一元化。メトリクス、イベント、アラート、ログ、履歴データをダッシュボードやサービスマップで確認し、性能分析、異常の把握、インシデント調査に役立てます。Объедините IT-наблюдаемость сетей, серверов, приложений и сервисов в гибридной и распределённой среде. Анализируйте метрики, события, оповещения, логи и исторические данные в Pandora FMS, чтобы оценивать производительность, выявлять аномалии и исследовать инциденты с помощью панелей и карт сервисов.
Contacta con nuestro equipo para solicitar una demo, resolver tus dudas o recibir un presupuesto personalizado
Descubre todo lo que Pandora FMS puede hacer por ti con nuestra trial completa y funcional

Una alerta te avisa. Investigar exige más contextoAn alert notifies you. Investigation requires more contextUne alerte vous avertit. Enquêter exige plus de contexteアラートは通知です。調査にはさらに多くの情報が必要ですОповещение сообщает о сбое. Расследование требует контекста
Detectar que algo va mal es el primer paso. Para analizar una degradación necesitas consultar qué métricas han cambiado, qué eventos se registraron y cómo se comportaban los sistemas relacionados.Detecting an issue is only the first step. To analyze degradation, review changing metrics, recorded events and the behavior of related systems.Détecter une anomalie n’est que la première étape. Pour analyser une dégradation, consultez les métriques modifiées, les événements enregistrés et le comportement des systèmes associés.異常の検知は最初の一歩です。性能低下を分析するには、変化したメトリクス、記録されたイベント、関連システムの動作を確認する必要があります。Обнаружить сбой — лишь первый шаг. Для анализа ухудшения изучите изменившиеся метрики, зарегистрированные события и поведение связанных систем.
Datos en varias herramientasData spread across toolsDonnées disperséesデータが複数のツールに分散Данные в разных инструментах
La información relevante está repartida entre equipos y consolas.Relevant information is spread across teams and consoles.Les informations utiles sont réparties entre équipes et consoles.必要な情報が複数のチームやコンソールに分散しています。Нужная информация распределена между командами и консолями.
Históricos insuficientesInsufficient historical dataHistorique insuffisant履歴データの不足Недостаточно исторических данных
Cuesta comparar el comportamiento actual con periodos anteriores.It is difficult to compare current behavior with previous periods.Il est difficile de comparer le comportement actuel aux périodes précédentes.現在の動作を過去の期間と比較しにくくなります。Сложно сравнить текущее поведение с предыдущими периодами.
Servicios sin visión comúnNo shared service viewAbsence de vue commune des servicesサービス全体を把握できないНет единой картины сервисов
El estado de los componentes no siempre refleja por sí solo el del servicio.Component status alone does not always reflect overall service health.L’état des composants ne reflète pas toujours à lui seul celui du service.コンポーネントの状態だけではサービス全体の状態を把握できない場合があります。Состояние компонентов не всегда отражает общее состояние сервиса.
Analiza el comportamiento de tu entorno con datos operativosAnalyze your environment using operational dataAnalysez le comportement de votre environnement grâce aux données opérationnelles運用データでIT環境の動作を分析Анализируйте работу своей среды по операционным данным
Métricas de infraestructuraInfrastructure metricsMétriques d’infrastructureインフラのメトリクスМетрики инфраструктуры
Consulta consumo, capacidad, disponibilidad y respuesta de los sistemas supervisados.Review usage, capacity, availability and response of monitored systems.Consultez la consommation, la capacité, la disponibilité et les temps de réponse des systèmes supervisés.監視対象システムのリソース使用量、容量、可用性、応答を確認します。Изучайте загрузку, ёмкость, доступность и отклик контролируемых систем.
Eventos y alertasEvents and alertsÉvénements et alertesイベントとアラートСобытия и оповещения
Revisa cambios de estado y notificaciones asociados a los elementos monitorizados.Review status changes and notifications related to monitored elements.Consultez les changements d’état et les notifications des éléments supervisés.監視対象に関連する状態変化や通知を確認します。Просматривайте изменения состояния и уведомления по контролируемым объектам.
LogsLogsJournauxログЛоги
Incorpora registros compatibles para ampliar el contexto de una incidencia y realizar búsquedas.Include compatible logs to add context to incidents and run searches.Ajoutez les journaux compatibles pour contextualiser les incidents et effectuer des recherches.対応ログを取り込み、インシデントの状況把握や検索に活用します。Подключайте совместимые логи для контекста инцидента и поиска.
HistóricosHistorical dataHistoriques履歴Исторические данные
Compara periodos y localiza el inicio de un comportamiento anómalo.Compare periods and find when unusual behavior began.Comparez les périodes et identifiez le début d’un comportement anormal.期間を比較し、異常な動作が始まった時点を特定します。Сравнивайте периоды и определяйте начало необычного поведения.
Dashboards e informesDashboards and reportsTableaux de bord et rapportsダッシュボードとレポートПанели и отчёты
Adapta vistas para operación diaria, seguimiento y análisis posterior.Customize views for daily operations, tracking and later analysis.Adaptez les vues à l’exploitation quotidienne, au suivi et à l’analyse ultérieure.日々の運用、監視、事後分析に合わせて表示を調整できます。Настраивайте представления для ежедневной работы, контроля и последующего анализа.
Mapas de servicioService mapsCartes de serviceサービスマップКарты сервисов
Representa elementos y relaciones definidos en la plataforma para supervisar servicios desde una visión operativa.Display elements and relationships defined in the platform to monitor services from an operational view.Représentez les éléments et les relations définis dans la plateforme pour superviser les services.プラットフォームで定義した要素と関係を表示し、サービスを運用視点で監視します。Отображайте элементы и связи, настроенные на платформе, для оперативного мониторинга сервисов.
De la alerta a la investigaciónFrom alert to investigationDe l’alerte à l’investigationアラートから調査までОт оповещения к расследованию
Detecta un cambio de estadoDetect a status changeDétectez un changement d’état状態変化を検知Обнаружьте изменение состояния
Una condición configurada genera un evento o una alerta.A configured condition generates an event or alert.Une condition configurée déclenche un événement ou une alerte.設定された条件によってイベントやアラートが生成されます。Настроенное условие генерирует событие или оповещение.
Consulta los indicadores relacionadosReview related indicatorsConsultez les indicateurs associés関連する指標を確認Проверьте связанные показатели
Revisa recursos, servicios y métricas disponibles en el periodo afectado.Review available resources, services and metrics for the affected period.Examinez les ressources, services et métriques de la période concernée.影響を受けた期間のリソース、サービス、メトリクスを確認します。Изучите ресурсы, сервисы и метрики за затронутый период.
Amplía el contextoAdd contextÉlargissez le contexte状況を詳しく確認Дополните контекст
Contrasta la información con históricos y logs recogidos, cuando existan.Compare the information with available historical data and collected logs.Confrontez les informations aux historiques et journaux collectés, lorsqu’ils sont disponibles.取得済みの履歴やログがあれば照合します。Сопоставьте данные с историей и собранными логами, если они доступны.
Documenta y actúaDocument and actDocumentez et intervenez記録して対応Документируйте и действуйте
Utiliza paneles, informes y los procedimientos operativos de tu organización para coordinar la intervención.Use dashboards, reports and your organization’s operating procedures to coordinate the response.Utilisez les tableaux de bord, rapports et procédures de votre organisation pour coordonner l’intervention.ダッシュボード、レポート、組織の運用手順を使って対応を調整します。Используйте панели, отчёты и внутренние процедуры для координации действий.

De los síntomas técnicos a una investigación más precisaFrom technical symptoms to more precise investigationDes symptômes techniques à une investigation plus précise技術的な兆候から、より的確な調査へОт технических симптомов к более точному расследованию
Una aplicación responde más despacioAn application responds more slowlyUne application répond plus lentementアプリケーションの応答が遅いПриложение отвечает медленнее
Compara la evolución de recursos y servicios asociados para acotar cuándo se produjo la degradación.Compare related resources and services over time to narrow down when the degradation began.Comparez l’évolution des ressources et services associés pour dater la dégradation.関連するリソースとサービスの推移を比較し、性能低下が始まった時点を絞り込みます。Сопоставьте динамику ресурсов и связанных сервисов, чтобы уточнить начало ухудшения.
Una incidencia se repite por las nochesAn incident repeats at nightUn incident se répète la nuit夜間にインシデントが繰り返されるИнцидент повторяется ночью
Consulta históricos y eventos para detectar patrones temporales y preparar comprobaciones adicionales.Review historical data and events for time-based patterns and plan further checks.Consultez les historiques et événements pour repérer des schémas temporels et préparer des vérifications.履歴やイベントを確認して時間的なパターンを探し、追加の確認を計画します。Изучите историю и события, чтобы найти временные закономерности и запланировать дополнительные проверки.
Un servicio depende de varios sistemasA service depends on several systemsUn service dépend de plusieurs systèmesサービスが複数のシステムに依存しているСервис зависит от нескольких систем
Organiza una vista operativa con sus componentes monitorizados para facilitar el seguimiento conjunto.Build an operational view of the monitored components for coordinated oversight.Organisez une vue opérationnelle des composants supervisés pour faciliter leur suivi commun.監視対象のコンポーネントを運用ビューにまとめ、全体の状況を把握します。Соберите оперативное представление контролируемых компонентов для совместного контроля.
Para profundizar en los indicadores de recuperación, consulta el concepto de MTTR.For more on recovery indicators, explore the concept of MTTR.Pour approfondir les indicateurs de rétablissement, découvrez le MTTR.復旧指標について詳しく知りたい場合は、MTTRの概念をご覧ください。Подробнее о показателях восстановления читайте в материале об MTTR. Qué es el MTTR y cómo se calcula →What MTTR means and how it is calculated →Définition du MTTR et calcul →MTTRとは何か、計算方法 →Что такое MTTR и как его рассчитывают →
Aprovecha la monitorización que ya tienes para analizar mejorUse your existing monitoring to analyze incidents more effectivelyExploitez votre supervision existante pour mieux analyser既存の監視データを活用して、より適切に分析Используйте существующий мониторинг для более точного анализа
Pandora FMS permite utilizar datos de infraestructura, red, servicios y registros en una misma plataforma operativa. Sus dashboards, alertas, históricos y opciones de personalización ayudan a adaptar la investigación a los sistemas de cada organización.Pandora FMS lets you use infrastructure, network, service and log data within one operational platform. Dashboards, alerts, historical data and customization options help adapt investigations to each organization’s systems.Pandora FMS permet d’exploiter les données d’infrastructure, de réseau, de services et de journaux dans une même plateforme. Tableaux de bord, alertes, historiques et personnalisation s’adaptent aux systèmes de chaque organisation.Pandora FMSはインフラ、ネットワーク、サービス、ログのデータを1つの運用プラットフォームで扱えます。ダッシュボード、アラート、履歴、カスタマイズ機能により、組織のシステムに合わせた調査を支援します。Pandora FMS позволяет использовать данные инфраструктуры, сети, сервисов и логов на одной операционной платформе. Панели, оповещения, история и настройки помогают адаптировать расследование к системам организации.
Las fuentes y vistas disponibles dependen de la configuración, las integraciones y la edición implantada. La plataforma no se presenta aquí como un APM de código ni como un sistema de diagnóstico autónomo.Available data sources and views depend on configuration, integrations and the deployed edition. This page does not present the platform as code-level APM or autonomous diagnosis.Les sources et vues disponibles dépendent de la configuration, des intégrations et de l’édition déployée. Cette page ne présente pas la plateforme comme un APM de code ou un diagnostic autonome.利用できるデータソースや表示は設定、連携、導入エディションに依存します。本ページはコードレベルのAPMや自律診断機能を提供すると主張するものではありません。Доступные источники и представления зависят от настроек, интеграций и редакции. Эта страница не позиционирует платформу как APM на уровне кода или автономную диагностику.
Visibilidad operativa en entornos realesOperational visibility in real environmentsVisibilité opérationnelle dans des environnements réels実際の運用環境における可視性Операционная видимость в реальных средах
Madrid Digital
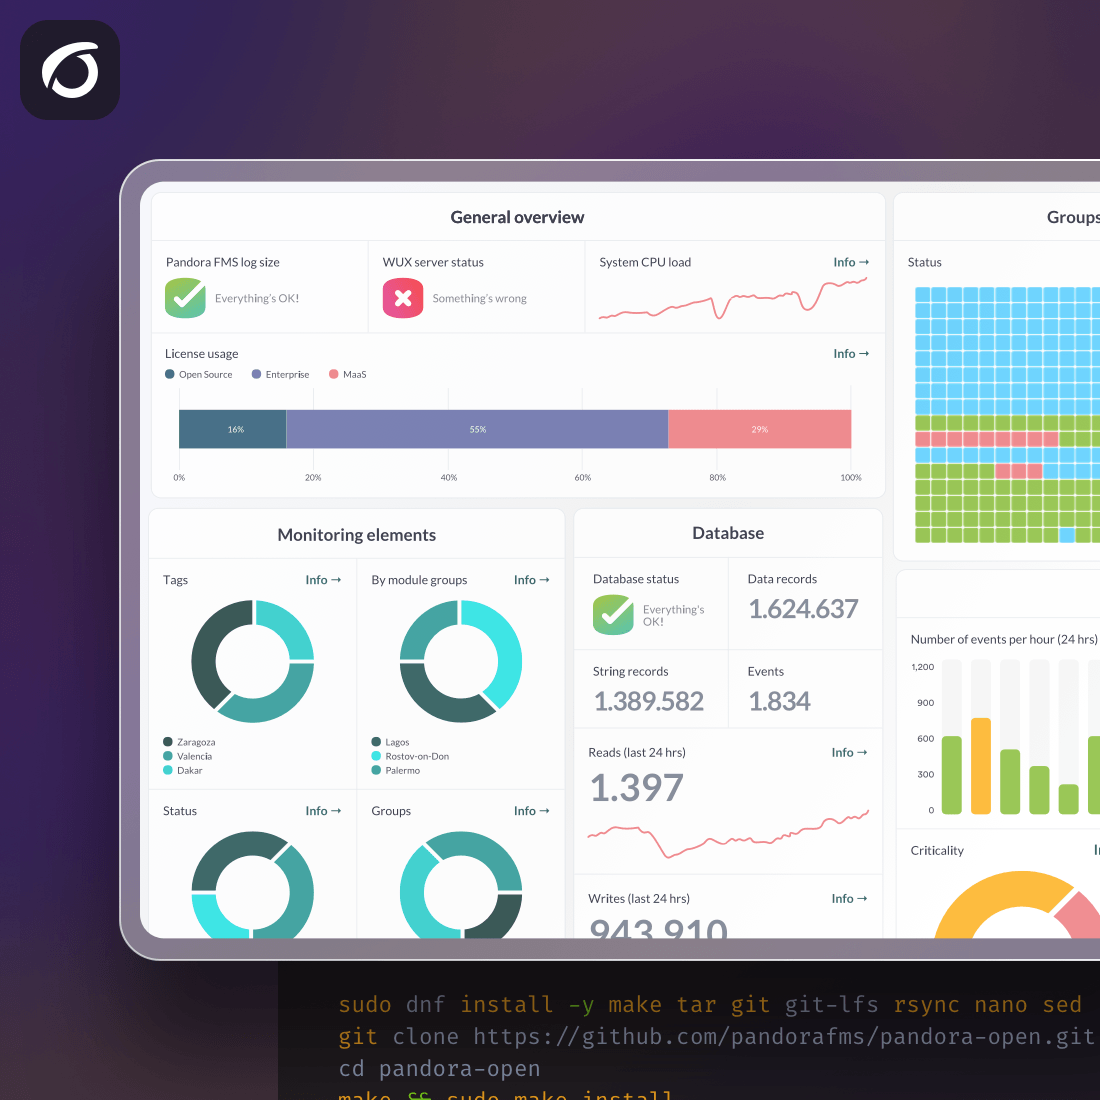
La plataforma supervisa aproximadamente 120.000 métricas de tecnologías distintas y dispone de integraciones particulares para su operación, según el caso de cliente publicado por Pandora FMS.According to the customer case published by Pandora FMS, the platform monitors approximately 120,000 metrics across different technologies and includes tailored operational integrations.D’après le cas client publié par Pandora FMS, la plateforme supervise environ 120 000 métriques de différentes technologies et comporte des intégrations adaptées à son exploitation.Pandora FMSが公開した導入事例によると、さまざまな技術の約120,000件のメトリクスを監視し、運用に合わせた個別連携を活用しています。Согласно опубликованному кейсу Pandora FMS, платформа контролирует около 120 000 метрик различных технологий и использует специальные интеграции для эксплуатации.
Ver caso de Madrid Digital →Read Madrid Digital case study →Voir le cas Madrid Digital →Madrid Digitalの導入事例を見る →Посмотреть кейс Madrid Digital →
Completa la visión de tus sistemasComplete your systems overviewComplétez votre vision des systèmesシステム全体の可視性を高めるДополните представление о ваших системах
Infraestructura ITIT infrastructureInfrastructure ITITインフラИТ-инфраструктура
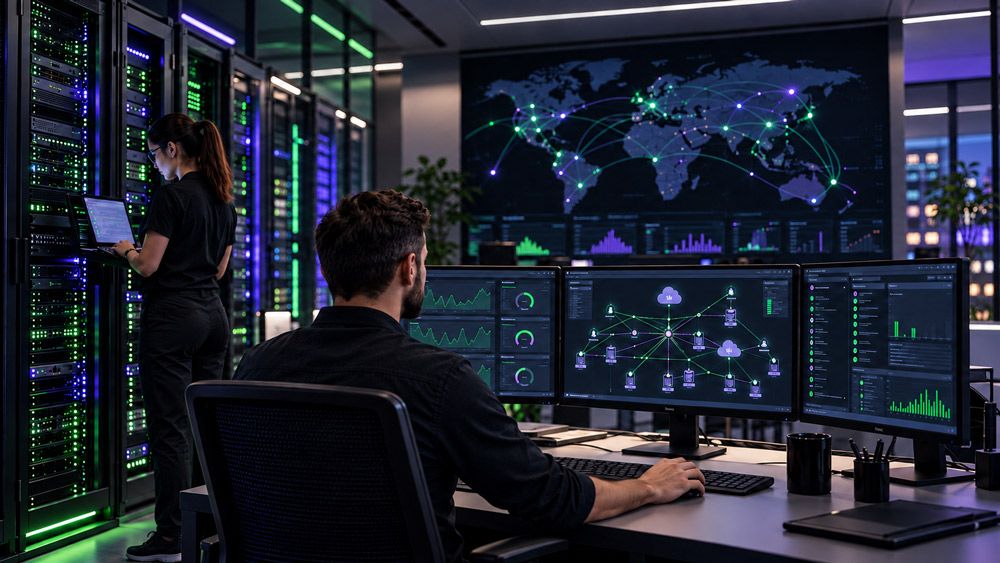
Centraliza la supervisión de distintos tipos de tecnología.Centralize monitoring across different technologies.Centralisez la supervision de technologies diverses.異なる技術の監視を一元化します。Централизуйте мониторинг различных технологий.
Ver monitorización de infraestructura IT →Explore IT infrastructure monitoring →Voir la supervision de l’infrastructure IT →ITインフラ監視を見る →Мониторинг ИТ-инфраструктуры →
ServidoresServersServeursサーバーСерверы
Monitoriza recursos, procesos y servicios de sistemas Windows y Linux.Monitor resources, processes and services on Windows and Linux.Supervisez les ressources, processus et services Windows et Linux.WindowsとLinuxのリソース、プロセス、サービスを監視します。Контролируйте ресурсы, процессы и службы Windows и Linux.
Ver monitorización de servidores →Explore server monitoring →Voir la supervision des serveurs →サーバー監視を見る →Мониторинг серверов →
Gestión de logsLog managementGestion des logsログ管理Управление логами
Recoge y consulta registros para su análisis operativo.Collect and review logs for operational analysis.Collectez et consultez les journaux pour l’analyse opérationnelle.運用分析のためにログを収集・参照します。Собирайте и просматривайте логи для операционного анализа.
Ver gestión de logs →Explore log management →Voir la gestion des logs →ログ管理を見る →Управление логами →Para profundizar en el diagnóstico, descubre cómo la telemetría ayuda a analizar el comportamiento de la infraestructura.To explore diagnosis further, learn how telemetry helps analyze infrastructure behavior.Pour approfondir le diagnostic, découvrez comment la télémétrie aide à analyser l’infrastructure.診断についてさらに詳しく知るには、テレメトリーがインフラの動作分析にどう役立つかをご覧ください。Узнайте подробнее, как телеметрия помогает анализировать работу инфраструктуры. Leer la guía de telemetría →Read the telemetry guide →Lire le guide de télémétrie →テレメトリーのガイドを見る →Читать руководство по телеметрии →
Preguntas frecuentes sobre observabilidad ITIT observability FAQsQuestions fréquentes sur l’observabilité ITITオブザーバビリティに関するよくある質問Частые вопросы об IT-наблюдаемости
¿Qué diferencia hay entre monitorización y observabilidad?What is the difference between monitoring and observability?Quelle différence entre supervision et observabilité ?監視とオブザーバビリティの違いは?Чем мониторинг отличается от наблюдаемости?
La monitorización supervisa estados y métricas definidos. La observabilidad utiliza información operativa como métricas, eventos, logs e históricos para investigar cómo se comportan los sistemas y servicios.Monitoring tracks defined states and metrics. Observability uses operational data such as metrics, events, logs and history to investigate system and service behavior.La supervision suit des états et métriques définis. L’observabilité exploite métriques, événements, journaux et historiques pour analyser le comportement des systèmes et services.監視は定義された状態やメトリクスを確認します。オブザーバビリティはメトリクス、イベント、ログ、履歴などの運用情報を用いて、システムやサービスの動作を調査します。Мониторинг отслеживает заданные состояния и метрики. Наблюдаемость использует метрики, события, логи и историю для анализа поведения систем и сервисов.
¿Qué datos utiliza Pandora FMS para investigar incidencias?What data does Pandora FMS use to investigate incidents?Quelles données Pandora FMS utilise-t-il pour analyser les incidents ?Pandora FMSはインシデント調査にどのようなデータを使いますか?Какие данные Pandora FMS использует для расследования инцидентов?
Métricas, estados, eventos, históricos y, cuando están configurados, logs procedentes de los sistemas compatibles.Metrics, states, events, historical data and, when configured, logs from compatible systems.Métriques, états, événements, historiques et, s’ils sont configurés, journaux de systèmes compatibles.メトリクス、状態、イベント、履歴、設定済みの場合は対応システムのログを利用します。Метрики, состояния, события, историю и, при соответствующей настройке, логи совместимых систем.
¿Se pueden crear vistas por servicio?Can I create service-specific views?Peut-on créer des vues par service ?サービスごとのビューは作成できますか?Можно ли создавать представления по сервисам?
Sí, utilizando dashboards y mapas de servicio según la configuración de la plataforma y los elementos monitorizados.Yes, using dashboards and service maps based on the platform configuration and monitored elements.Oui, grâce aux tableaux de bord et cartes de service selon la configuration et les éléments supervisés.はい。設定内容と監視対象に応じて、ダッシュボードやサービスマップを利用できます。Да, с помощью панелей и карт сервисов в зависимости от настроек и контролируемых компонентов.
¿Qué diferencia hay entre una vista operativa y una herramienta APM?How does an operational view differ from an APM tool?Quelle différence entre une vue opérationnelle et un outil APM ?運用ビューとAPMツールはどう違いますか?Чем операционное представление отличается от APM?
Una vista operativa reúne información sobre sistemas y servicios monitorizados. El APM de código incorpora instrumentación y trazas de ejecución de aplicaciones. Comprueba las capacidades disponibles en la versión de Pandora FMS que vayas a implantar.An operational view brings together information on monitored systems and services. Code-level APM uses application instrumentation and execution traces. Check the capabilities available in the Pandora FMS edition you plan to deploy.Une vue opérationnelle réunit des informations sur les systèmes et services supervisés. L’APM de code utilise l’instrumentation et les traces d’exécution. Vérifiez les fonctions de l’édition Pandora FMS envisagée.運用ビューは監視対象のシステムやサービスの情報をまとめます。コードレベルのAPMはアプリケーション計装や実行トレースを利用します。導入予定のPandora FMSエディションの機能をご確認ください。Операционное представление объединяет данные о контролируемых системах и сервисах. APM на уровне кода использует инструментирование и трассы исполнения. Уточните возможности выбранной редакции Pandora FMS.
Revisa qué información necesitas para diagnosticar mejorReview the data you need for better diagnosisIdentifiez les données nécessaires pour mieux diagnostiquerより適切な診断に必要な情報を確認Определите, какие данные нужны для более точной диагностики
Muéstranos qué sistemas supervisas y cómo investigas hoy las incidencias.Show us which systems you monitor and how you investigate incidents today.Présentez-nous les systèmes que vous supervisez et votre méthode actuelle d’investigation.監視しているシステムと現在のインシデント調査方法を教えてください。Расскажите, какие системы вы контролируете и как расследуете инциденты сегодня.Te enseñaremos qué métricas, eventos, logs y vistas operativas puedes reunir con Pandora FMS.We will show you which metrics, events, logs and operational views you can bring together with Pandora FMS.Nous vous montrerons les métriques, événements, journaux et vues que Pandora FMS peut réunir.Pandora FMSでまとめられるメトリクス、イベント、ログ、運用ビューをご案内します。Мы покажем, какие метрики, события, логи и операционные представления можно объединить в Pandora FMS.
