New features
Security vulnerability monitoring
A set of features that allow us to monitor the security of our systems, supervising what installed applications are vulnerable. For that, data are cross-referenced with those from the inventory of each agent and also agents are remotely checked, to find out which applications are listening on the network. If offers a summary graph with all the vulnerabilities by agent.
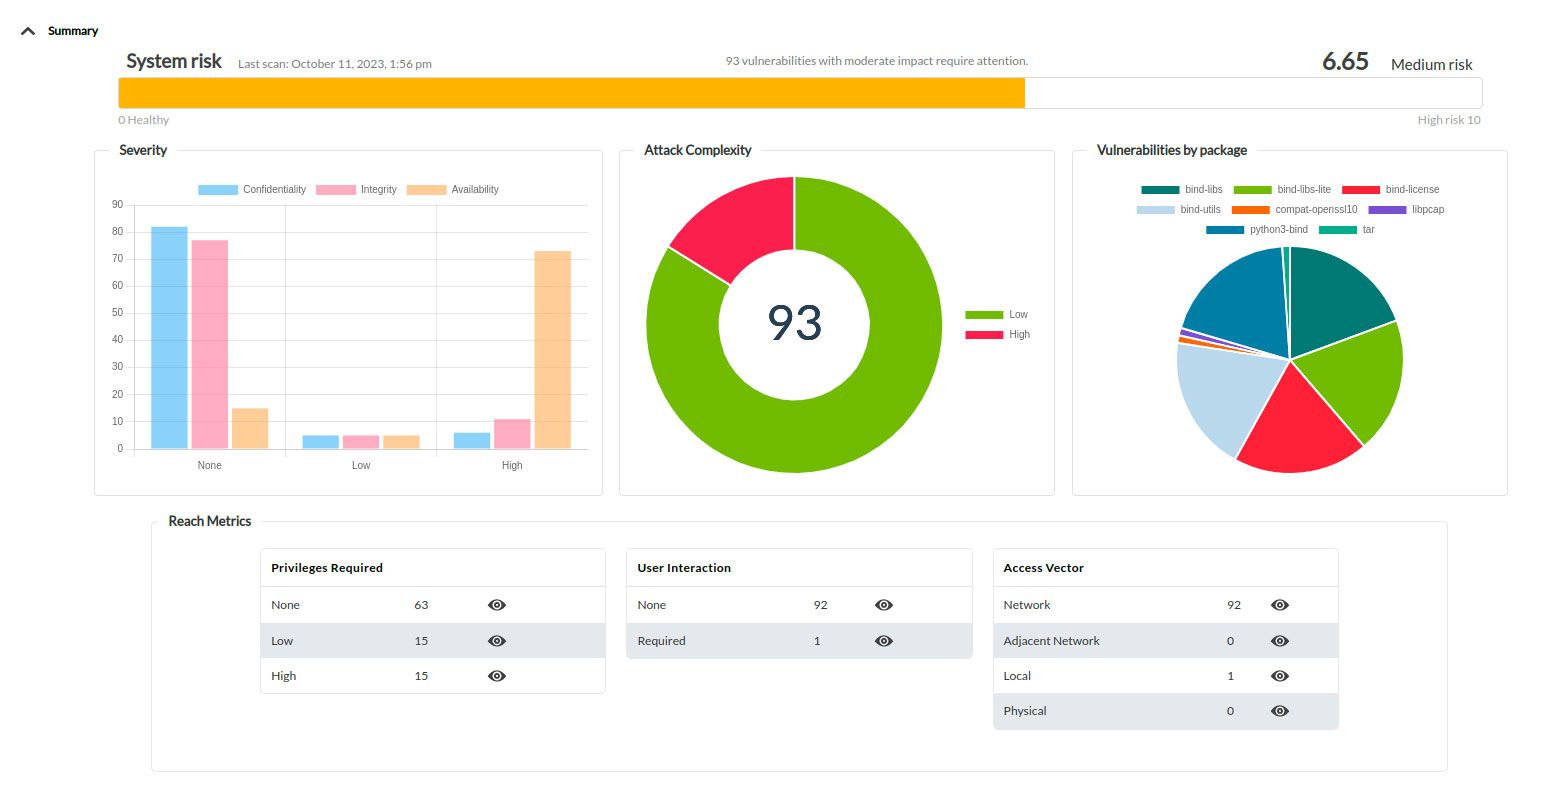 Pandora FMS uses a known vulnerability database, using CVE, NVD and other public databases.
New tactical screen
Together with important upgrades in system auto-monitoring, with dozens of new metrics, we designed a tactical screen that will display the information summary on the system status when logging in.

New dashboards and hardening reports
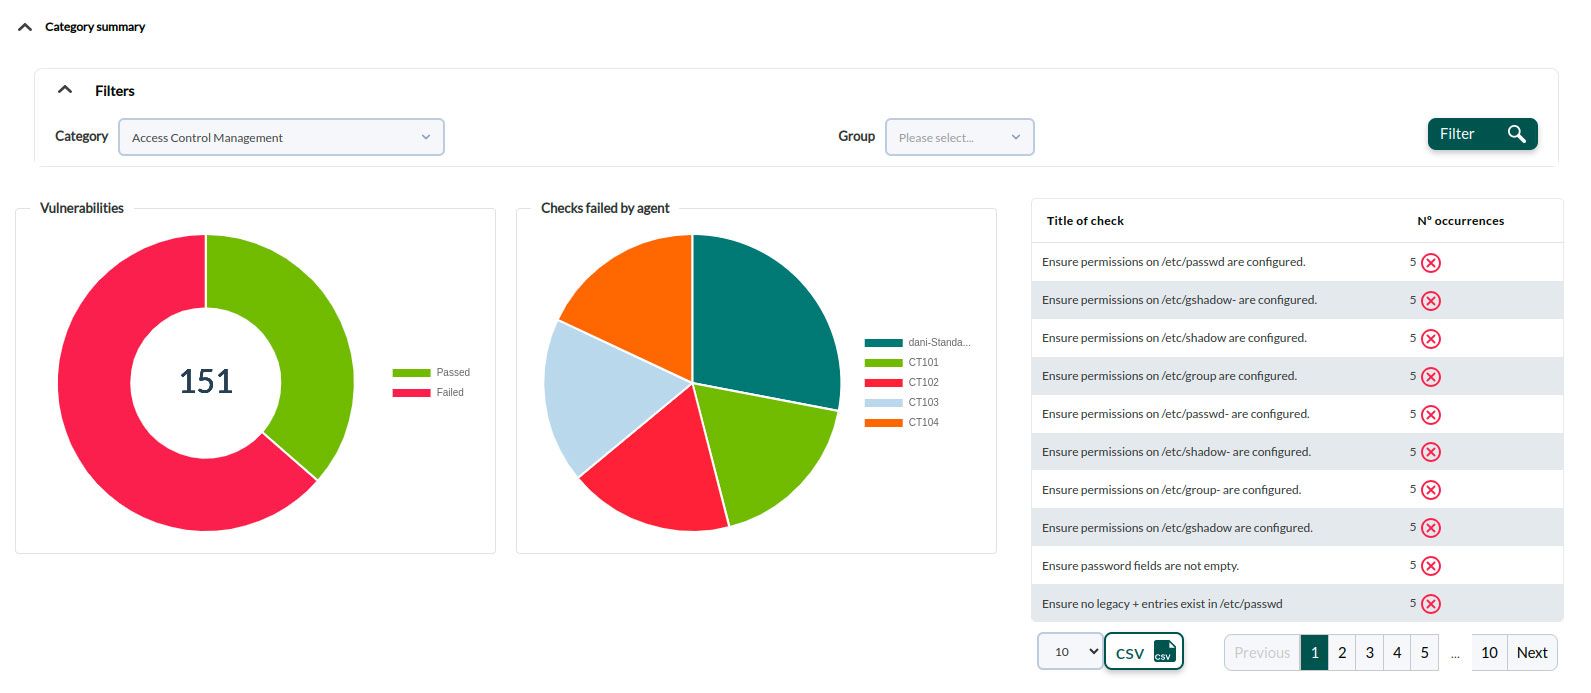
It complements the security assessment configuration feature (hardening), added in the previous version. It offers general dashboards and reports perfect for working in the steady improvement of system security. These reports are ideal for internal audits, regulation compliance and internal security departments.

New tool: Graph analytics
It is a tool conceived for failure detection, compared analysis and pattern detection. It allows users to search and compare agent and module graphs. It is accessed through the side menu Operation → Reporting → Graph analytics.
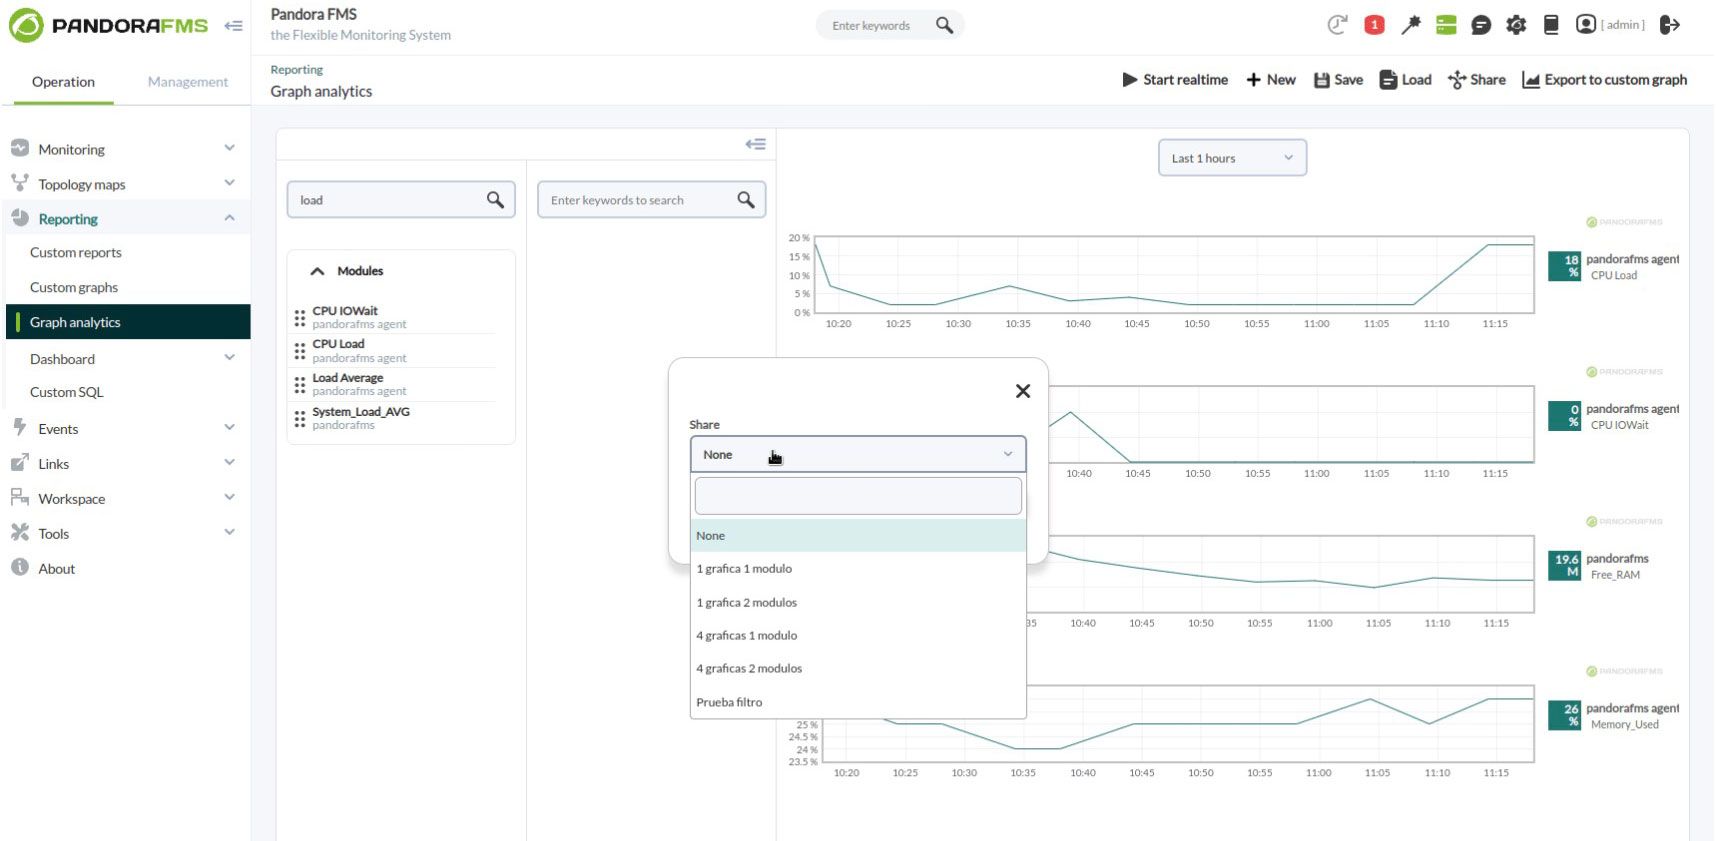 The work of organizing the most important data and information can be saved through a filter and a public link can even be shared, moreover graphs can also be exported to section Custom graph.
Complex alerts
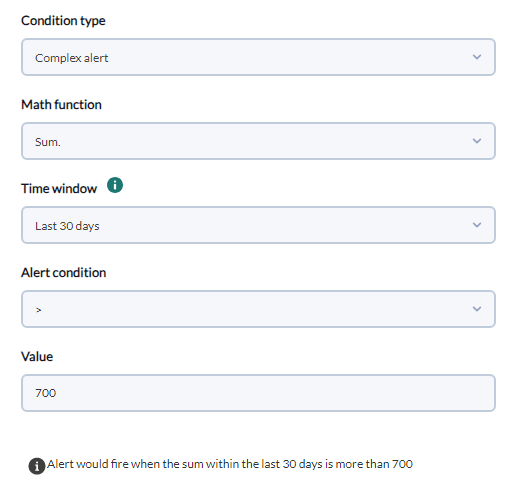
New feature to create new alert templates, which allow processing extraordinary calculations in addition to ordinary monitoring.
These complex alerts allow calculating the average or sum, or detecting the maximum and the minimum of the information monitored, such as for example receiving a warning when the CPU use percentage in a week exceeds the average.

New Discovery 2.0 plugin: Proxmox
Centralized version through Discovery 2.0 from the ProxMox Enterprise plugin that allows to retrieve data from the node API, backups, virtual machines, lxc containers and storage.
Service trees view in vertical format
Some of our clients asked for an alternate way to see services, since when there were lots of them, they were not displayed correctly, so we added an alternate way in which to display them:

Version obsolescence management
Broadened the OS management system to be able to assign expiration dates to specific SO versions, so that not only specific searches can be carried out by certain SO versions, but also generate support expiration reports (End Of Lifesupport).

New widget: Group Status Map
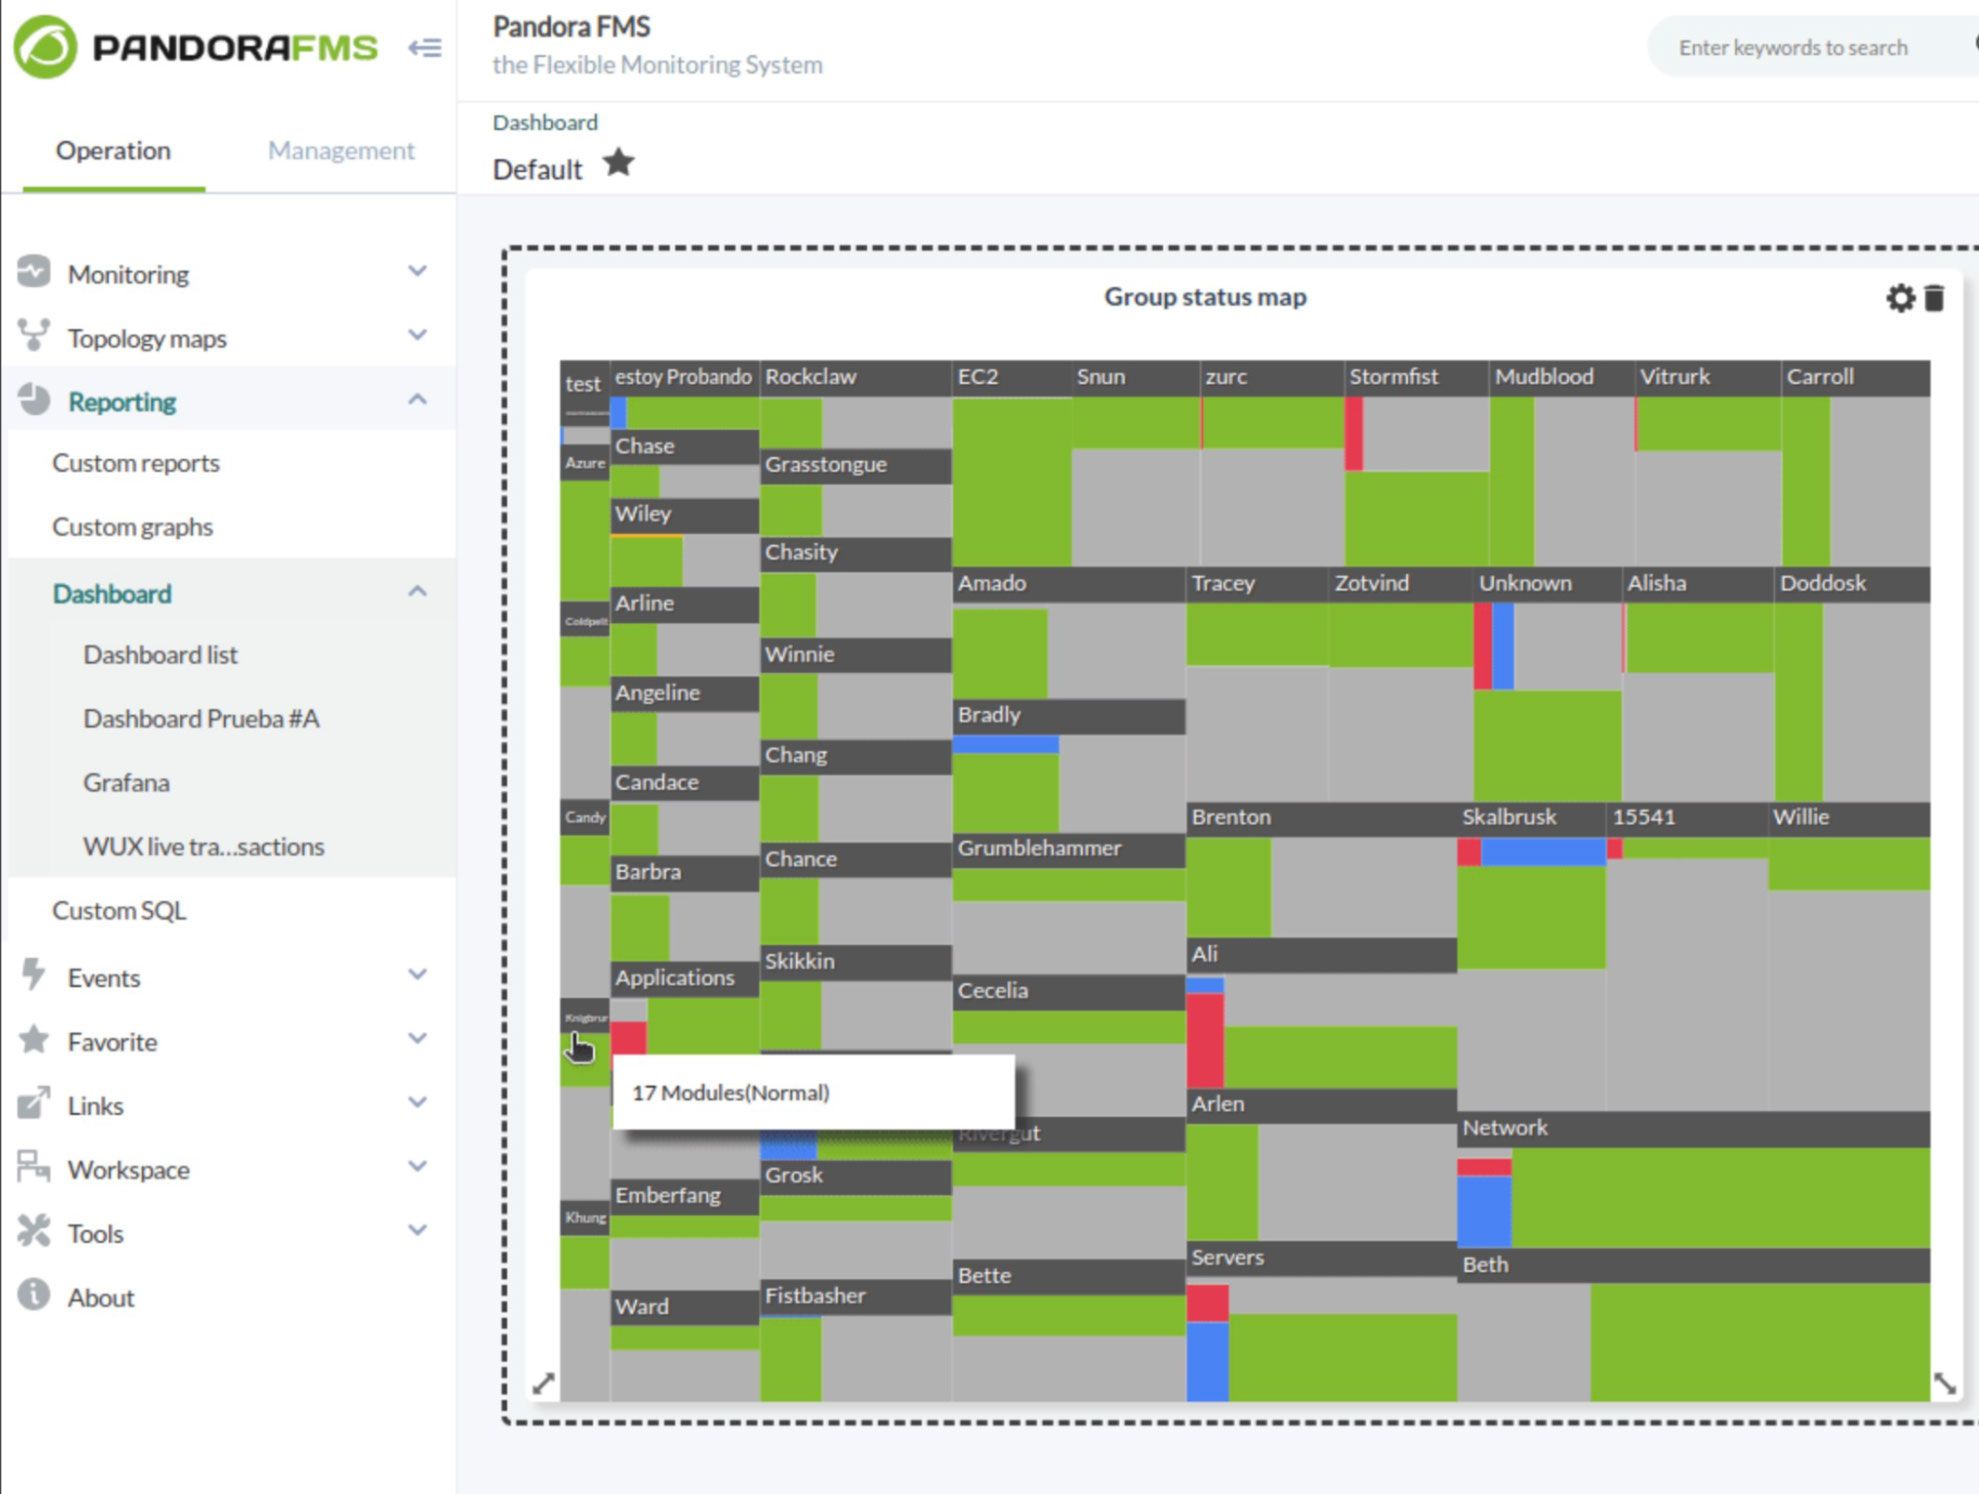
New widget that shows agent state and modules from a specific group in an interactive map in real time.
New widget: Widget cloning
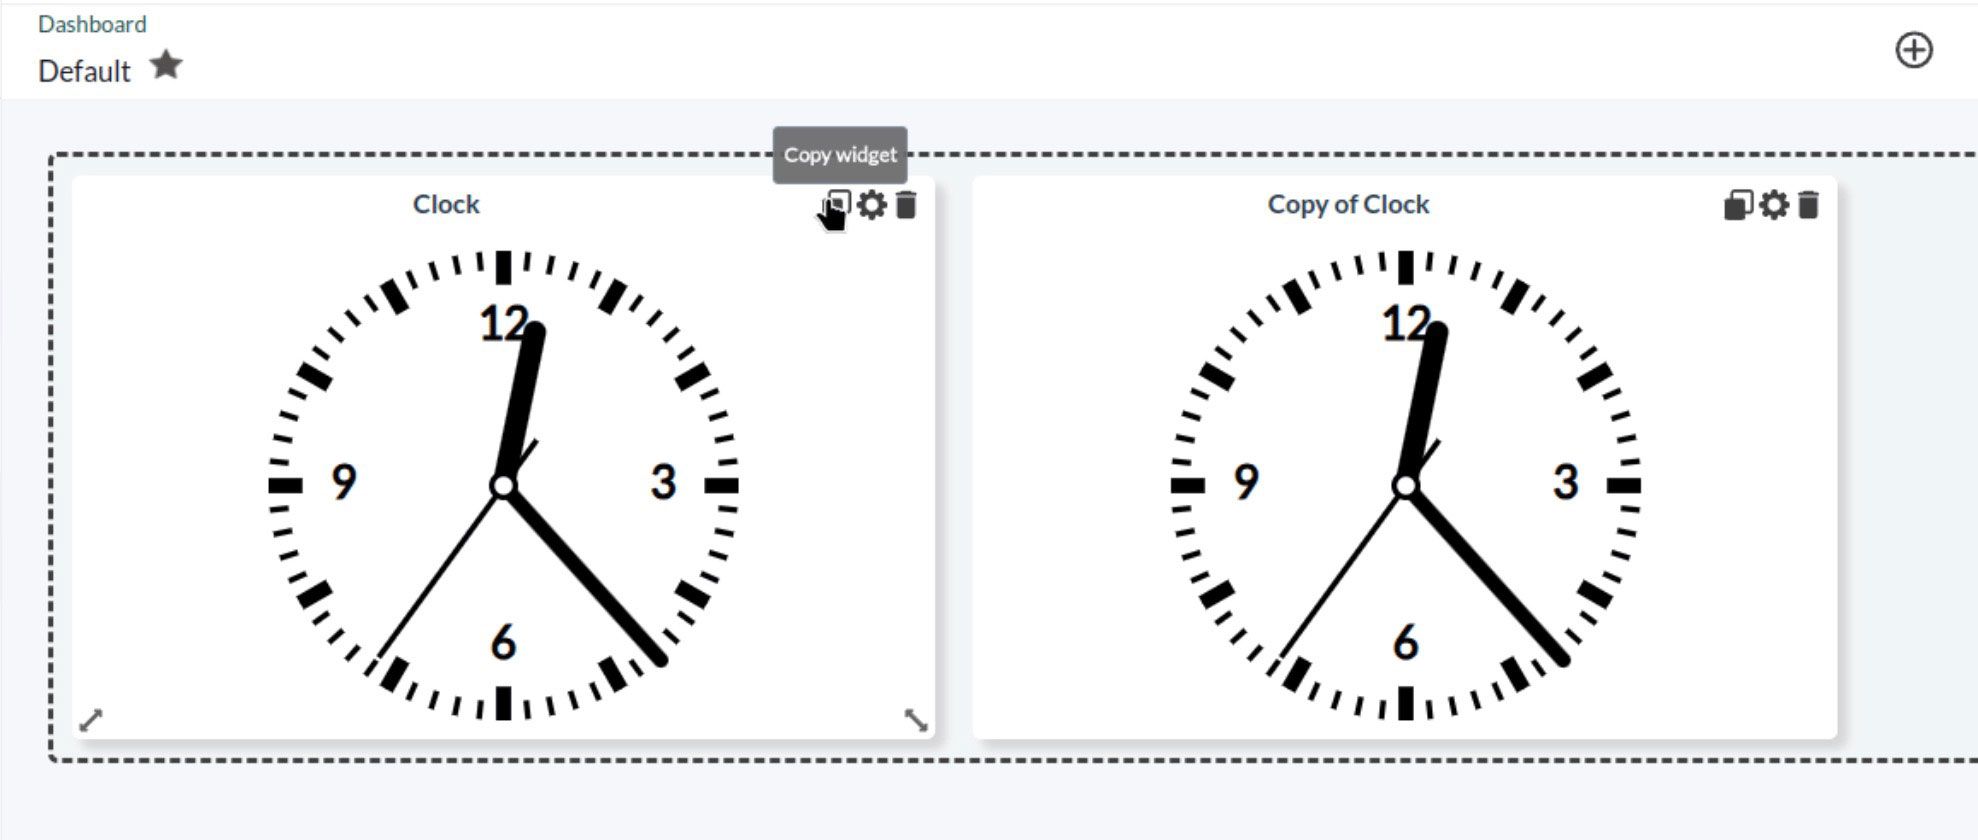
Usability improvement that enables cloning a widget within the same dashboard.
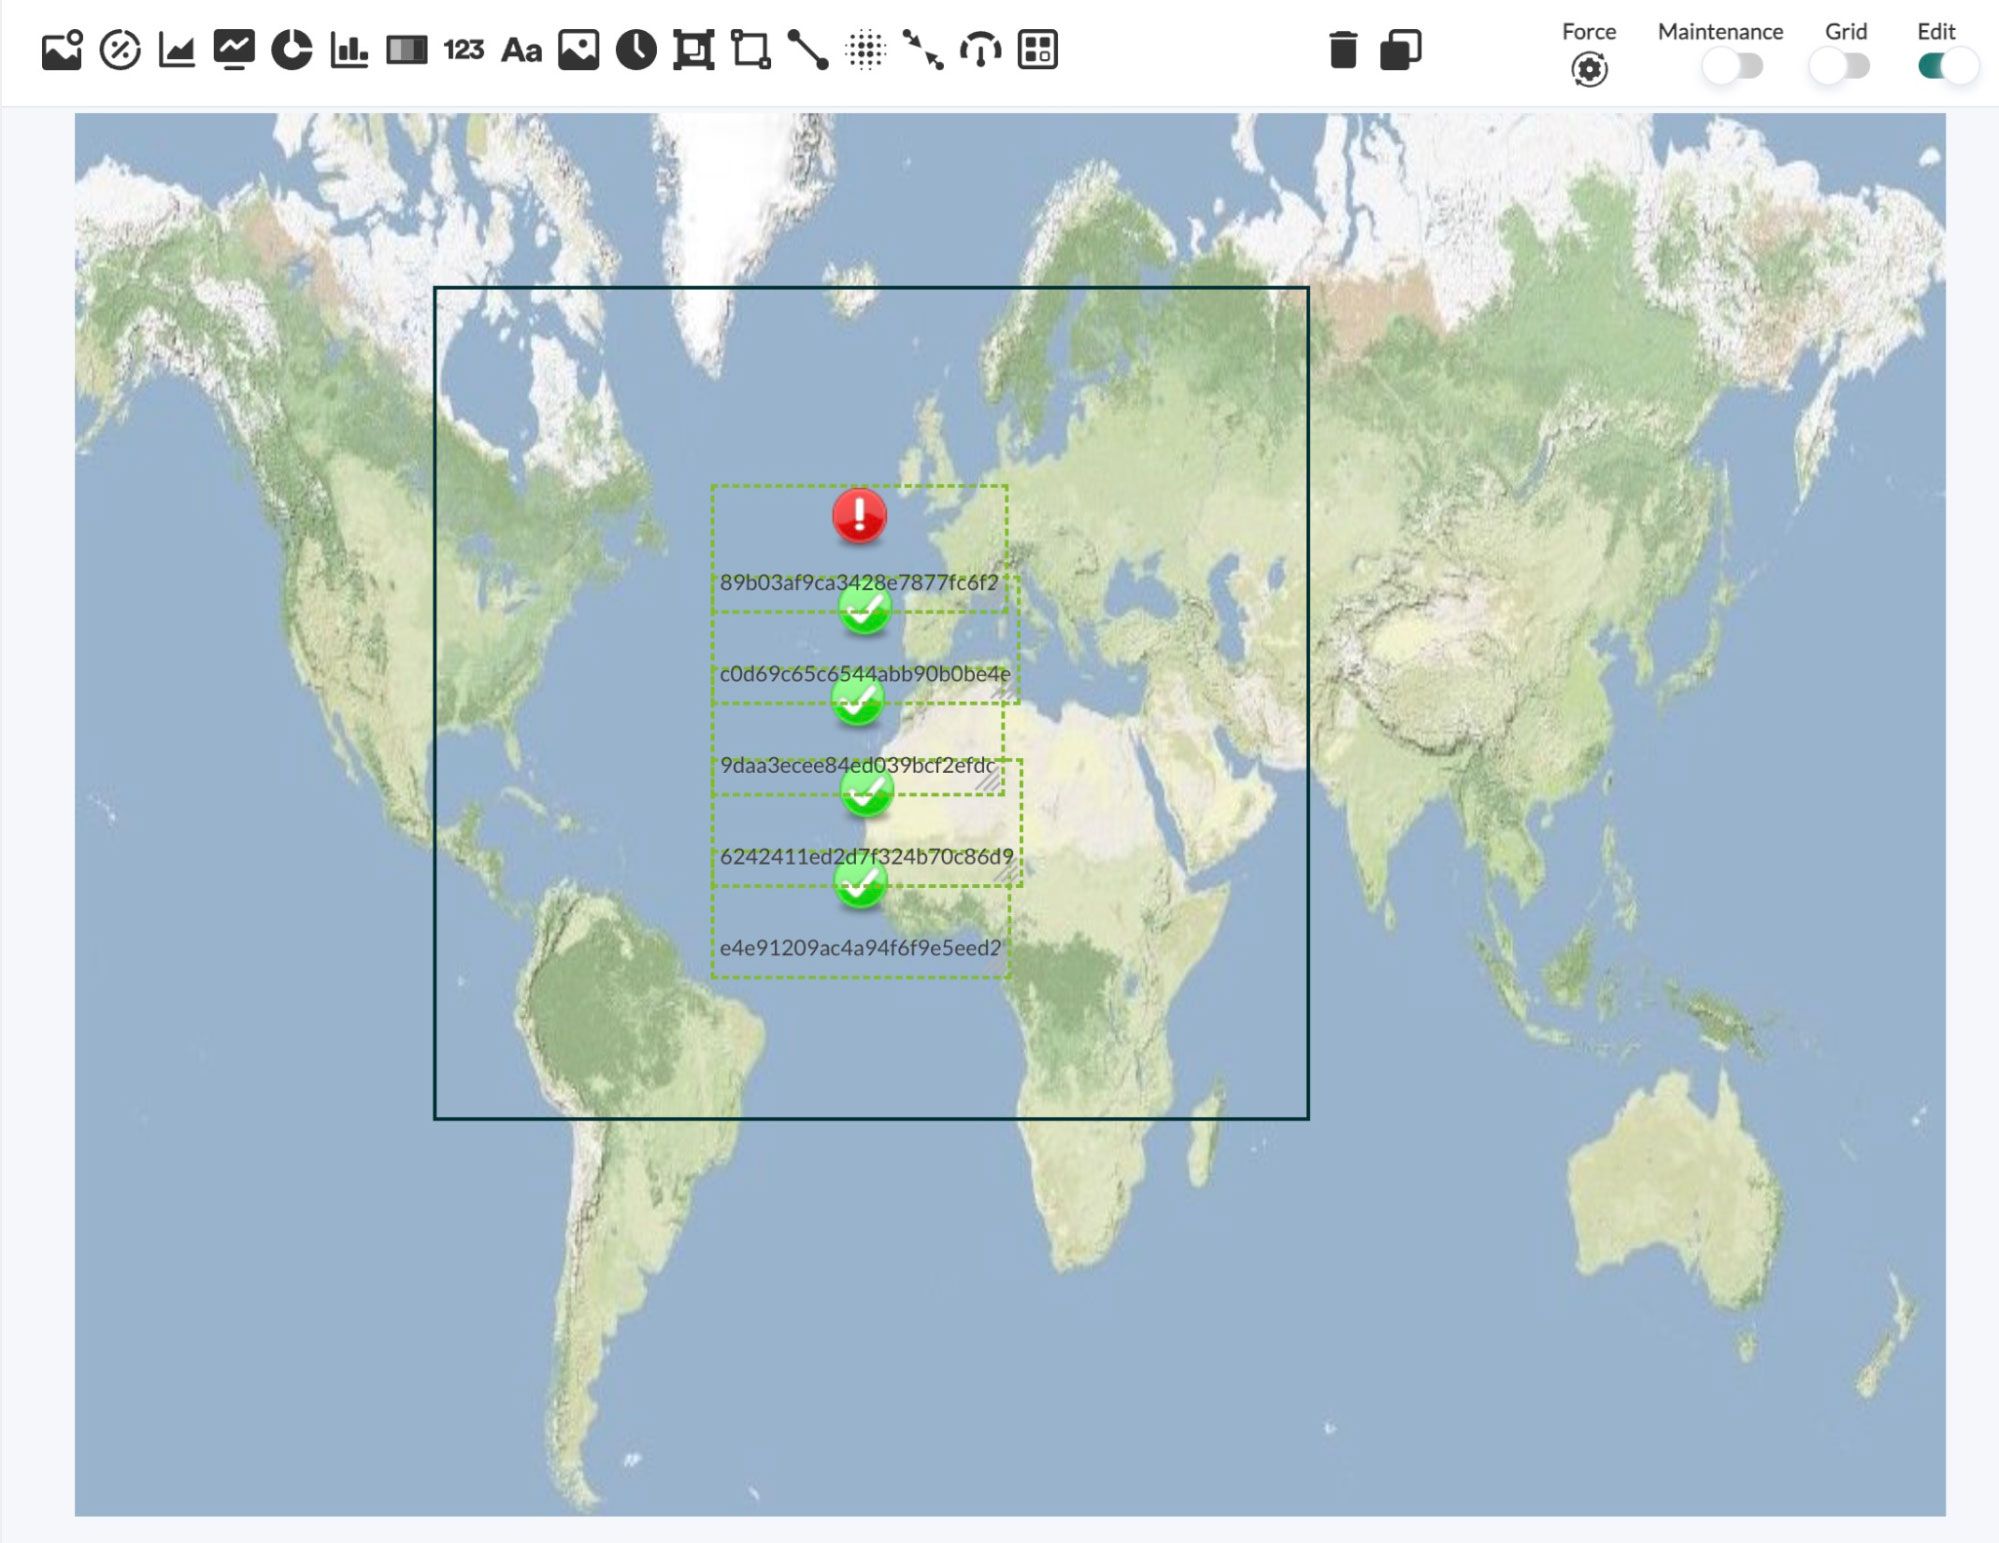
Multiple selection in the visual console
A feature that was suggested for years and that we finally implemented. Now multiple elements can be selected to move them, resize them or delete them.
New features and improvements
| Case# | GitLab# | Description |
|---|---|---|
|
N/A |
8285
|
Added a CSV data export button in section Agent/Modules view. |
|
N/A |
9160
|
Added a multiple item selector to Visual Consoles, to be able to move, copy, delete, or resize items in bulk. |
|
14286 |
9575
|
Created a macro containing the Unit symbol of a module to be used in alerts: _dataunit_ |
|
N/A |
9584 |
Created the Kubernetes feature in Discovery PFMS 2.0. |
|
N/A |
9814 |
Implemented a button that allows you to see projection graphs in the Dashboards for the Agent module graph widget. Likewise, added this button in the agent's modules view when opening the Module graph. |
|
N/A |
9857 |
New feature to create new alert templates, which allow processing extraordinary calculations in addition to ordinary monitoring. These complex alerts allow, by setting them to Condition type and assigning them a specific Time window, calculating the average or sum, or detecting the maximum and the minimum of the modules that authorized users may request. |
|
N/A |
10065
|
Added feature for creating and editing private event filters (only the user who created it and superadmins will be able to see the filter). |
|
N/A |
10194
|
New tactical screen (related to improvements in auto-monitoring). |
|
N/A |
10602
|
Added a new widget devoted to inventory for Dashboards. It is similar to the inventory view in the Operation → Monitoring menu, with the advantage of being able to filter only the interesting points and being able to share the display through a public link. |
|
N/A |
10603 |
Added the option to schedule on which days of the week the task will be performed in the Weekly option, when creating new console tasks (Management → Discovery → New console task). |
|
N/A |
10622 |
Added new actions in bulkon alerts and external alerts to policies. |
|
N/A |
10701 |
Added option to show the service view tree in horizontal (Services → List of services → escoger servicio → botón Show horizontal tree). |
|
N/A |
10846
|
Added option Manage Database HA to the Command Center (Metaconsole) if installed and enabled (node High Availability view). |
|
N/A |
10850 |
Added agent detail view to new favorites system. This feature allows you to assign a name to the filter for later identification and reuse. |
|
N/A |
10922 |
Adapted the plugin for XenServer® monitoring to the new Discovery PFMS 2.0. |
|
N/A |
10946
|
Added agent and module filtering to the Dashboards widget called General group status if you click on one of the links. It works similarly in the Metaconsole, taking into account the differences resulting from node centralization. |
|
N/A |
11051 |
Added the feature to check as read all messages that appear in the notification box. |
|
N/A |
11114
|
Added Version management / Scheduled obsolescence into section Management → Resources → Operating systems which allows to create filters within reports. |
|
N/A |
11206 |
Added the Custom field view from the Command Center (Metaconsole) to nodes. |
|
N/A |
11216 |
Created the feature for copying (cloning) any widget (Dashboards) with the configuration it has, both in nodes and in the Metaconsole. |
|
N/A |
11315
|
Added filtering by search to the following sections: Agent wizard, Module wizard agents, and Service wizard. |
|
N/A |
11324
|
Added the SCA (Security Configuration Assessment) to PFMS Software Agents for MS Windows® and GNU/Linux®. |
|
N/A |
11391 |
Pandora Indexer: changes in the log collector with OpenSearch. |
|
N/A |
11411 |
Added the pageLoadTimeout token to the Webdriver of the plugin for Selenium version 3, in order to establish waiting time periods other than the one set by default (5 minutes or 300 seconds) in WUX PFMS monitoring. |
|
N/A |
11423
|
New tool: Graph analytics, which allows you to graph the last 12 hours of agents and modules. |
|
N/A |
11471
|
Pandora FMS and Pandora ITSM (previously called Integria IMS) present a new configuration interface, two-way communication and two-way presentation of inventory and incident data, all in a fluid and integrated way between both applications. |
|
N/A |
11490
|
New Group status map widget to display the number of groups on a map with their corresponding states in each color. It allows you to add links to the boxes and creates a button to remove the zoom, it is simple and intuitive.. |
|
N/A |
11745 |
Improved the log collector performance regarding the structure and type of data stored now in OpenSearch, among other less relevant changes. |
|
N/A |
11775 |
Changes to Pandora FMS Indexer backend to improve log collector performance. |
|
N/A |
11812
|
Refactorized PFMS Event server and PFMS Correlation server (log collecting alerts). |
|
N/A |
11858
|
Added the SCA (Security Configuration Assessment) to the plugin for MS Windows® and GNU/Linux®. |
|
N/A |
11914
|
New log alert editor (menú Management → Alerts → Log alerts). |
|
N/A |
11965
|
Added Security section to the Operation menu. This in turn contains two subsections called Hardening and Auditing, for security reinforcing and auditing on Mac OS®, GNU/Linux® and MS Windows® devices on which PFMS Software Agent version 774 has been installed. |
|
N/A |
12050
|
Created a new type of widget called Security hardening for PFMS dashboards with the following options: Evolution, Scoring by date, Top-N agents with the worst score, Top-N checks failed by category, Top-N most frequent failed checks, Vulnerabilities by category. |
|
N/A |
12104 |
Added by default the following alert integration plugins for the following platforms: Telegram®, Slack® y Google chat®. |
|
N/A |
12118
|
PFMS Open version now has selected and specific tasks for cron in the console. |
Known changes and limitations
| Case# | GitLab# | Description |
|---|---|---|
|
N/A |
9227 |
Modification for always showing error messages when not connected to Tentacle, with verbosity (level of detail) at level 5/10. |
|
14239 |
9601 |
Now event export in CSV format is done with the timezone of the user making the request (previously it was exported with the timezone of server). |
|
N/A |
10268 |
Reconstructed the data compaction system to increase efficiency in maintenance routines. |
|
N/A |
10637
|
Improved Group report, including export in CSV and PDF formats. |
|
N/A |
10639
|
Unified the date and time controls in terms of form and way of interacting as well as the visual interface itself. |
|
14689 |
10676
|
Added new tokens that change the default way of shortening by half agent and module names in monitor views. These parameters allow to shorten these two element names at the end. |
|
N/A |
11848
|
Added a new module group called Security and added the modules from the Hardening feature to said group. |
|
15385 |
10870 |
Added recursion with the rest of the grouped events when the status is changed in the detail event view. |
|
N/A |
10905 |
Added a new token called NOTIF.API.ACCESS which checks whether the console has due access to the API 1.0 features. This new token generates a new system event and also places a notification to administrators in PFMS Web Console. |
|
N/A |
11059 |
Added a new token (Show total data) to the Top-N events widget to show the total number of events in the center of the graph. |
|
N/A |
11175 |
Added an environment variable (TZ) to change the Timezone when running a Docker with Pandora FMS. Default value: TZ='Europe/Madrid'. |
|
N/A< |
11213 |
Updated the SAP Deset plugin for Discovery PFMS 2.0. |
|
N/A |
11363
|
Added two new modules (Alert_Server_Status y Queued_Alerts) to PFMS server auto-monitoring. |
|
N/A |
11375 |
Changed the message that appears when editing a user and trying to add a profile it had previously assigned: it now explicitly indicates “The profile already exist on the user”. |
|
N/A |
11543 |
Added the following special instructions to use your own logo instead of the default one in Pandora FMS: By changing the theme, the login screen logo will be reset to the default logo for said color scheme, if you have a custom logo, adjust it after changing the visual theme. |
|
N/A |
11547 |
Changed the information provided in Pandora FMS About form to show full information (Database, System info and PHP system) to administrators. |
|
N/A |
11607
|
Added migration feature to Discovery PFMS 2.0 by request if the experimental mode is enabled. |
|
N/A |
11636 |
Migrated all modules monitored with SNMP version 2 to SNMP V2c. |
|
15942 |
11727
|
Now, in local component creation, the option Discard unknown events is enabled by default. |
|
N/A |
11729 |
Added a plugin to the Open PFMS version for Proxmox in Discovery PFMS 2.0. |
|
N/A |
11801 |
Disabled the initial data loading in the alerts and monitors view, both in the nodes and in the Command Center (Metaconsole). The information will be loaded and displayed when the user sets the parameters and clicks the filter button, a help message was added for this purpose. |
|
16007 |
11806 |
Updated the alert edit icon in Agent. |
|
N/A |
11807
|
For the new feature called Security hardening, the following reports have been added:
|
|
N/A |
11819 |
Changed the wizard for Visual Consoles:
|
|
N/A |
11826 |
Fixed the wizard to create services with manual weights so that it also adds to the weight the elements in Normal state. |
|
N/A |
11830
|
Added a full GoTTY revamp (PFMS). |
|
N/A |
11852 |
Implemented the warning in Dashboard, Visual console and Reports when the selected time period exceeds 30 days. These messages are necessary to avoid blocking PFMS server due to overwork. |
|
16106 |
11906
|
Fixed elements that do not have agents assigned in Visual Consoles ( icons, clock, label, etc.) so that they are not deleted. If these elements are used in Visual Consoles and if updated to version 773, it is possible to restore only the table tlayout_data since the last data backup made before the update. |
|
N/A |
11953 |
Replaced Local metaconsole, option in the Group report within the Command Center (Metaconsole) by the option All nodes which includes all centralized nodes and the Metaconsole agents. |
|
16159 |
11961 |
Now the token Show all Events 24h is enabled by default in the events view and improved the SQL command to be faster. |
|
N/A |
12038 |
|
|
N/A |
12064 |
Changed the order in policy view menus. |
|
N/A |
12129
|
Added a new token for PFMS Plugin server named: critical_on_error. This option allows you to specify that if a module, for any reason, fails to obtain monitoring data, it remains in an unknown state or is processed as a critical state (generating a SYSTEM, criticidad MAJOR criticality). |
|
N/A |
12133 |
Updated PFMS plugin to monitor Proxmox for its operation in Discovery PFMS 2.0. |
|
N/A |
12166 |
Updated the calendar interface (date and time). |
|
N/A |
12182 |
Modified PFMS Syslog server (rsyslog) to work with Opensearch the same way it did with Elasticsearch, separating by source and entering there the collected data during log monitoring. |
|
16081 |
12191 |
Optimized the command nfcapd at NetFlow to process and monitor data with more than 10GB collected. |
|
N/A |
12210
|
Disabled log or correlation log alerts with events since they are no longer related to event alerts. You might need to change some event correlation alerts to adapt them to the new 774 model. |
|
N/A |
12103 |
Renewed and improved the Linux Security Plugin (real time monitoring for GNU/Linux through software agents). |
Fixed vulnerabilities
| Case# | GitLab# | Description |
|---|---|---|
|
CVE-2023-41788 Thanks to Oliver Brooks. |
11780 |
Limited the upload only to MIB files or for these to be compressed in a zip and to always belong to MIB type. Any other file type will be rejected. |
|
CVE-2023-41789 Thanks to Oliver Brooks. |
11781 |
Limited the data entry in the software agents registry in order to prevent the insertion of non-monitoring code (XML data). |
|
CVE-2023-41808 Thanks to Oliver Brooks. |
11782
|
Fixed random file reading as root user through the GoTTY feature in ticket 11830. |
|
CVE-2023-41807 Thanks to Oliver Brooks. |
11785
|
Fixed local user privilege upgrade through the GoTTY feature in ticket 11830. |
|
CVE-2023-41790 Thanks to Oliver Brooks. |
11786 |
Limited all cases to prevent files from being downloaded beyond those allowed (MIB repository, collections, etc.). |
|
CVE-2023-41792 Thanks to Oliver Brooks. |
11787 |
Limited the insertion of code not belonging to the OID necessary for monitoring in the SNMP Trap editor. |
|
CVE-2023-41791 Thanks to Oliver Brooks. |
11788 |
Limited custom string translation so that only admin users can have access to them. Prevented the insertion of programming language commands detected by means of their syntax. |
|
CVE-2023-41806 Thanks to Oliver Brooks. |
11790
|
Fixed Service System Denial irruption caused as a local user through the GoTTY feature in ticket 11830. |
|
Thanks to Oliver Brooks. |
11792
|
To properly secure the application engine on which Pandora FMS works, it may be necessary, in some particularly sensitive-to-security environments, to secure access to the application so that session cookies are only transmitted with SSL. To that end, the following configuration tokens should be included in the php.ini file: session.cookie_httponly = 1 session.cookie_secure = 1. |
|
CVE-2023-41810 Thanks to Oliver Brooks. |
11794
|
Fixed the insertion of stored cross site scripting in the PFMS Dashboard. |
|
CVE-2023-41811 Thanks to Oliver Brooks. |
11795 |
Fixed the insertion of stored cross site scripting in the PFMS Site News. |
|
CVE-2023-41812 Thanks to Osama Yousef. |
11878 |
Limited the uploading of files with source code in the File repository manager that could be used to access other PFMS server areas. |
|
16465 |
12286
|
Fixed a non-authorized failure in console and public dashboard sharing. |
Bug fixes
| Case# | GitLab# | Description |
|---|---|---|
|
N/A |
9974 |
Fixed an error in Hex-STRING data collection in SNMP monitoring. The failure was caused in Pandora FSNMP and Braa due to a regular expression that did not filter spaces properly. |
|
15022 |
10348
|
Fixed the way and manner of saving the timestamp in SMTP traps, they are now registered in GMT 0. By installing version 774, old values will be turned into the new absolute time system UTC 0. |
|
14929 |
10509 |
The critical threshold of the CPU Load module that comes by default configured for PFMS Software Agents was set to zero to allow maintaining the critical state if the CPU usage value exceeds 99%. |
|
N/A |
11249 |
Fixed plugin UDP Port Check to correctly report whether a port is open when connecting through a firewall. |
|
15518 |
11389 |
Fixed PFMS plugin for PostgreSQL monitoring and made it support Discovery PFMS 2.0. |
|
15651 |
11407 |
Fixed extra action allocation (sending email) for autoconfigurations of new agents. |
|
N/A |
11414 |
Fixed the following macros with similar functions in the alerts section (_modulegraph_nh_, _modulegraphth_nh_, _modulegraph_XXX_nh_) to show all graphs regardless of whether they use the same macro and number of hours as the modules are different. |
|
15710 |
11434 |
Fixed the division error by zero in monitoring calculation formulae for the Tomcat plugin. |
|
N/A |
11459
|
Fixed the informative message when the Metaconsole is centralizing and merging the nodes. When this process is finished, it redirects to the normal view. |
|
15743 |
11498 |
(Predictive monitoring) Fixed the parameter create_synthetic in PFMS CLI, to take into account the other modules, not only the first one, and add them to the final module. |
|
N/A |
11557 |
Fixed report export in CSV format with SLA for options Hourly, Monthly and so on: these options are now displayed correctly both in name and in dates. |
|
N/A |
11595
|
Fixed the welcome tip for scheduled downtimes both in its wording and the web link it shows for more information about it. |
|
15731 |
11609 |
Fixed WMI monitors so that, in the process of copying WMI modules, passwords are encrypted only once (previously a double encryption process was carried out, which was incorrect). |
|
N/A |
11628 |
Fixed dashboards with several Tactical view, widgets so that the event count is displayed correctly in each and every one of them. |
|
15813 |
11639 |
Fixed the error when monitoring two or more different data sources with NetFlow protocol. Fixed also graph display with separate data and their corresponding filters. |
|
N/A |
11684 |
Fixed access to nodes using the loginhash method in Metaconsole monitoring views. Thanks to JavaScript, the requested node now also opens in a new web browser window. |
|
15865 |
11686 |
Fixed the task scheduled in MS Windows® for restarting the PFMS Software Agents periodically. |
|
16015 |
11818 |
Fixed network map error, by which they were displaced after a new device appeared. |
|
16168 |
11964 |
Fixed fields 4, 5 and 6 in SNMP alerts. Now with this correction, when editing an SNMP alert, these fields are saved in the correct order. |
|
N/A |
11984 |
Fixed the error of non-corresponding icons, in the agente list, regarding the changes applied in monitoring policies. |
|
N/A |
11701 |
Fixed alert details when several alert actions are added. Even with many quantities added in Number of matching alerts alert details now look correct and accurate, with no extra columns. |
|
N/A |
11715 |
Fixed the data maintenance process in pandora_db. With this correction, all variables are initialized to their default values even if they are not established in the configuration file and, in the event that said token is not active, it adds to the log the warning that these specific item maintenance actions will not be carried out. Fixed and normalized variable types and response values. |
|
N/A |
11734 |
Fixed scheduled downtimes, periodic downtimes and Cron downtimes to disable the modules indicated during their execution. |
|
N/A |
11753 |
Fixed NetFlow data erasure and those exceeding the limit imposed in PFMS configuration tokens. Now such data is erased in a timely manner. |
|
N/A |
11773 |
Fixed the log viewer, so that when requesting a custom time period, filtering and then requesting a normalized time period, it will filter again and return results. |
|
N/A |
11805 |
Fixed the message indicating that no custom report has yet been created in PFMS Open version, in the Custom reports section (before, text -1appeared). |
|
15891 |
11808 |
Fixed module Host Alive performance: when an alert is recovered, the status the modules had before being disabled is shown. |
|
N/A |
11809 |
Fixed colors in the Metaconsole, in widget Event Cardboard, and now they look the same as those of the nodes. |
|
N/A |
11810 |
Fixed the wizard in the Services section (creation) from the Metaconsole to add each and every one of the elements (agents and/or modules) selected from different centralized nodes. It was also corrected so as not to repeat the added items. |
|
N/A |
11811 |
Fixed export in XML format of the report Report Templates in the Metaconsole with Historical Data item activated. |
|
N/A |
11817 |
Removed token from user profiles for auto-refresh in Network maps, since the Network map itself has a separate auto-refresh. Added an exception, if the user has this token already enabled, so that it does not show the auto-refresh of the map header and the next time the user is edited, this token disappears. |
|
N/A |
11821
|
Fixed SQL error in event view when adding the comment column. Fixed ascending and descending order for this field. Improvements made in other previous tickets related to the events and their views are saved. |
|
N/A |
11840 |
Fixed the credential boxes necessary for the operation of the Satellite server from the corresponding Web Console. In addition, updated the whole view to the new PFMS visual interface. |
|
N/A |
11863 |
Fixed the Scheduled autoconfiguration task of agents by Metaconsole when changes are applied by filtering by agent custom fields: that way, for example, it is possible to change the main group and also assign secondary groups to the agents that have a particular custom field. |
|
N/A |
11871 |
Fixed SQL query error in Discovery PFMS Task list for a standard user with Operator(Read) profile. |
|
N/A |
11873 |
Fixed scheduled downtime operation to affect only the agent modules when the mode is to show all modules and not the agent. |
|
N/A |
11879 |
Fixed the false positive (ACL error) when Discovery PFMS 2.0 does not find the corresponding .disco file in the Applications section. |
|
N/A |
11889 |
Fixed NetScan and IPAM tasks incorrectly labeled as "legacy" in the new Discovery PFMS 2.0. |
|
16103 |
11902 |
Fixed group icons so that they are shown to node agents that have been added to monitoring policies using the group selection method and its aggregate. |
|
N/A |
11904 |
Fixed the Metaconola's general browser to search in each and every one of the centralized nodes. |
|
16095 |
11908 |
Fixed the list of agents in the Metaconsole when these agents have been migrated between different nodes. |
|
N/A |
11927 |
Fixed downloading patch name in Warp Update On Line for example 773.1, 773.2, 773.3… |
|
16108 |
11929
|
Fixed the location that contains the Datatables function file in JavaScript language. This fixes several sections throughout PFMS Web Console. |
|
16108 y 16130 |
11930
|
Fixed item configuration in Dashboard cells in version 773.1. |
|
16141 |
11947 |
Fixed the evaluation of a numeric variable in the use of the Use agente access graph token, which previously caused a false positive "Access statistics performance" notification. |
|
N/A |
11948 |
Fixed alert mass deletion for large environments (30 thousand alerts and external alerts) by means of monitoring policies. |
|
16143 |
11952 |
Fixed the filtering process in the List of Latest Events widget, to return the correct information. Added Only in process and Only not validated to the drop-down list in field Event status. |
|
N/A |
11953
|
Fixed the Command Center (Metaconsole) to collect data from any centralized node in the Group report and not just from the first one like it did. |
|
16125 |
1956 |
Fixed an error in the regular expression that applies Pandora FSNMP in the data collected by SNMP v3 monitoring, which caused improper retry and a subsequent discard of the other data collected in bulk. |
|
16155 |
11958 |
Fixed alert recovery icon size in last events of the Tactical View. |
|
N/A |
11960 |
Fixed the location that contains the Datatables function file in JavaScript language. This fixes several sections throughout PFMS Web Console. |
|
N/A |
11963 |
Command Center: Fixed the error that prevented nodes to be centralized from being synchronized when they have different databases. |
|
16139 |
11968
|
Fixed reports with Module histogram graph items in PFMS Enterprise, so that graph images are displayed when exported in PDF. |
|
16104 |
11970 |
Fixed agent type items, which when not initialized, the unknown status weight is not applied to the calculation. |
|
N/A |
11973 |
Fixed items Module graph and Event history graph (Visual consoles) to be visible when copied, when the page is reloaded or when activating and deactivating the token to edit the Visual Console that contains them. |
|
N/A |
11974 |
Compiled version 1.0.0 of the pandorawmic executable, which corrects the deletion of temporary files in case of any exception in their use in the monitoring routines (timeout). |
|
N/A |
11985 |
Fixed SNMP v3 new module creation, the credential values (Privacy method, Authentication method y Security level) are saved in the database. In addition, fixed application by monitoring policies. |
|
N/A |
11987 |
Fixed the monitoring policy for Host alive to apply Force primary key instead of custom for the IP address. The error occurred when upgrading to version 773.3. |
|
N/A |
11988 |
Fixed section title when creating or editing a network module of any agent, both in the Open version and in the Enterprise version. |
|
N/A |
11990
|
Fixed service editing, the error consisted of a missing field to be created in the database and therefore this solution uses MR 66. |
|
N/A |
11996
|
Fixed projection graphs (Projection graphs in reports) to show the results in line with the selected time periods. In addition, detected another issue arising from insufficient data collected, which will be fixed separately. |
|
N/A |
12001
|
Fixed the inventory view in non centralized nodes to show all modules when filtering by date and/or agent(s). |
|
N/A< |
12002 |
Fixed the option to Edit modules in bulk in Bulk operationsto enable or disable them. The error occurred because an SQL operation was performed without having the valid data for it. |
|
16204 |
12003 |
Fixed issue by which, when a monitoring policy had been applied to its agents and a new agent or agent group was added, the rest of the agents were checked as if they had not received and it applied the monitoring policy. Now it is only checked when applying the new agent or agent group added to the monitoring policy. |
|
N/A |
12006
|
In the inventory widget, the inventory filter Order by agent was corrected so that, if the module is specified, the requested information may be displayed. |
|
16207 |
12007
|
Fixed the attribute in the VMWare® plugin for Discovery as a way to obtain the UUID of the datastores. |
|
N/A |
12012 |
Fixed agent search in Pandora FMS Open version, the error consisted of the lack of access to a function declared in a specialized library. |
|
N/A |
12027 |
Fixed the display of agents in quiet mode and that appear in the Tree view from menu Operation → Monitoring. |
|
N/A |
12028
|
Fixed in the group tactical view the filtering of the agents that have this group selected as a secondary group. |
|
N/A |
12029 |
Fixed text size for the Heatmap view, so that the font size adapts to the box size. |
|
N/A |
12032 |
Reconfigured the cluster view, as well as its editing and display. |
|
N/A |
12033 |
Fixed the Server View within the Tactical View to show the required network modules. |
|
N/A |
12035
|
Fixed alert editing in Metaconsole nodes, both from Agent details and Alert details. For the Metaconsole (Command Center) the feature remains as it was, editing is allowed for users who have LW or LM rights. |
|
N/A |
12044 |
Fixed the acoustic console in the Open version of Pandora FMS, to load the libraries necessary for its operation. |
|
N/A |
12060 |
Fixed the visual curve underlining in the event view and in PFMS sound console. |
|
N/A |
12066
|
Comment creation was corrected by means of the 1.0 PFMS API (command op2=create_event), now they appear correctly in PFMS Web Console. |
|
16277 |
12071 |
Fixed the secondary group column in the Inventory view (menu Operation → Monitoring → Inventory). |
|
N/A |
12072
|
Fixed the error in the Command Center when creating an SQL report and choosing only "Local metaconsole" as its data source. |
|
N/A |
12073 |
Added a new warning message in PFMS Sound Console to indicate that if the corresponding SO window is minimized, said feature is silenced. |
|
N/A |
12077 |
Fixed the Log Viewer view (menu Operation → Monitoring) so that filtering options Last 24hr, Last 7 days, Last 15 days and Last 30 days may work and show the corresponding information. |
|
N/A |
12081 |
Added option None in custom reports (Operation → Reporting → Custom reports → View → Filters) (and set by default) to the date filter in order to prioritize the period of the report items. This correction is also included in the PDF report export. |
|
16249 |
12087 |
Fixed report display inappropriate closing at Operation → Reporting → Custom reports due to lack of memory for PHP. If the total memory available is not enough to carry out the requested job, it will show the message “You have no memory for this operation, increase the memory limit”. |
|
N/A |
12090 |
Fixed the unsolicited insertion of a time interval of one second in time interval editing (Visual style section of the general settings). |
|
N/A |
12097 |
Fixed the operation View summary that appears in each Discovery Tasks item. |
|
N/A |
12100 |
Fixed the export of combined graphs in Graph Analysis (you need to load a filter first before you can export). |
|
N/A |
12109 |
Fixed the error in searches in the external alerts of the monitoring policies. Now with this bug fix, when changing the page in the retrieved list, said results are properly displayed. |
|
N/A |
12113 |
Fixed the error in the Discovery credential drop-down list, which stayed open after selecting an option. |
|
N/A |
12115 |
Fixed the use of the corresponding regular expression in section Alert correlation, in the alert trigger conditions and for field Event user comment. |
|
N/A |
12142 |
Fixed the error message in PHP language version 8.2 when there is no connection between PFMS Web Console and its corresponding database. |
|
N/A |
12171 |
Admin and internal_API users are no longer required for graphs to be shown in the email alerts. |
|
N/A |
12172 |
Fixed column Event name in the event view (Operation → Events → View events) to show the full name in each item. |
|
N/A |
12174 |
Fixed several errors in VMware Discovery PFMS 2.0:
|
|
N/A |
12179 |
Fixed PFMS configuration file to store a new token: discovery_threads. |
|
N/A |
12185 |
Fixed custom field filtering in autoconfiguration tasks, which were excluded from the applied filter if they contained any blank spaces. |
|
N/A |
12194 |
Fixed script pandora_ha_resync_slave.sh so that it takes into account port SSH different from 22. |
|
N/A |
12196 |
Fixed the Mobile view (module graphs were not displayed and visual consoles did not adjust to the display frame). |
|
N/A |
12205 |
Fixed credential configuration in Pandora RC to appear again. These fields will always be displayed as long as the connection is configured at user credential level. |
|
N/A |
12207 |
Fixed the error that appeared in task executions in Discovery PFMS: it now indicates correctly and at all times whether the processes are being executed or they are already finished. |
|
N/A |
12259 |
Fixed waiting time error in the visual indicator (spinner) for the list of monitoring policies in the Mozilla Firefox® browser (also verified its proper operation for Google Chrome®). |
|
16095 |
12281 |
Fixed the feature for moving agents in the Command Center (Metaconsole) so that it also filters by secondary agent groups. |
|
N/A |
12288
|
Fixed several visual errors in the NetFlow protocol monitoring feature. Also fixed filters for IP addresses. |
|
N/A |
12297 |
Fixed error in Pandora FMS mobile with dialogues containing big titles, which were cut and made it impossible to close them. |
|
N/A |
12308 |
Fixed 500 error when accessing the NCM section of an agent in PFMS Web Console. |
|
N/A |
12326 |
Fixed the Log viewer feature to log and show the oldest data and not just the most recent ones. Also fixed the migration tool (OpenSearch supported). |
|
N/A |
12328 |
Fixed Syslogserver, Logserver and Eventserver being disabled by default given the case that the corresponding tokens fail or are commented in the configuration file (pandora_server.conf). |
Known bugs
| Case# | GitLab# | Description |
|---|---|---|
|
15928 |
11714 |
Detected an error in the user custom screen when trying to add an external link as homescreen. |
|
15965 |
11750 |
Detected conflicts in data insert through API 1.0 PFMS. |
|
16304 |
11831 |
Detected an error in the menu side options, which do not match. |
|
16094 |
11898 |
Detected an error in pagination, in registered Custom fields displayed. |
|
N/A |
12015
|
Detected an issue due to insufficient data collected for Projection graphs in the reports section. |


