Bandwidth and Network Consumption – Basic Concepts
What is bandwidth then? In terms of data transmission, bandwidth refers to the amount of data that can be transmitted over a network or communication channel in a specific time period. Bandwidth also measures the capacity of the network or channel connection and is usually expressed in bits per second (bps), kilobits per second (Kbps), megabits per second (Mbps), or gigabits per second (Gbps). Given the large amount of data that is transmitted on the networks, we increasingly hear about Mbps or Gbps. So, the higher the bandwidth, the more data can be transmitted in a given time, resulting in faster and more efficient data transmission.
Importance of bandwidth in communications
Currently, users of organizations demand speed and reliability to be able to carry out a task or work in a given time. Hence, bandwidth is a crucial factor in communications to access data and business applications. Of course, in increasingly collaborative environments, it is essential to have greater bandwidth capacity to ensure faster transfer of information and to ensure efficient performance in online applications, online conferences or meetings, video or voice image transmission, file sharing and other activities. With these examples we see that adequate bandwidth is critical to maintaining communications quality, avoiding delays or interruptions, and supporting the growing number of connected devices in modern digital environments, contributing to greater productivity and efficiency in the organization, as well as a more seamless and satisfying user experience.
Relationship between bandwidth and speed
The relationship between the two is that bandwidth is one of the main limitations for data transmission speed. As we have said, the higher the bandwidth of a channel, the higher the transmission speed can be. This means that a channel with a wider bandwidth can carry more data in a given period of time than one with a smaller bandwidth. For example, all things being equal, an Internet connection with a bandwidth of 100 Mbps can transmit data faster than one with a bandwidth of 20 Mbps. It is worth mentioning that bandwidth is not the only factor that affects the speed of data transmission; since other factors play an important role, such as latency, interference, the type of technology used (such as optical fiber, coaxial cable, etc.).
To calculate bandwidth, network administrators can manage network performance, detect potential risks, and troubleshoot through a protocol called SNMP.
Measuring Bandwidth with SNMP
SNMP (Simple Network Management Protocol) is a standard network protocol used to manage and monitor network devices, such as routers, switches, servers, and other network equipment. SNMP allows network administrators to monitor device performance, collect information, and manage configuration remotely. It uses a client-server model, where managed devices (agents) report their state to a management system through SNMP messages. Information is organized in a hierarchy of managed objects, and each item is identified by an OID (Object Identifier). There are three SNMP versions:
- SNMPv1: Simple network management protocol, a full Internet standard defined in RFC 1157.
- SNMPv2c: Defined in RFC 1901 to 1908. It is based on community strings.
- SNMPv3: Interoperable protocol, originally defined in RFC 2273 to 2275. It provides safe access by authenticating and encrypting packets over the network.
SNMP operates on user datagram protocols (UDP, User Datagram Protocol) which is a transport layer protocol and is part of the Internet protocol suite. UDP enables process-to-process communication and helps establish low-latency, loss-tolerant connections across the network.
Configuring SNMP on Network Devices
To understand how SNMP is configured on network devices, first understand that there are three elements to this protocol:
- The administrator is a system that is responsible for communicating with the connected SNMP agent devices. This is where the network monitoring solution is located and from where agents are checked, agent responses are received, and agent variables are established.
- The Management Information Base (MIB) is a formatted text file that lies within the administrator designed to collect information and organize it into a hierarchical format. The SNMP administrator uses information from the MIB to translate and interpret messages before sending them to the end user. The resources within a MIB are called managed objects or management variables. The MIB contains all the performance data accessed when loading a network monitoring tool.
- Agents are programs that run on devices (computers, phones, printers, etc.) that are connected to the network. The agent takes information from the MIB and delivers it to the administrator once the query is made. This information includes state details about the connected device.
The SNMP administrator lies in a Network Management System (NMS), while the agent and MIB are located on client devices. Once this is understood, to configure SNMP on a network device, first of all, the relationship between the administrator and the agent must be defined, and then continue with the following:
Step 1. Configure a community and access level string (read-only or read-write) using the snmp-server community string ro | rw command.
Step 2. Record the location of the device using the snmp-server location text command.
Step 3. Record the system contact using the snmp-server contact text command.
Step 4. Restrict SNMP access to NMS hosts (SNMP administrators) that authorize an Access Control List (ACL). The ACL is named with the command snmp-server community string access-list-number-or-name. This command can be used to specify the community string and to restrict SNMP access through ACLs.
Step 5. Specify the recipient of SNMP trap operations (unsolicited messages) with the snmp-server host id-host [version {1 | 2c | 3 [auth | noauth | priv]}] community-string command.
Step 6. Enable traps in an SNMP agent with the snmp-server enable traps notification-types command. If no trap notification type is specified in this command, then all trap types are sent. Regarding traps, these are unsolicited messages that alert administrators of a situation or event on the network (incorrect user authentication, reboots, active or inactive link status). These messages reduce network and agent resources by removing some SNMP polling requests.
Using SNMP, you may graph bandwidth usage by interface, by address, etc. You may also graph errors on network devices and get alerts when an interface goes down or gets activated.
SNMP Monitoring Tools – Introduction
You may measure bandwidth using SNMP (Simple Network Management Protocol) (Simple Network Management Protocol) to monitor network devices, such as routers and switches. However, if the device does not have SNMP you will not be able to measure it easily and you will have to add a device in the middle (such as a router) through which all the traffic goes by in order to measure it (using SNMP).
Configuring the Monitoring Tool to Measure Bandwidth
1. Make sure the network device you want to monitor has SNMP enabled and configured correctly. You’ll need to set up SNMP communities (access strings or passwords) and define access policies to allow your monitoring system to collect data through SNMP.
2. Choose an SNMP monitoring tool: Select a monitoring tool that supports SNMP such as Pandora FMS.
3. Set up your monitoring tool:
a. Add your device: In the monitoring tool, add the network device you want to monitor using its IP address and SNMP credentials.
b. Select the data to be monitored: Choose the specific data you want to measure, such as bandwidth, CPU load, memory utilization, and more. To measure bandwidth, select the relevant network interfaces.
4. Set the monitoring frequency: Define how often you want the monitoring tool to collect SNMP data. This could be every minute, every 5 minutes, etc.
Bandwidth Data Analysis and Display
Once you’ve set up SNMP monitoring, you’ll be able to see and analyze the collected data. Usually, bandwidth data is represented in graphs that show network interface utilization over time.
Configuring Alerts (Optional)
If you wish to be notified when certain bandwidth utilization thresholds are reached, set up alerts in your monitoring tool.
Remember that SNMP provides data about network interface usage, but it won’t tell you the actual connection speed. You may use this data to understand how bandwidth is being used for a particular interface on a network device and detect usage patterns.
Keep in mind that the specific features and exact steps may vary depending on the SNMP monitoring tool you choose, so it’s a good idea to refer to the documentation for the specific tool you’re using for detailed instructions.
With Pandora FMS, once you start monitoring bandwidth consumption, you may set up alerts, generate graphs and create reports for clients such as the following. All of these features fall under the category of “network monitoring”.

Measuring Network Consumption with Agents on Windows/Linux Computers
- Using Agents to Measure Network Consumption
You may measure the network consumption of a Windows or Linux computer using a monitoring tool that has an agent that can be installed on the machine, in order to retrieve the information without using SNMP or Netflow.
- Selecting a Monitoring Tool
Choose a monitoring tool that supports agents and is compatible with the operating system you want to monitor. Some known examples include Nagios, Pandora FMS, or Solarwinds, among others.
- Installing Monitoring Agent
On the computer you want to monitor, install the corresponding monitoring agent.
- Configuring and Viewing Network Consumption Data
Pandora FMS agents, for both Linux and Windows, have the “Network consumption” module configured as standard so that you will see it within a few minutes of installing the agent. This is a quick and easy way to monitor the network consumption of your computers.
Example of network usage monitoring seen on a default installed agent:
- View network consumption data
- Perform analysis and optimization
It uses the collected data to analyze network usage on the computer and make informed decisions to optimize network performance and security.
- Configuring and Viewing Network Consumption Data
Configure Alerts (Optional): If you wish to be notified when certain bandwidth utilization thresholds are reached, set up alerts in your monitoring tool. You may see more about how to use agents to monitor in Pandora FMS documentation.
Measuring the Use of the Whole Network
What is Netflow? To find out how your network is used, that is, which computers are connected, which ports they use, how much traffic they consume per port and with whom they are connected, you need to use a system called NetFlow. To do this, activate Netflow on the router or your main network switch.
- Enabling NetFlow on your Network Devices:
- Verify that your routers, switches, or other network devices support NetFlow and enable this feature.
- Set up NetFlow data flow on devices to collect traffic information and send it to a NetFlow collector (Pandora FMS has a Netflow collector). Define the server and port of the NetFlow collector to which the data will be sent.
- NetFlow Collector Configuration:
- Select or configure a NetFlow collector that will receive and store traffic data. You may use open source tools like ntop, Softflowd, or commercial network management software like Pandora FMS.
- Configure the collector to listen on the port you have specified on network devices.
- NetFlow Data Collection and Storage:
- Once the network devices and NetFlow collector are configured, they will begin collecting and storing traffic data on the network.
- NetFlow data may include information about source and destination IP addresses, ports, protocols, amount of data transferred, communication start and end time, among others.
- Detailed Display and Analysis of Network Usage:
- Use the NetFlow Collector UI to see and analyze the collected data. You will be able to access reports and graphs showing network usage, the amount of data transferred, and other details about network traffic.
- You may segment data by device, application, traffic flow, and other parameters to get a detailed view of network usage.
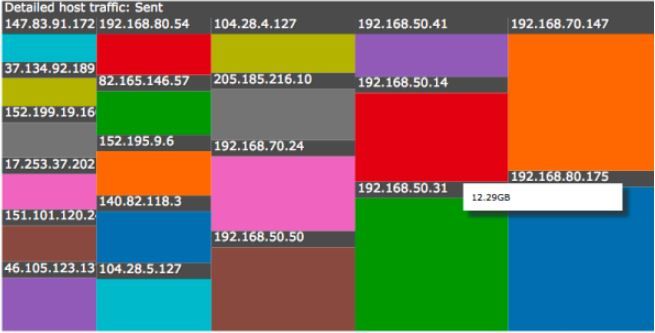
Here are some of the views you may have using Pandora FMS Netflow Traffic Analyzer.


- Configuring Alerts (Optional):
Some NetFlow collectors allow you to set up alerts to notify you when certain network usage thresholds are reached or when unusual events occur.
- NetFlow Data-driven Network Analysis and Optimization
Perform adjustments and optimization. It uses information obtained through NetFlow to make informed decisions about network usage, resource allocation, and troubleshooting. You may identify bottlenecks, bandwidth-consuming applications, and unusual traffic patterns.
NetFlow is a valuable tool for measuring and analyzing network usage, enabling network administrators to make data-driven decisions to optimize network performance and security. Keep in mind that the specific steps may vary depending on the NetFlow collector you choose, so it’s a good idea to refer to the documentation for the specific tool you’re using for detailed instructions.
Conclusions
Bandwidth is present in our daily and business lives, in the constant coming and going of data in images, voice, files, processes and transactions. Being able to measure bandwidth using SNMP (where there are administrators, agents and MIBs) has become an essential task to guarantee the quality of communications, access data and business applications quickly and reliably, in addition to supporting the growing number of connected devices in modern digital environments. All of this means increased productivity and efficiency in the organization, along with a better experience for users. There are different SNMP versions, although it is recommended to adopt SNMPv3, which is interoperable and allows packet authentication and encryption over the network. For that, it is also crucial to have monitoring tools compatible with SNMP and appropriate to the needs of the organization such as Pandora FMS to visualize and analyze data (patterns, deviations, possible risks) on bandwidth and configure alerts, graphs and reports on network use. Also, Pandora FMS agents (for both Linux and Windows) have the “Network consumption”, module configured as standard, so in minutes you may install the agent to start monitoring network consumption of your computers.
Parlez à l'équipe de vente, demandez un devis ou posez vos questions sur nos licences


