EFFICIENT DB2 MONITORING WITH PANDORA FMS
Monitor DB2 databases remotely and hassle-free
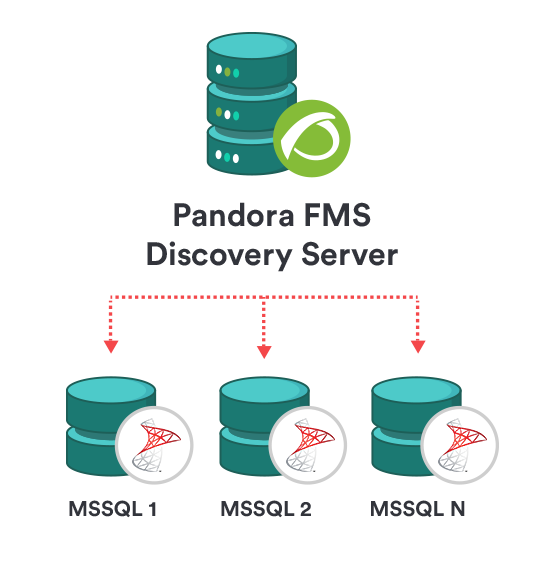
Pandora FMS makes it easy to monitor DB2 databases from the Discovery Server, allowing you to obtain a large number of metrics through an intuitive web interface.
Get key metrics from any DB2 database
Remotely and from a single point, without the need to install components locally on servers.

DB2 Discovery plugin optimizes database management with a centralized and efficient platform, and makes scheduled queries to your DB2 to retrieve essential information about environment performance and status, such as:
- Number of connections.
- Cache status and size.
- Log usage percentage.
Why monitor DB2?
IBM Db2 is one of the most strong and reliable databases on the market. However, without proper monitoring, you could face performance and availability issues that impact your critical operations.

Real-time critical problem prevention
Detect crashes, waiting times or failures in your databases before they impact your business, avoiding unexpected interruptions.

Managed and flexible scalability
Plan for the growth of your DB2 infrastructure by ensuring that the resources available can adapt to the future demands of your business.

Resource and performance optimization
Monitor key metrics such as:
- Cache usage.
- Log usage percentage.
- Active connections.
Ensure efficient operation and make decisions based on specific data.

Multi-environment and multi-client management
Manage multiple databases and customer environments from a single platform:
- Set up custom access levels.
- Segment visibility between different groups or customers.
Centralize all control into an efficient, unified solution.
Why is Pandora FMS the best choice for monitoring DB2?
Pandora FMS combines flexibility, customization and real-time analytics to offer you a comprehensive solution in DB2 database monitoring. With this tool, you may optimize your resources, prevent problems and centralize the management of your whole IT infrastructure.
Remote connection without local agents
Monitor any DB2 database without installing additional components on servers. Pandora FMS simplifies deployment by enabling efficient remote connection, offering fast and convenient deployment from the Discovery Server.
Efficient management of multiple instance
Monitor multiple databases and DB2 instances simultaneously from a single platform. It configures different metrics and ranges according to the criticality of each instance and provides segmented visibility for groups or customers, ensuring more flexible and efficient management.
Centralized and adaptable control
Pandora FMS not only monitors DB2, but also allows you to integrate data from other platforms such as Oracle, Microsoft SQL Server, Google Cloud and Amazon Web Services. Manage your entire IT infrastructure from a single interface, consolidating the visibility of all your environments into a unified platform.
Predefined metrics and custom queries
Access a full range of key metrics for DB2, such as log usage percentage, database size, and timeout on critical operations. If you need to customize monitoring, Pandora FMS allows you to define specific queries to adapt them to the needs of your environment, even reusing existing SQL scripts.
Real-time analysis and alerts
Get detailed reports and combined graphs to analyze the performance of your databases at any time. Configurable alerts keep you informed in real time through email, SMS, Telegram or chat tools, ensuring an immediate reaction to any incident.
Easy and efficient setup
Configuring a monitoring task for DB2 from Pandora FMS is very simple.
1. Select the DB2 application
Go to menu Discovery > Applications and select MySQL to start the wizard.
2. Define the basic parameters
In this step, set up essential data for your task:
- Assign a descriptive name to the task.
- Select a group for the generated agents.
- Set the monitoring interval according to the needs of your environment (for example, every 5 or 15 minutes).
In the next step, discovery will request the user credentials for the database connection, also allowing to define a list of servers to connect to and execute the monitoring, that way being able to manage the monitoring of more than one DB2 server from a single task using format IP:PORT/SID or IP/SID.
3. Enter DB2 credentials and servers
Add the necessary credentials to establish the connection with your DB2 databases or define a list of servers using format IP:PORT/SID or IP/SID to monitor multiple instances from a single task. Advanced options:
- Configure execution threads to optimize monitoring in multi-instance environments.
- Customize the name of the agent that will store the metrics and adjust additional parameters, such as the use of a proxy for data transmission.
4. Customize metrics and queries
Select the predefined metrics you wish to monitor or add custom queries to tailor monitoring to your specific needs. If you already have your own SQL scripts, you may integrate them directly into your Pandora FMS Discovery Server settings. The task stays running:

5. Double check scheduled tasks
Once you are done with the wizard, you will get a list of all scheduled Discovery tasks. From that list you may:
- Check the current status of each task.
- Access detailed summaries of the execution.
- Perform manual updates in real time, if necessary.

Detailed results
Get a complete overview of your DB2 databases
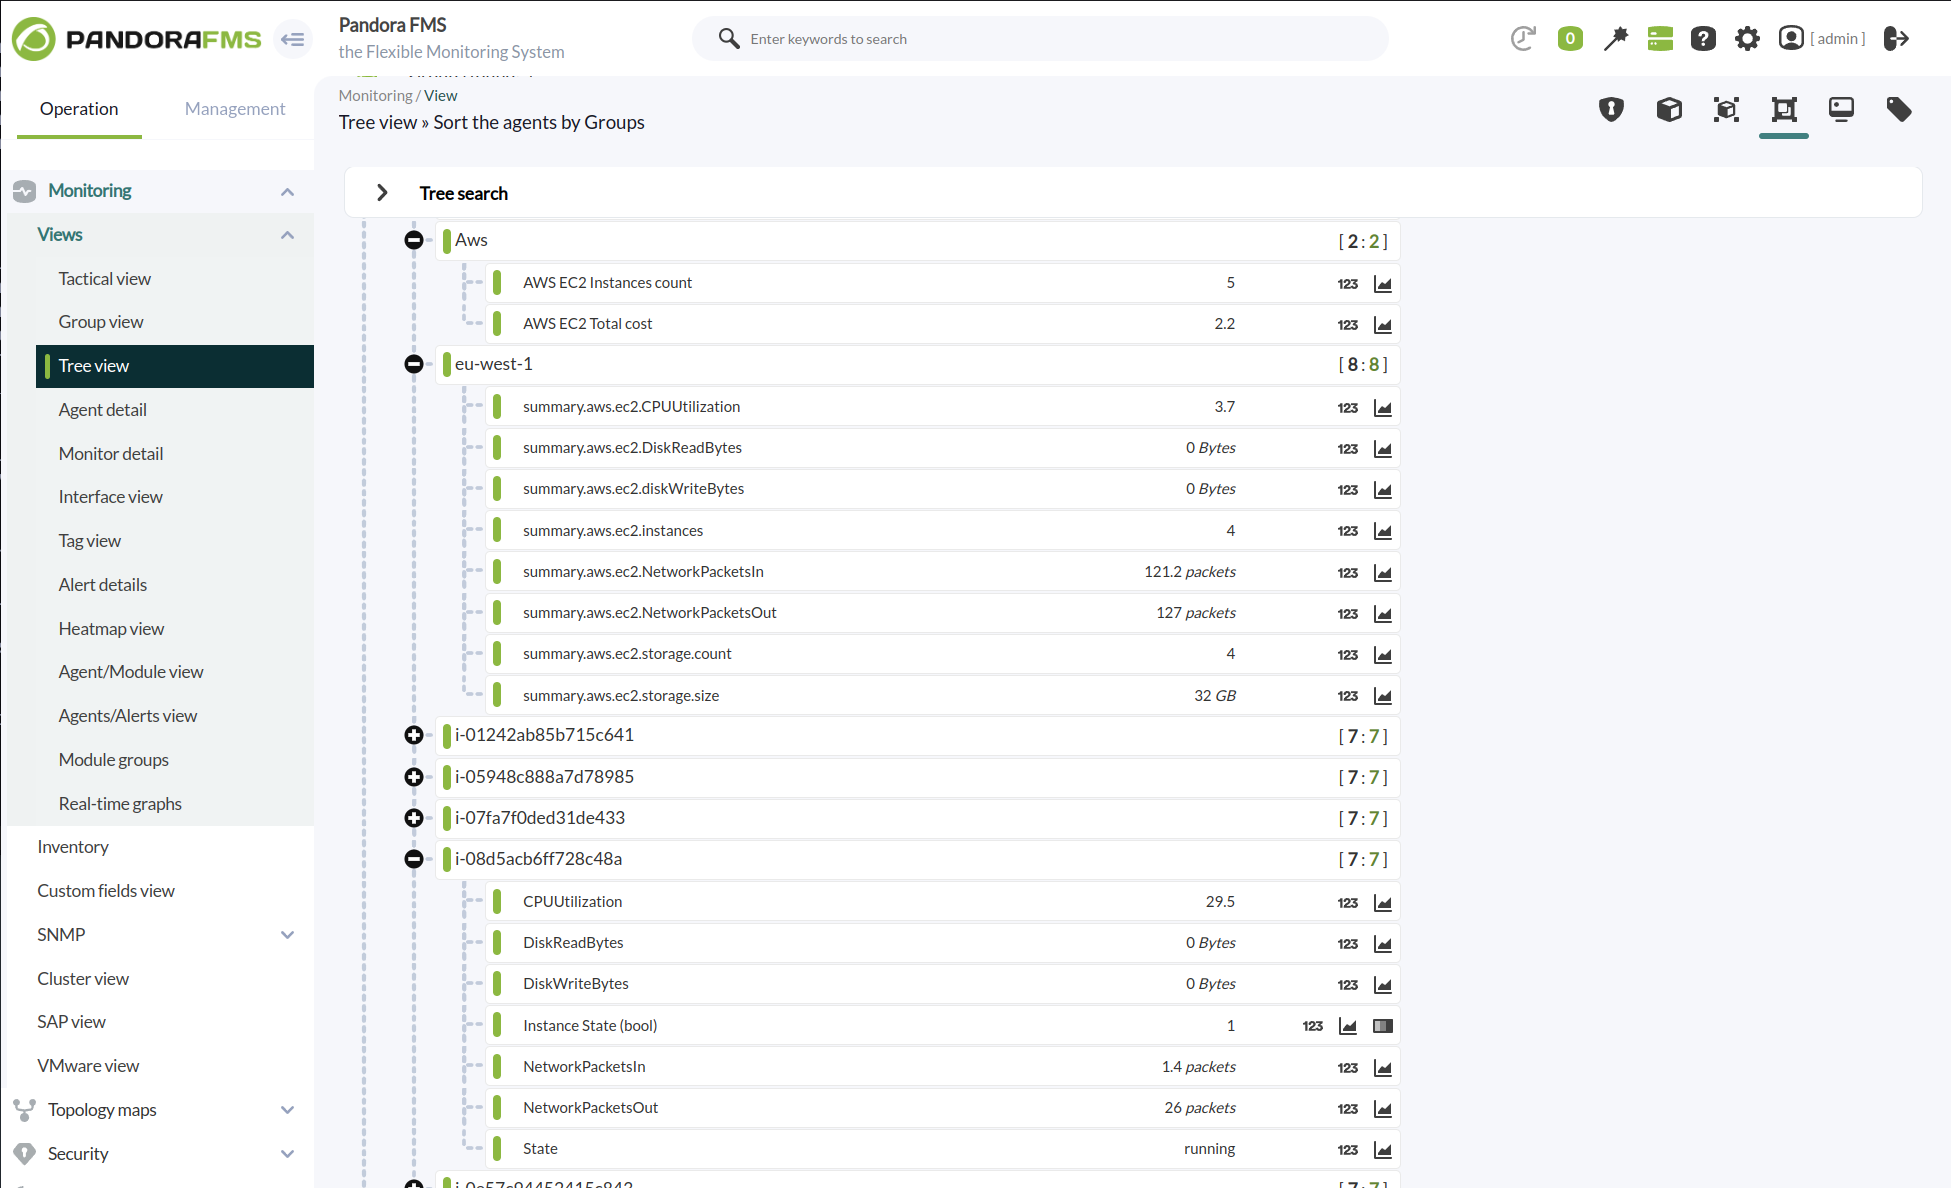
Pandora FMS generates specific agents and modules according to the configuration made, providing exhaustive monitoring of each database and its performance.
Generated metrics
The task will create an agent for each target database. That agent will contain the following modules:
If database_summary is enabled
| AGENT_WAIT_TIME_PERCENT |
It represents the percentage of time DB2 agents are waiting for some activity, such as crashes or external requests. |
|
APP_RQSTS_COMPLETED_TOTAL |
It indicates the total number of completed application requests in the DB2 database. |
|
AVG_RQST_CPU_TIME |
It represents the average CPU time used by each application request in the database. |
|
CF_WAIT_TIME_PERCENT |
It displays the percentage of time DB2 agents are waiting for shares on multi-node systems. |
|
IO_WAIT_TIME_PERCENT |
It indicates the percentage of time DB2 agents are waiting for input/output (I/O) operations. |
|
LOCK_WAIT_TIME_PERCENT |
It represents the percentage of time DB2 agents are waiting for some activity due to resource blockages. |
|
NETWORK_WAIT_TIME_PERCENT |
It shows the percentage of time DB2 agents are waiting for network operations. |
|
RECLAIM_WAIT_TIME_PERCENT |
It displays the percentage of time DB2 agents are waiting for resource release. |
|
ROUTINE_TIME_RQST_PERCENT |
It represents the percentage of time used by stored routines (stored procedures, functions, etc.) in each application request. |
|
RQST_WAIT_TIME_PERCENT |
It displays the percentage of time that application requests are waiting to be executed by DB2 agents. |
|
TOTAL_BP_HIT_RATIO_PERCENT |
It indicates the hit percentage in the buffer pool, which represents the efficiency in accessing data in memory. |
|
TOTAL_BP_HIT_RATIO_PERCENT |
It represents the percentage of time used by transaction completion operations in each application request. |
If transactional_log is enabled
|
Log utilization percent |
Log usage percentage in Kilobytes. |
If db_size is enabled
|
Database size |
Database size in Megabytes. |
If analyze_connections is enabled
|
Active connections |
Number of active connections. |
If cache_stats is enabled
|
cache hit ratio |
Percentage cache hit ratio for each BP_NAME. By combining the hit ratio cache with “bp_name” (name of the buffer cache), you may evaluate the buffer cache performance for each of the existing caches in the DB2 database. You may monitor and compare the cache hit ratio for each buffer cache separately, allowing you to identify which buffer caches are working most efficiently and which may require adjustments. |
If database_summary is enabled
| AGENT_WAIT_TIME_PERCENT It represents the percentage of time DB2 agents are waiting for some activity, such as crashes or external requests. |
| APP_RQSTS_COMPLETED_TOTAL It indicates the total number of completed application requests in the DB2 database. |
| AVG_RQST_CPU_TIME It represents the average CPU time used by each application request in the database. |
| CF_WAIT_TIME_PERCENT It displays the percentage of time DB2 agents are waiting for shares on multi-node systems. |
| IO_WAIT_TIME_PERCENT It indicates the percentage of time DB2 agents are waiting for input/output (I/O) operations. |
| LOCK_WAIT_TIME_PERCENT It represents the percentage of time DB2 agents are waiting for some activity due to resource blockages. |
| NETWORK_WAIT_TIME_PERCENT It shows the percentage of time DB2 agents are waiting for network operations. |
| RECLAIM_WAIT_TIME_PERCENT It displays the percentage of time DB2 agents are waiting for resource release. |
| ROUTINE_TIME_RQST_PERCENT It represents the percentage of time used by stored routines (stored procedures, functions, etc.) in each application request. |
| RQST_WAIT_TIME_PERCENT It displays the percentage of time that application requests are waiting to be executed by DB2 agents. |
| TOTAL_BP_HIT_RATIO_PERCENT It indicates the hit percentage in the buffer pool, which represents the efficiency in accessing data in memory. |
| TOTAL_BP_HIT_RATIO_PERCENT It represents the percentage of time used by transaction completion operations in each application request. |
If transactional_log is enabled
| Log utilization percent Log usage percentage in Kilobytes. |
If db_size is enabled
| Database size Database size in Megabytes. |
If analyze_connections is enabled
| Active connections Number of active connections. |
If cache_stats is enabled
| cache hit ratio Percentage cache hit ratio for each BP_NAME. By combining the hit ratio cache with “bp_name” (name of the buffer cache), you may evaluate the buffer cache performance for each of the existing caches in the DB2 database. You may monitor and compare the cache hit ratio for each buffer cache separately, allowing you to identify which buffer caches are working most efficiently and which may require adjustments. |
The plugin will also create a module for each custom query defined in the configuration file.

pandora fms resources
Want to learn more? Explore more resources
Monitor DB2 databases remotely and hassle-free
Pandora FMS makes it easy to monitor DB2 databases from the Discovery Server, allowing you to obtain a large number of metrics through an intuitive web interface.


