Efficient Proxmox Supervision with Pandora FMS
Learn how Pandora FMS simplifies monitoring of virtualized environments in Proxmox
Find out the real-time status of your nodes, VMs and LCs, manage scheduled backups and receive instant alerts for efficient management.
Outstanding features
Remotely obtain metrics from multiple Proxmox environments
From a single point of access, without the need to install any additional software on the hypervisor.

Real-time Status
Find out the current status of your Nodes, VMs and LCs at all times to make quick and effective decisions.

Backup Management
Ensure the security of your data by tracking your scheduled backups.

Instant Alerts
Get instant alerts across multiple channels to stay on top of any issues.

Device Selection
Easily select the devices you want to monitor for custom settings.

Simplified Setup
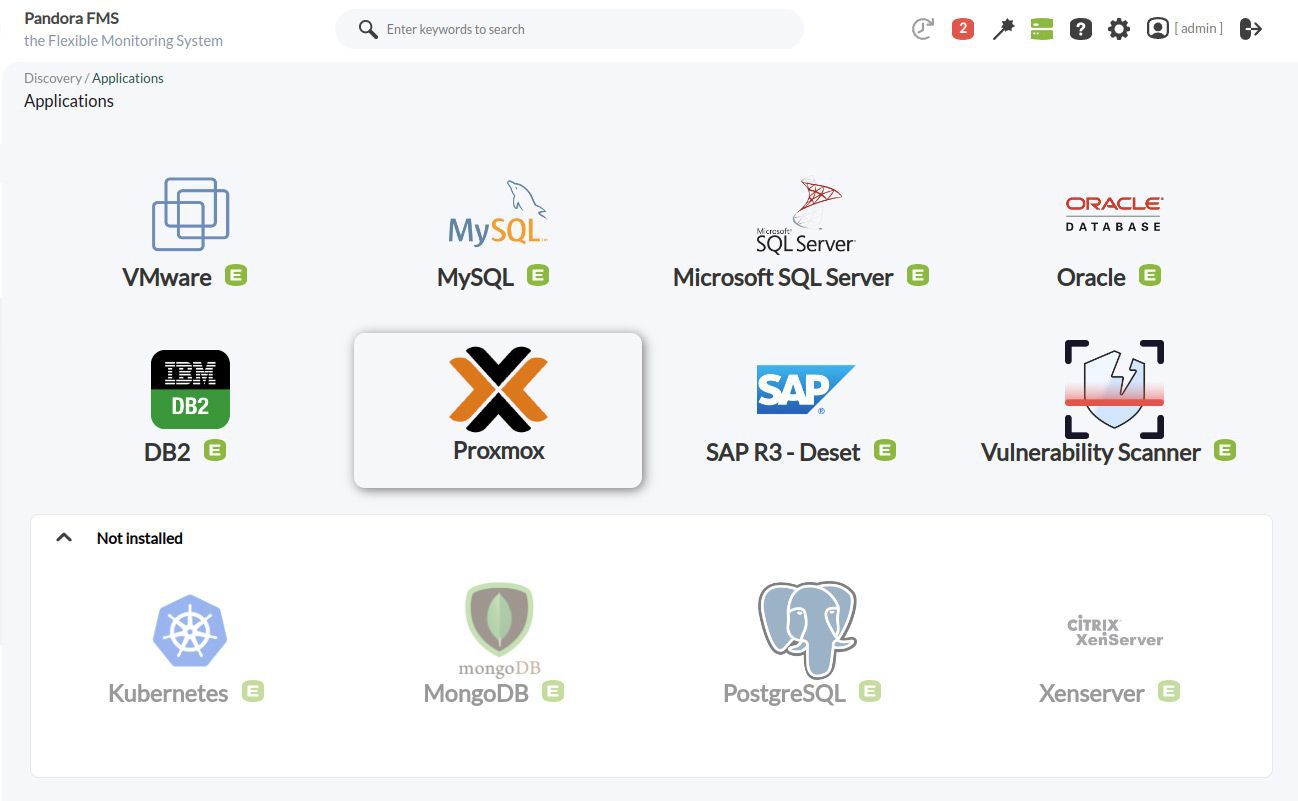
Start the setup wizard by selecting the Proxmox application and adding the necessary parameters.

Custom Reports
Generate detailed reports and performance graphs for in-depth analysis of your infrastructure.

Detailed Summary
See a list of all scheduled tasks, their status, and a complete execution summary.

Comprehensive Monitoring
Keep full control over your Proxmox environment from a single remote point, without the need for additional software.

Multi-Proxmox Management
Manage multiple Proxmox environments from different clients from a single interface.

Segmented Display
It provides segmented display to different groups or customers for more efficient and custom management.
Explore the complete, detailed and optimized results offered by Pandora FMS
You will be able to execute the monitoring task in your Proxmox environment with a simple configuration, you will get a variety of agents adapted to your needs, each one with specific metrics for an exhaustive analysis.

Detailed Metrics for Efficient Monitoring
Pandora FMS collects essential metrics for each component of your Proxmox environment, providing a comprehensive and detailed view of its performance. From node status to virtual machine and container monitoring, each metric gives you valuable insights for informed decision making:
Proxmox node
Get a dedicated agent for every Proxmox node in your infrastructure, providing essential metrics like status, uptime, CPU usage, memory usage, and more.
| Status | It indicates whether the node is operational or not. |
| State | It provides the current state of the node. |
| Uptime | It displays the elapsed time since the last node restart. |
| Root Disc Size (maxdisk) | It offers the total capacity of the root disk in bytes. |
| Maximum Number of CPU Cores (maxcpu) | It indicates the maximum number of CPU cores available. |
| Maximum Available Memory (maxmem) | It displays the maximum amount of memory available in bytes. |
| Root Disk Usage (disk) | It indicates the space used on the root disk in bytes. |
| CPU Usage (cpu %) | It provides the percentage of CPU usage. |
| Memory Usage (mem) | It displays memory usage in bytes. |
| SSL Fingerprint (ssl_fingerprint) | It provides the node’s SSL footprint. |
Virtual machines and containers
Each VM and LC includes an individual agent that collects key metrics, including status, resource allocation (CPU and memory), disk usage, network traffic, and uptime.
| Status | It indicates whether the VM/LC is running or not. |
| State | It provides the current status of the VM/LC. |
| CPU Assigned Cores (cpus) | It displays the number of CPU cores allocated. |
| CPU Usage (cpu %) | It provides the percentage of CPU usage. |
| Memory Usage (mem) | It displays memory usage in bytes. |
| Root Disk Usage (disk) | It indicates the space used on the root disk in bytes. |
| Diskread | It shows the oil supply rate in Kbps. |
| Diskwrite | It displays the disk writing rate in Kbps. |
| Maximum Disk Size (maxdisk) | It offers the maximum disk size in bytes. |
| Maximum Memory (maxmem) | It displays the maximum amount of memory available in bytes. |
| Incoming Network Traffic (netin) | It indicates incoming network traffic in Kbps. |
| Outgoing Network Traffic (netout) | It indicates outgoing network traffic in Kbps. |
| Uptime | It displays the uptime in seconds. |
Backups
Pandora FMS also deploys a special agent to manage your scheduled backups. This agent provides detailed information on the backups performed, including status, scheduling, storage and time remaining for the next backup.
| Backups Overview | It provides details about each scheduled backup, including the next run time. |
| Time Left for Next Backup | It indicates how much time is left for the next backup in seconds. |
Easy and fast configuration with Pandora FMS
Comprehensive and efficient monitoring of your virtualized environments in Proxmox easier than ever.
1. Select the Proxmox App
Launch the wizard by selecting the Proxmox app in Pandora FMS.
2. Add the Required Parameters
Fill in required fields such as task name, description, monitoring interval, IP address, and user credentials.
3. Device Selection
Choose the types of devices you want to discover for your monitoring from an intuitive interface.
4. Completing the Wizard
Upon completion of the setup, you may see a list of all scheduled Discovery tasks, their status, and a detailed execution summary.
Extract data from nodes, backups, virtual machines and more with Proxmox and Pandora FMS
Pandora FMS not only facilitates the integration and monitoring of Proxmox, but also offers advanced tools to manage your entire infrastructure. Ensure optimal performance and efficient management of your devices with this powerful combination.

Partners tecnológicos de Pandora FMS, la clave para impulsar la innovación en el mundo de la monitorización.


