Sections
- Importance of Visibility in IT Services and Infrastructure
- IT System Monitoring Process
- The Four Golden Signals
- Best Practices for Avoiding Alert Fatigue
- Activities in IT Systems Monitoring
- The Panorama of IT Monitoring with Pandora FMS
- Pandora FMS Highlight Features
- Pandora FMS Advanced Features and Tools
- Future Trends in IT System Monitoring
Importance of Visibility in IT Services and Infrastructure
Digital Transformation and the IT System Health
In general, all organizations, whether small or not, are experiencing a Digital Transformation : from the digitization of most processes and remote or hybrid work in large companies that collaborate with customers and suppliers in different geographies, to homes that are becoming mini work centers; all integrating more and more devices and more technologies (collaboration, automation, analytics, artificial intelligence, etc.), requiring better connectivity and optimal performance of their systems, so System Monitoring is essential to ensure the health of IT systems.
What is IT System Monitoring?
IT system monitoring makes it possible to monitor and manage the information technology (IT) infrastructure on an ongoing basis by providing visibility into the state of the infrastructure and its services, not only to make resources available, but also to optimize them and foresee events that have an impact on business. In modern System Monitoring platforms there are tools that generate alerts about anomalies or possible risks, allowing you to act on time and in the right way.
Also IT System Monitoring provides real-time information on the use and capacity of resources that helps to plan growth and make decisions on unnecessary consumption to address aspects related to costs and environmental sustainability.
IT System Monitoring Process
Official Google and ITIL®4 Monitoring Definitions
According to the Site Reliability Engineering (SRE) of Google, monitoring consists of collecting, processing, aggregating and displaying quantitative data in real time on a system. This data may include counts and query types, counts and error types, processing times, and server duration.
In ITIL® 4, information about the status and performance of the service is included in the practice of “Event Monitoring and Management”. Monitoring is defined as a capability that enables organizations to:
- Respond appropriately to past events that affected the service.
- Take proactive measures to prevent future adverse events.
This monitoring is part of the service value system (SVS) and is related to the four essential dimensions for service management:
- Organization and people.
- Partners and suppliers.
- Value flows and processes.
- Information and technology.
Types of Monitoring and their Importance in IT Service Management
- Performance Indicators (KPIs): these indicators assess overall system performance such as availability, response time and use of resources.
- Disk storage status: monitoring the capacity and performance of hard drives and other storage devices.
- Network interfaces: verification that network interfaces are active and potential problems are detected.
- Automated alerts and actions: alert configuration to detect deviations in parameters and execution of automatic actions according to predefined criteria.
Of course, it is essential to collect data in real time and consistently to make well-informed decisions. As it can be seen, IT system monitoring is critical to ensure that systems work properly, and that they are also secure and offer a good quality-investment ratio.
Key Aspects Monitored in IT Systems
System monitoring must offer the necessary elements to understand the status of resources and the reasons or causes of said status. Information must be obtained on anomalies, existing or potential problems and the appropriate alerts to undertake maintenance and prevention activities that guarantee that the services work and can be used according to the agreed performance levels. For that, you need metrics that need to be collected and analyzed, such as:
- Low-level infrastructure metrics (known as “black-box monitoring”): They are measured at the host, server, network, and facility levels, and include CPU, disk space, power, and interface state, among others.
- Application metrics: They are measured at software level and include response time, error rate, and resource usage, among others.
- Service Level Metrics: They are based on infrastructure, connectivity, applications and service actions, where applicable.
Generally, IT system monitoring metrics come from native monitoring functions that are designed and built within IT components; however, there are IT monitoring systems that are capable of retrieving more advanced service level metrics.
The Four Golden Signals
Explanation of Fundamental Signals for Monitoring IT Systems: Latency, Traffic, Errors and Saturation
For Google, in IT system monitoring, there are four golden signals on which IT system monitoring should focus:
- Latency. It refers to the time it takes to fulfill a request; that is, the round-trip time, usually in milliseconds. The higher the latency, the worse the level of service experienced, considering that users are unwilling to take on the slowness and lack of responsiveness.
- Traffic. It refers to the demand that the system must support; that is, the requests managed or the number of sessions within a time period, occupying the configured capacity. The more traffic there is, the higher the pressure on IT systems and the likelihood of impacting customer experience.
- Errors. By these we mean the rate of requests that fail, either explicitly, implicitly or by policy. Errors signal configuration problems or item failures within the service model.
- Saturation. It indicates a measure of the fraction of the system, which highlights the resources that are most limited; that is, how “full” the service is. Of course, if the established usage levels are exceeded, performance problems are likely to take place.
Best Practices for Avoiding Alert Fatigue
Over-alert Risks and Strategies for Establishing Effective Rules
In our blog post Why too many alerts do not help with monitoring we talked about the so-called Alert Fatigue as a phenomenon in which the excess of alerts desensitizes the people in charge of responding to them (they are lost or ignored) or generates late responses with a high cost to the company. Keep in mind that those in charge of IT security operations tend to suffer from this type of fatigue as systems are overloaded with data and may not classify alerts accurately.
What is recommended is to establish simple, predictable and reliable rules that detect real problems most of the time, together with the periodic review of the threshold settings (informative, warning or exception), as well as the effective configuration of automated correlation engines by Artificial Intelligence (AI).
Integrating Technologies such as Artificial Intelligence for Smarter Alerting
A clear example of AI integration for intelligent alerts is AIOps (Artifitial Intelligence for IT Operations), which is leveraging AI to automate critical operational tasks (performance monitoring, workload scheduling, and data backups). AIOps leverages machine learning (ML), natural language processing (NLP), and other advanced AI technologies to improve IT operational efficiency.
Also with AI it is possible to collect, add and analyze data from multiple sources and in large volume.
Activities in IT Systems Monitoring
The main activities in the practice of IT System Monitoring are the following:
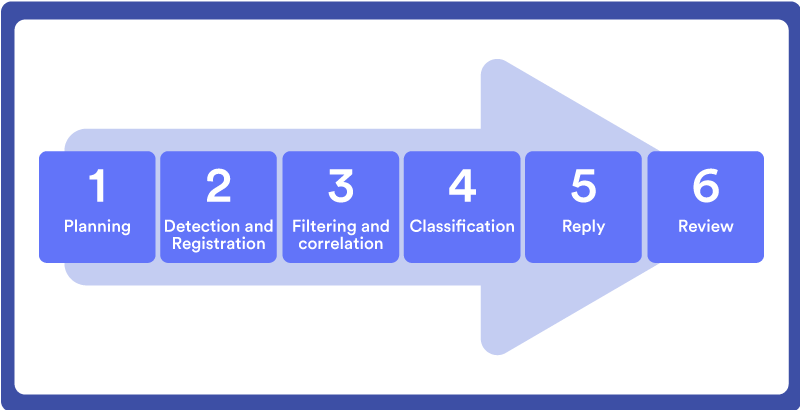
Stage 1. Planning
When selecting an IT system for monitoring, you will need to perform several planning activities such as: defining priorities; choose the features to monitor; set metrics and thresholds for event sorting; define a “health model” of service (end-to-end) and events; define event correlations and rule sets; and map events with the action plans and responsible teams.
Key outcomes of planning include:
- A monitoring plan for the computer system.
- A model of service health.
- Defined event types.
- Criteria for event detection.
- Priority and response to events.
- A responsibility matrix for event management.
Stage 2. Detection and registration
This is the first stage of event management. Here, alerts from IT systems are detected when set thresholds and criteria are exceeded. Alerts are captured by an IT monitoring system where they can be displayed, added, and analyzed.
Stage 3. Filtering and Correlation
According to the established rules, the monitoring system filters and correlates the received alert. Filtering can be based on criteria such as:
- Source
- Time generated
- Level
Correlation checks for patterns among other alerts to determine anomalous sources and potential impacts.
Stage 4. Classification
At this stage, the event is grouped according to set criteria (such as type and priority) to inform the correct response. For example, alerts related to intrusions or ransomware would be classified as security events and this informs the SOC (Security Operations Center) team to act accordingly.
Stage 5. Response
Based on your predefined action plan and matrix of responsibilities, the relevant team is contacted through email, text message, online collaboration systems, or other agreed-upon channels.
For some IT environments, event response can be automated, meaning that actions are taken regardless of human intervention, such as restarting instances or failover traffic.
Stage 6. Revision
Depending on event handling and the resulting effect on the quality of IT systems, a periodic review of the monitoring planning should be conducted to ensure that the metrics and thresholds set still meet your requirements. This review should also:
- Update response procedures and liability matrices.
- Verify the performance of metrics associated with the event management process, such as data quality and fault detections that lead to service interruptions.
The Panorama of IT Monitoring with Pandora FMS
Pandora FMS’s approach to IT System Monitoring
Pandora FMS offers a comprehensive solution for the monitoring and observability of IT systems, which includes auditing, monitoring, configuration management, remote control, ITSM, inventory management and system security capabilities.
Real-time information is displayed on what’s happening with your organization’s technology, from which alerts are generated, multi-year trends are analyzed, and data and reports can be shared with customers or suppliers in an intuitive and customized way. This translates into saving your technicians’ time in management tasks by having reliable and real-time information, in addition to reducing licensing costs by managing everything with the same platform (software, hardware and services), simplifying supervision and management or improving perception. of the quality of the service by customers or suppliers.
Incorporating Artificial Intelligence and Machine Learning for Prediction and Optimization
To improve the efficiency and accuracy of monitoring systems, organizations are already exploring smarter and more advanced solutions, especially when looking to find the right balance: on the one hand, you do not want alerts to overwhelm administrators with irrelevant information; On the other hand, we do not want to set too lax thresholds that hide critical problems. That is why a smart monitoring approach is recommended, in which alerts are only triggered when values are outside normal limits in a defined time period, taking advantage of Artificial Intelligence and Machine Learning to be able to automate repetitive tasks and at the same time perform deeper analyses on the data obtained, based on the workloads of each system. Keep in mind that Machine Learning can handle large volumes of data to detect patterns and anomalies that may be subtle to you, which would easily go unnoticed if traditional alert rules are used.
Also important, AI and ML are tools that can help reduce alert noise, by:
- Automation: Not only to send alert notifications, but also to automate actions. For example, you may set the alert that monitors a particular service to try to restart automatically.
- Alert escalation Following the same example, alerts can be escalated, so that, if after the execution of the agent, the module is still in a critical state, you may configure the alert to create a support ticket in Pandora ITSM.
With MADE, Monitoring Anomaly Detection Engine, Pandora FMS has its own integrated on-premise AI engine, which can be added to any monitor to provide information on any anomaly. MADE generates “something happens” events and also generates projection charts using different AI algorithms, depending on the data structure. Smart (dynamic) thresholds can be defined using trend data to adjust automatically.
In terms of risk prevention, AI also allows Pandora FMS to be equipped with sufficient capacity to prevent problems and even plan the necessary capacity in the future.
Of course, it is essential to verify that these smart functions work correctly and provide the expected alerts. It is recommended to get an expert for the correct configuration and thorough testing, in order to verify that alerts are generated in an accurate and timely manner.
Pandora FMS Highlight Features
Security Monitoring
With Pandora FMS you may implement password policy, centralized authentication (AD, LDAP, SAML) and two-factor authentication, confidential data encryption, ACL (access control lists), user profiles and credential storage. There is also an integrated auditing system, integrated backups, as well as the assurance of complete high availability. Tools are provided for monitoring hardening and vulnerabilities, as well as real-time security.
1. Hardening and Vulnerability Monitoring
Through Pandora FMS, you may implement hardening monitoring in a very visual and intuitive way from the same screen:
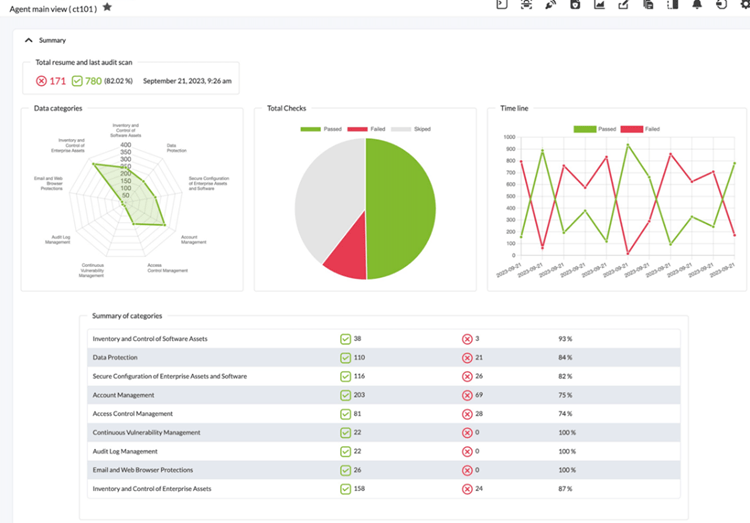

As well as monitor vulnerabilities, both locally and remotely, in addition to monitoring server security in real time:

2. Real-Time Security
Pandora FMS platform offers file integrity, an updated and activated antivirus and control over backups. You may integrate the password policy enabled, along with lock screens and firewall enabled. Microsoft Update is also activated and updated and an audit log for login attempts.
Network Monitoring
It supports SNMP v1, v3 monitoring, with templates and wizards for SNMP-enabled devices and automated discovery; netflow, S-Flow, J-Flow; syslog collection; SNMP trap collection, forwarding, filtering, and alerting; Detailed SLA and availability history. In addition, it enables long-term data retention, custom SLA and availability reports, real-time charts, network mapping, and SQL data storage for external reporting.
1. Auto-discovery and Network Mapping
Using the auto-provisioning system, you may discover new elements in your network automatically and, from there, start monitoring them. You may add your own discovery or high availability scheme in bulk on your machines through CSV.

2. Netflow Routing Monitoring and Analysis
Visually, you may monitor network routing and flow, quite intuitively:

And there’s a real-time network analyzer (Netflow/SFlow/JFlow), with Top-N data reports, custom performance reports, and network usage reports:

Operating System Monitoring
1. Compatibility and Centralized Management
Pandora FMS is compatible with native Windows (all from NT4), Linux (Redhat, Ubuntu, Rocky), BSD, Solaris, AIX, IBMI-i and z/OS, to obtain data on CPU, disk, licenses, internal process components, application parameters and status.
2.Custom Plugins and Remote Configuration
Custom plugins are easy to create and implement. It has 100% centralized GUI management, which also does not require access to the command line/shell for its operation. Remote configuration works with firewalls, proxy, and other topology issues.
Performance and Availability Monitoring
Through monitoring and observability, data related to performance, availability and system and application behavior can be collected, analyzed and displayed.
1. Virtual Infrastructure Monitoring
Pandora FMS has been conceived for monitoring of the virtual infrastructure of your choice, such as VMware, Openstack, Nutanix, Open Nebula, Citrix, HP UX and Microsoft Hyper-V.
2. Remote Agent Deployment and Command Capture
Linux or Windows agents can be deployed remotely from the central console with the Discovery Deployment Center.

For Linux and Windows, native command output can be captured in text for analysis.

User Experience Monitoring
User Experience Monitoring (UX) replicates customer experience in web applications, providing valuable insight into what works and what could be improved.
1. Registered Web Transactions and Distributed User Experience
It consists of playing events on the network anywhere and taking screenshots when the probe fails and generating alerts.

For distributed user experience, Pandora FMS allows viewing response times, resource usage, delayed response, step-by-step response and resolution process, as well as screenshot.

2. Low Cost Distributed Monitoring
To avoid underperformance of critical flows for users, the overall and each step performance is monitored separately. You get SLA reports, real-time alerts, and even a screenshot of the page that fails.
For low-cost distributed monitoring, Pandora FMS IoT sensors, based on Raspberry, are used to distribute a network of sensors anywhere on the network at an extremely low cost.
Pandora FMS Advanced Features and Tools
Remote Control and Management
Process and Service Control
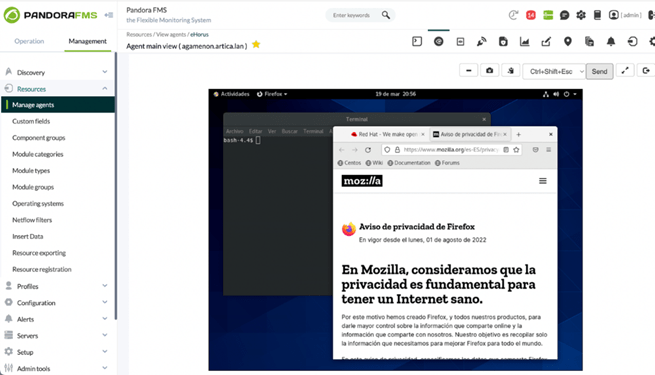
Pandora FMS manages and gives total control from any Windows server or workstation, as well as Linux hosts (Redhat, Debian, etc.), highlighting the following features:
- Linux and Windows remote desktop user interface.

- Remote shell (Administrator/root).
- Remote process and services control.
- On-premise or cloud servers.
- Bidirectional file transfer.
- 100% browser/HTML/JavaScript support.
In addition to not needing an application to implement remote control. - Integrated and custom reports. Pandora FMS offers more than 40 reporting elements: Top-N, graphs, histograms, SLA (monthly, weekly, daily, hourly), capacity planning, downtime and availability, average/maximum/minimum, listing, events, alerts, configuration, specific Netflow, IP usage (IPAM), among others.
Also, Pandora FMS uses templates for PDF report customization, including scheduling and email to be sent to specific users. Its template system is designed to allow users to make their own simplified reports. Additionally, it also preserves data in the long term (more than 3 years).


Automation and Alerts
1. Shell Automation and Alert Generation
Pandora FMS checks the operating system version before propagating command execution between agents. Furthermore:
- It performs subsequent checks to evaluate execution result.
- It performs the operation on hundreds of systems at once.
- It uses file collection to propagate external commands or tools.
- It automates the execution of any command.

Pandora FMS allows to develop alert inventory (including inventories for reports for a customer or ISO 27001 certification reports) and IP/Subnet/Supernet (IPAM) usage reports.

2. Integration with ITSM and Root Cause Analysis
Pandora FMS provides ticket integration into the event workflow (when closing/opening), including:
- Integration into the operations control panel.
- Custom ticket types with custom fields.
- Custom workflows and actions.
- SLA definition for each ticket group.
- Project management; time and cost management.
- CRM (contracts, contacts, companies, agreements). Internal WIKI and file shares for teams.
Additionally, Pandora FMS allows root cause analysis and uses manual or automatic weighting to assess service loss. Regarding service levels, it evaluates the percentage of SLAs in real time, with long-term history data, in addition to determining the path in which the error is from bottom to top.


Future Trends in IT System Monitoring
IT systems are increasingly complex, so it is essential to have IT systems monitoring tools with a holistic view of each resource and as a whole, but that can also maintain the accelerated pace with which technology evolves. Keep in mind that many organizations face the challenge of using and interpreting multiple monitoring tools for applications, infrastructures (inside and outside the organization) and environments (private, public and hybrid cloud). It is no surprise that, in a study by 451 Research, 39% of IT departments reported using 11 to 30 monitoring tools, resulting in more expense, inefficiency, and even failure to respond in a timely manner.
Looking ahead, IT areas must always keep this in mind and look for monitoring options that are capable of having a total and integrated view over multiple systems and environments, along with the ability to take advantage of new technologies such as advanced analytics, Artificial Intelligence and Machine Learning.
Impact of Machine Learning on IT Monitoring
Artificial intelligence has become virtually ubiquitous in organizational processes and flows. In IT system monitoring, it is also observed that the impact of AI and Machine Learning will have more importance. Modern tools that have integrated AI into monitoring can handle the whole process lifecycle from detection to response, especially for analyzing large volumes of data about events or routine activities such as event correlation and log analysis in distributed systems.
With proper AI implementation, Monitoring tools may classify alert “noise” and “false positives/negatives” faster and more effectively than any human team. This allows IT/Security staff to focus their attention on building better orchestration and automation tools to respond and solve alerts.
Emergence of Unified Observability as a Key Trend
There is also another trend of great impact in IT system monitoring: unified observability. Observability allows to understand the internal state or condition of a complex system based on the knowledge of its external outputs. The more observable a system is, the faster and more accurate it can be navigated from a performance issue to its root cause, without additional testing or coding. Platforms that are capable of providing a single view (of the entire infrastructure, applications, and user experience) will be adopted by analyzing logs, metrics, and tracking, along with more thorough analysis of alerts to identify issues more accurately in complex environments.
Importance of Continuous Improvement to Ensure Operability and Security in IT Services
As we have seen, for any organization, IT system monitoring is critical to ensuring the operability, performance and security of their IT services, and it will continue to evolve to meet new challenges and deliver more benefits as technology continues to evolve. Therefore, improvement and updating must be constant, with a proactive approach based on knowledge from the data obtained by monitoring IT systems.
Finally, we recommend partnering with a monitoring tool provider capable of providing an integrated and unified platform that has the experience on the challenges and security requirements of both industry and local and international, considering that regulatory compliance is changing and can be overwhelming for your IT team.
Pandora ITSM is a balance between flexibility, simplicity and power
And above all, it adapts to your needs.