VMware Monitoring
Discover the power of Pandora FMS to monitor VMware
Explore how Pandora FMS simplifies your VMware vSphere environment management, providing you with a comprehensive solution from a single platform
Comprehensive and efficient supervision

Comprehensive monitoring
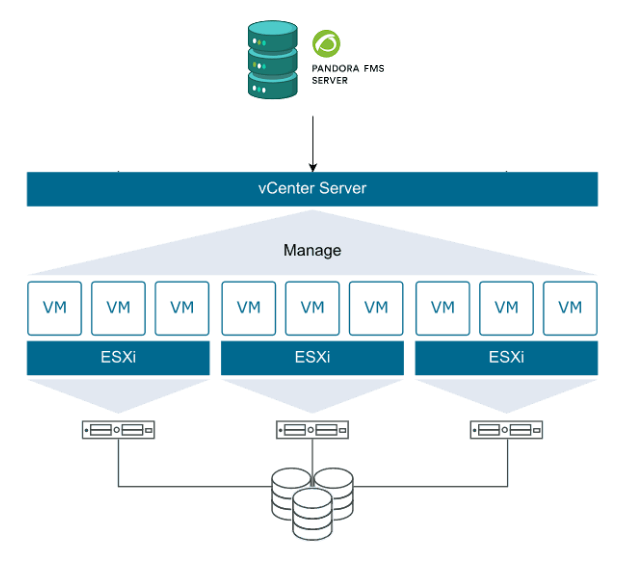
Monitor, explore, and generate alerts for the whole vSphere vCenter environment from a single remote point, no additional software requiered.

Generation of custom reports
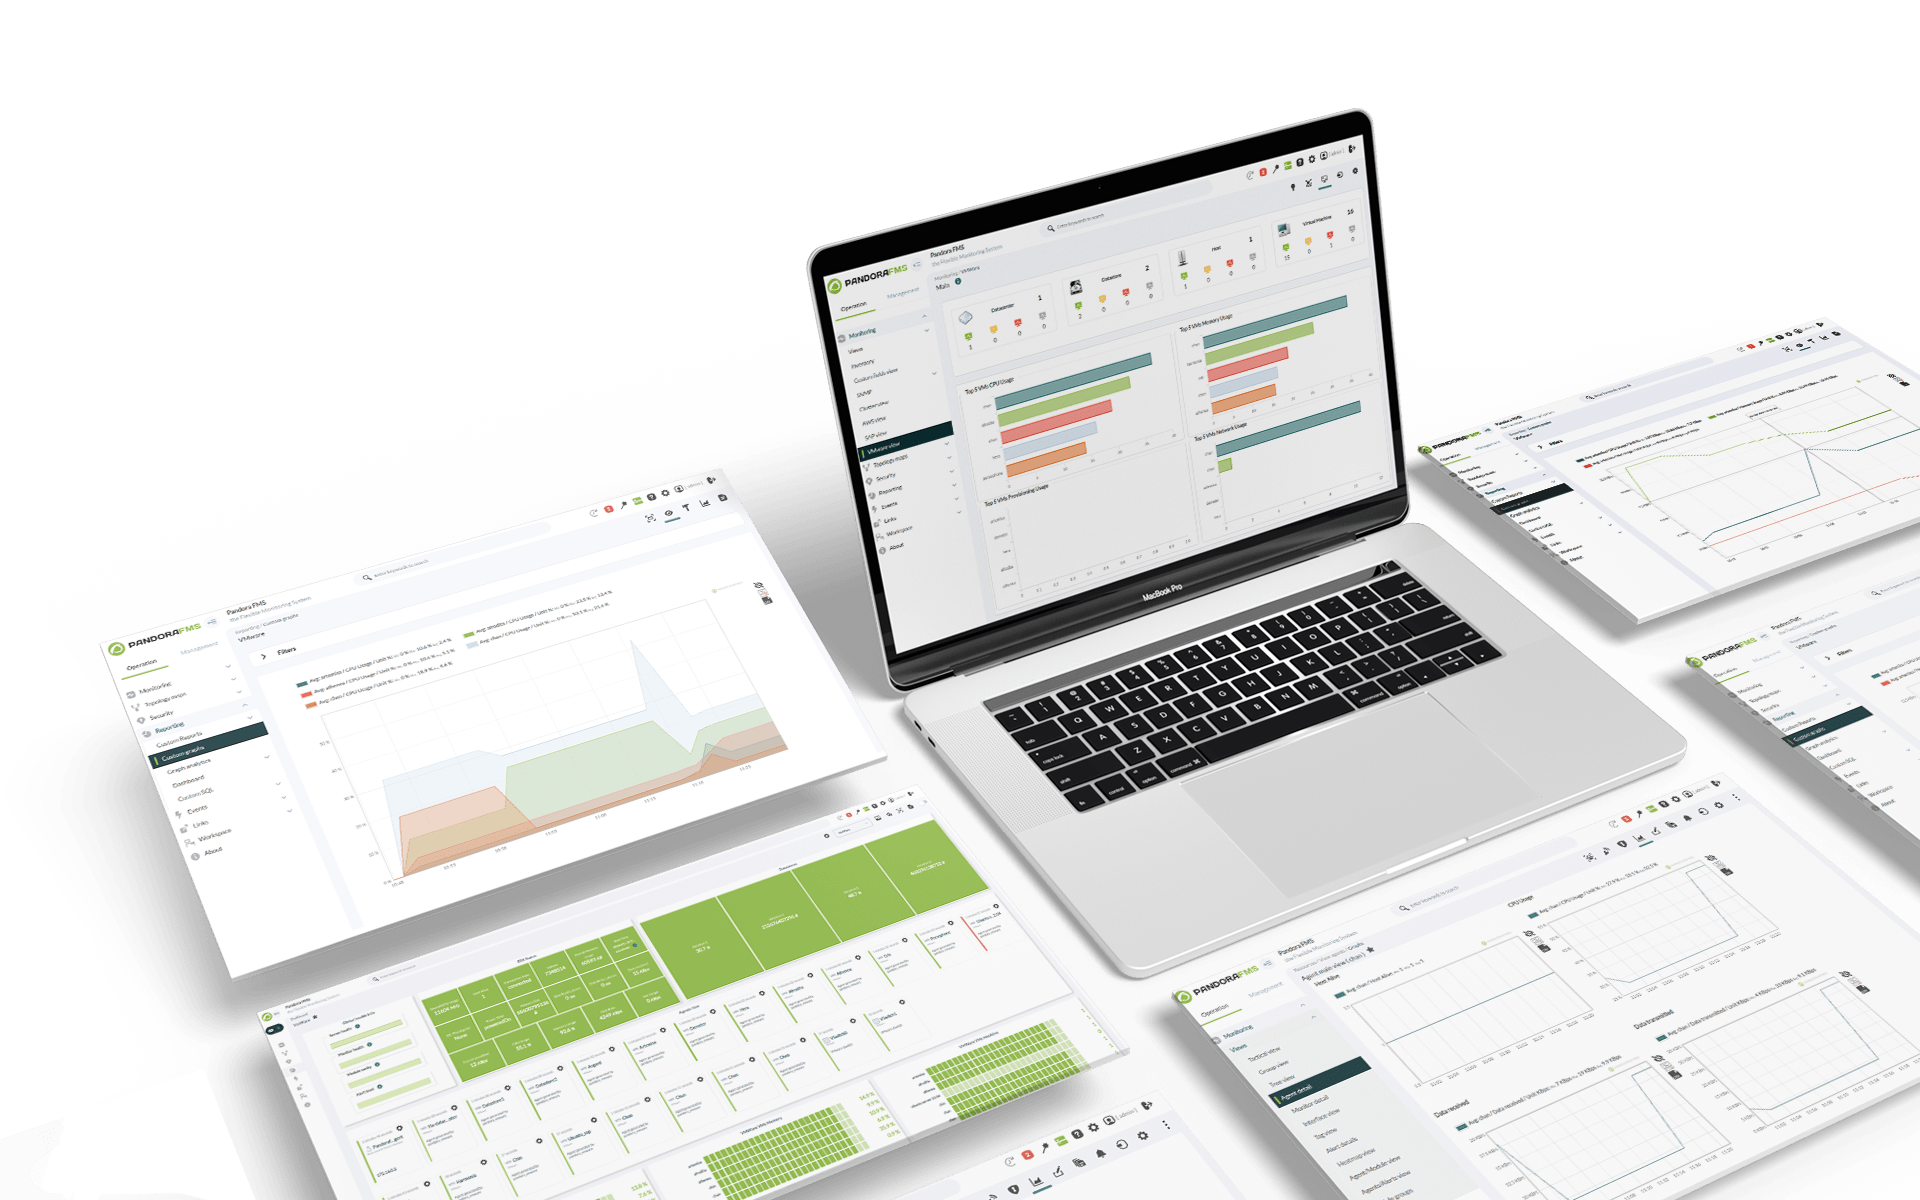
Using our report generator, you can combine and generate graphs and performance reports of the different vSphere elements for detailed analysis.

Instant alerts
Receive concise and immediate alerts through email, SMS, Telegram, or other chat tools to keep you informed of any anomalies.

Real-time view
Know the status of your whole vSphere environment at all times to make quick and effective decisions.

Multi-vSphere management
Manage all your separate vSphere environments for different departments or applications in a single platform.

Segmented visibility
It provides segmented visibility to different groups or customers for more efficient and custom management.
software all-in-one
With Pandora FMS, you may easily monitor individual ESXi nodes, as well as large vCenters with multiple ESXs and hundreds of virtual machines (VMs), all from an intuitive and friendly web interface
Do you have a complex structure or don’t know how to integrate it with Pandora FMS? Contact with us →

Custom and Quick Setup
Configure your VMware monitoring quickly and easily with Pandora FMS, adapting it to your specific needs without any issues.
- Flexible Device Selection
Easily choose the specific devices you want to monitor from our intuitive user interface, or turn on automatic scanning for dynamic detection of all device types.
- Full Customization
Adjust the scan interval according to your needs and easily access the status of all scheduled discovery tasks.

Preparing monitoring for VMware
is now easier than ever with Pandora FMS!
Follow these simple, customizable steps to start getting metrics in record time.
1. Starting the Wizard
Select the VMware app to launch your intuitive wizard.
2. Add the Required Parameters
Just enter the necessary parameters, such as IP address, data center name, and user credentials.
3. Device Selection
From our easy-to-use interface, choose the specific devices you want to monitor for total control.
4. Auto Scan
Enable automatic scanning to dynamically add new devices to monitoring as they integrate into your vSphere environment.
Customize the scan interval to suit your needs and ensure steady and efficient monitoring.
5. Scheduled Task Display
Upon process completion, access the list of all scheduled tasks to see the status of each one.
6. Detailed Summary
Get a clear and full summary to stay in control of your monitoring.
With these simple steps, you’ll be ready to monitor your VMware environment with Pandora FMS in no time and confidently!

Clear and Accurate Results
Get detailed and accurate metrics for every component of your VMware environment, enabling you to make informed decisions effectively.
Get ready to have a variety of agents tailored to your needs:
- One agent per Vcenter (should you need one).
- A dedicated agent for each ESXi.
- An agent assigned to each virtual machine (VM).
- A special agent for each Datastore.
- And, of course, an agent for every Vswitch!
Detailed Metrics for Optimal Monitoring
Access detailed metrics that will allow you to optimize your virtual infrastructure performance, ensuring efficient operation at all times.

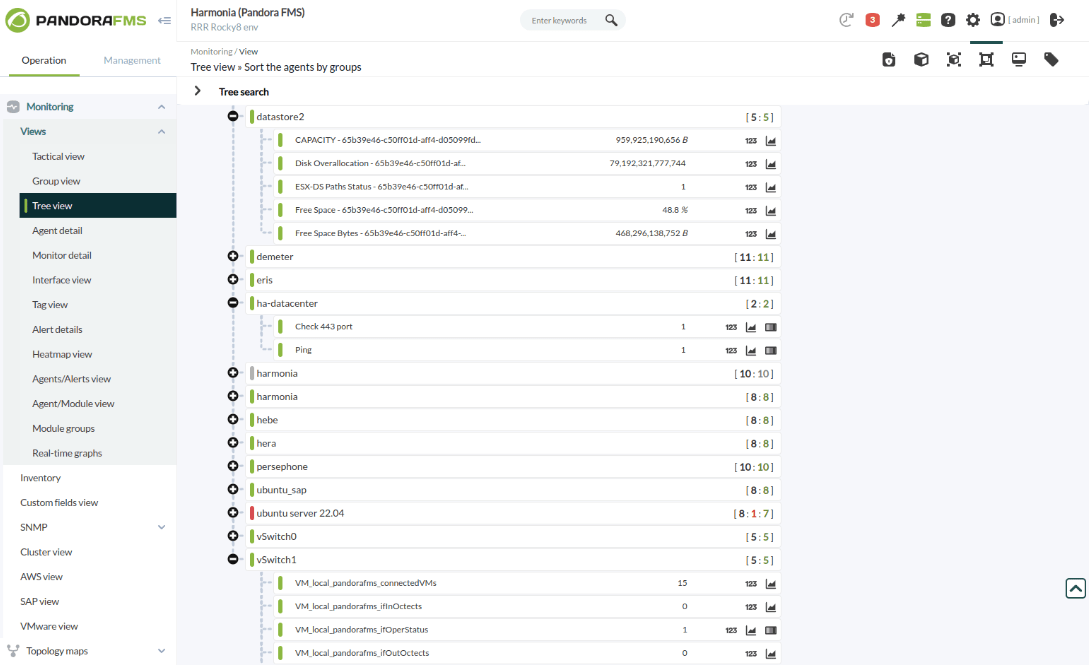
Datacenter
- Ping: It pings the computer that supports vCenter to verify its connectivity.
- Checking Port 443: Checks the availability of port 443 on the computer that supports the vCenter.
Datastore
- Capacity: It displays the maximum datastore capacity in bytes.
- Free Space: It indicates the percentage of free space available in the Datastore.
- Disk Overallocation: It provides the percentage of disk overallocation.
- Free Space in Bytes: It details the amount of free space available in bytes.
- ESX-DS Path Status: It verifies whether the Datastore is accessible to all configured ESXs.
VSwitch
- Operating State: It indicates the operational status of the physical or virtual network interface.
- General Status: It shows the overall status of the VSwitch in terms of availability and health.
- Connected VMs: It displays the number of VMs connected to the VSwitch.
- Network Usage: It offers network usage metrics, including ifInOctects and ifOutOctects for VSwitch.
Virtual Machines
- CPU Usage: It shows CPU usage percentage.
- Received Data: It displays the rate of data received in Kbps from the VM.
- Transmitted Data: It displays the rate of data transmitted in Kbps from the VM.
- Disk Read Latency: It displays disk read latency in milliseconds.
- Disk Write Latency: It displays disk write latency in milliseconds.
- Connection Status: It indicates the connection status of the VM.
- Tool Execution Status: It indicates the current status of VMware Tools installed on the guest operating system.
ESX
- Start-up Time: It indicates the last date the host was powered on.
- Memory Size: It displays the total amount of physical memory of the host in bytes.
- General CPU Usage: It displays the sum of the CPU usage of all cores in MHz.
- General Memory Usage: It indicates the total memory usage of the VMware host.
- Power Status: It indicates the host’s power on or off status.
- SSL Digital Footprint: It provides the host’s SSL footprint.
- Activity Time: It displays host uptime in seconds.
- Connection Status: It indicates the connection status of the host.
- Disk Reading: It shows the oil supply rate in Kbps.
- Disk Writing: It displays the disk writing rate in Kbps.
- Disk Read Latency: It displays disk read latency in milliseconds.
- Disk Write Latency: It displays disk write latency in milliseconds.
- Received Data: It displays the rate of data received in Kbps from the host.
- Transmitted Data: It displays the rate of data transmitted in Kbps from the host.
- Network Usage: It offers network data received and sent from all NICs.
VMWare resources for pandora fms
Want to learn more? Explore more resources
Monitor VMWare with Pandora FMS: Videotutorial on the use of Discovery.
Complete documentation: All about VMWare monitoring with Pandora FMS.
Blog article: Details about VMWare monitoring with Pandora FMS.
Power your virtual infrastructure management with Pandora FMS
Discover how Pandora FMS can take your VMware monitoring to the next level, offering powerful tools and an intuitive interface for effective management. Ensure optimal performance and efficient management of your devices with this powerful combination.


