Console Management
This section covers various aspects of Pandora FMS management: user creation, group administration, backups, etc.
Profiles, Users, Groups and ACLs
Pandora FMS is a web management tool. Thanks to the 100% multitenant permission system, multiple users with different permissions can work, accessing the information of the same Pandora FMS setup without some seeing the information of others.
To add users, it is important to have the groups and profiles well defined, being clear about what data each user needs to view and/or modify.
Users on Pandora FMS
Users are managed from Management → Profiles → Manage users. By default you can view the defined users:
Notable fields when creating or editing:
- Administrator user: An Administrator user (superadmin) will not be governed by the internal ACL system and will have access to everything. The standard user will be governed by the Pandora FMS ACL permissions assigned to them.
- Login Error: If this field is checked, the user will only be able to access the API but not interactively through the console.
- Local user: To perform user authentication against your own database. PFMS also supports other authentication methods.
- Control of timeout session: By default activated, it checks if there has been no activity in the time period set in Session time (mins) to close the session.
- Session time (mins):
- The default value is
90minutes and when you set this value to0for a user, Pandora FMS will use the value saved in the General Settings, authentication section.
- Language: By default it is the system language. You can also assign a specific language in which the user will see the Pandora FMS Console.
- Block size for pagination: Default pagination size for that user.
- Timezone: Field where the time zone of the console is set to display different elements (General view of agents, View of modules, …).
- Login allowed IP list: If you activate this option, login will be limited to a list of IP addresses (and/or ranges) separated by commas. To connect from any IP address use the
*(asterisk) wildcard. - Profiles/Groups assigned to this user: Selection of profiles and/or groups in which the user will be organized or have access.
Editing of a User by the user himself
All users can modify certain parameters of their own configuration in Workspace → Edit my User. The user creation form will appear where you can configure some sections, except for group permissions.
Version 768 or later: You can authenticate with API Token by submitting to HTTP headers of a bearer token, generated by each user and for their own private and particular use. If a warning icon appears ![]() adjacent to the API Token configure the file
adjacent to the API Token configure the file php.conf.
Notification settings
Pandora FMS has a notification system for its users and, in addition, to facilitate its administration it also has group management. The different types of notification are the following:
- System status.
- Message.
- Pending task.
- Advertisement.
- Official communication.
- Sugerence (Suggestions).
ENABLE USER CONFIGURATION: This token enables users, in the Operation → Workspace → Configure user notifications section, to enable or disable said notifications in the console and/or by email.
For notifications to arrive by email, the user must have their email configured in their user profile, and the Pandora FMS server must also be configured to send emails.
If a user belongs to a group and said group is added to one of the notification categories, said user will have active console notifications for that corresponding notification category, however they will not be able to modify it even if ENABLE USER CONFIGURATION is activated (for that category).
By default, the user admin comes with active notifications from System status and Official communication even if these categories are inactive. Any superuser that is added later will be in all notification categories.
Groups on Pandora FMS
Introduction
The group concept in Pandora is fundamental. Groups are sets of elements with their own rules whose function is to help control user access to certain aspects or elements within Pandora FMS.
It is important to know that an agent can only belong to one group, but a user can have access to one or more of these groups.
The "All" Group
Pandora FMS has a system of groups, which are entities into which agents are classified and are used to break down privileges. In this way, users are granted certain permissions framed in one or more groups and will thus have the ability to see and interact with agents and other objects in their context.
To facilitate the assignment and filtering of groups, there is a tool called All group. The group All means, depending on the context, ALL groups or ANY of them.
Its reserved identifier is ID 0 (Identifier zero), with the difference that it is completely controlled by code, without there being a group with that ID in the database.
Agent group management
Menu Management → Profiles → Manage agent groups.
Clicking on the previous menu will show the predefined groups and/or created by users. From here you can edit a group of agents by clicking on the group name or delete it with the respective button in the Actions column.
To create a group of agents, use the Create group button, notable fields:
- In order to use the group name for automatic Agent provisioning, it is recommended that it be free of spaces and extended characters (although this is supported).
- Parent: Another group can be defined as the parent of the group being created.
- Password: Optional password. Allows you to restrict the auto-creation of Agents (automatic provision of Software Agents or Satellite Server) so that only Agents can be created that have the same password as the one defined in this field.
- Alerts: If checked, Agents belonging to the group will be able to send alerts. You can use this property to quickly disable alert generation for a specific group of Agents.
- Propagate ACL: If enabled, child groups will have the same ACL permissions as this group.
- Custom ID: The groups have an ID in the Database, in this field it is possible to put another custom ID that can be used from an external program to perform an integration (e.g. CMDB's).
- Contact and Other: Contact information and notes via the
_group_contact_and_group_other_macros. - Since version 754 you can limit the number of Agents in each group using the Max agents allowed field. Default value zero (no limit). Also through the Pandora FMS API, by create a group or edit a group, you can Set the maximum number of Agents in a group, if necessary.
Import agent groups from CSV
This extension allows you to import a file with records (whose fields are separated by commas , or another character you choose from the list Separator) and define groups, to the Pandora FMS server
The extension is accessed from Management → Admin tools → Extensions manager → CSV import group. Choose the file to import by clicking on Browse…, select the separator character and click on the Go button.
The CSV file must contain the following fields in the following order:
Group name, icon, parent id, propagation (1 or 0).
Profiles on Pandora FMS
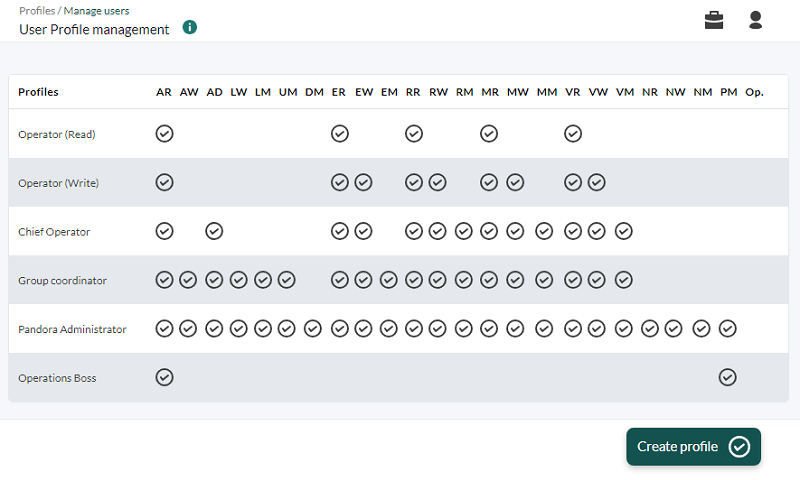
Profiles are managed from Management → Profiles → Profile management.
Pandora FMS profiles allow you to define what permissions a user can have. The combination of profiles plus a group, associated with a user, allows defining what permissions a user has on a group of agents, so that they can have different profiles in different groups.
There are preloaded profiles and you can also create all the profiles that are necessary taking into account the profiles below.
Profile list
This list defines what each profile enables:
| Access bit | Operation |
|---|---|
| AR | - View agent data (all views) - Tactical view - Group view - View users - View SNMP Console, Tree view, Extension Module Group and Search Bar |
| AW | - Agent management view - Editing the agent and its .conf - Mass operations - Create agent - Duplicate remote configuration - Policy View and Management - Manage filters |
| AD | - Service stop management - Deactivate agent/module/alert |
| Access bit | Operation |
|---|---|
| LW | - Assignment of already created alerts - Alert management |
| LM | - Define and modify templates - Define and modify actions |
| Access bit | Operation |
|---|---|
| UM | - User Management |
| DM | - Database maintenance |
| Access bit | Operation |
|---|---|
| ER | - View event |
| EW | - Validate/Comment event - Manage filters - Execute responses |
| EM | - Delete event - Change owner/Re-open event |
| Access bit | Operation |
|---|---|
| RR | - View report, graph, etc. - Apply a report template - View Cronjobs (Task list) |
| RW | - Create a Visual Console - Create a report - Create a combined chart - View, edit, execute and create Cronjobs (except Execute custom script, Backup and PHP function) |
| RM | - Create a report template - View, edit, run, create and delete Cronjobs (except Execute custom script, Backup and PHP function) |
| Access bit | Operation |
|---|---|
| MR | - Network Map View |
| MW | - Editing network maps - Deleting own network maps |
| MM | - Deletion of any network map |
| Access bit | Operation |
|---|---|
| VR | - Visual console view |
| VW | - Visual console edition - Deletion of own visual consoles - Deletion of any visual console |
| VM | - Visual console management |
| Access bit | Operation |
|---|---|
| NR | View data from NCM |
| NW | Operate NCM |
| NM | Manage NCM |
| Access bit | Operation |
|---|---|
| PM | - Manage responses - Customize event columns - Update manager (Operation and Administration) - Create inventory modules - Manage modules (Including all sub-options) - SNMP console management - Profile management - Server management - System audit (editing and viewing) - Setup (all lower tabs included) - Administration extensions – Define and modify alert commands - View, edit, execute and create all types of Cronjobs (Task List) |
| GW | - Group management: non-superadmin users will only be able to edit the group associated to a profile in their user data. If the selected group has the Propagate ACL option, they may also manage the child groups of that group. The special group All has Propagate ACL enabled by default. |
| Combination of permissions | |
|---|---|
| EW & IW | - Create incident through event (Response) |
| LM & AR / AW & LW | - Validate alerts |
Permission Assignment
From the user edition, a user can be assigned access to one or more groups with a specific profile:
If a standard user is created without a profile or group, said user will not be able to log in to the Pandora FMS server.
Assignment of profiles and groups with user management (UM) permission
Several possible scenarios have been taken into account:
- A manager user with UM permissions that belongs to the
ALLgroup will be able to manage any user regardless of the group to which they belong. - Access can be added to groups before creating a user as such.
- A manager user can edit profiles and groups only on users that he can see because they belong to the groups he manages with UM permissions.
- An administrator user can create other administrator users and can manage any other user, but in no case can a manager user with UM permissions remove UM permissions from another user who has the same permissions on the same group . This can only be modified by an administrator.
- A manager user without UM permissions on a group cannot see which users belong to that group.
- A manager user can delete the user relationship with the groups he manages and even the entire user if he only has a relationship with the groups he manages.
In the event that a user's last profile/group relationship is to be deleted and the user is to be deleted, Pandora FMS will display a warning notice.
- A manager user who has UM permissions in one group and not in another, can only see the profile/group information of the groups they manage, even if the observing user has more permissions for other groups. The rest of the user's information will be unrelated to the manager user. In this way, the manager user will only be able to obtain information or modify the permissions on the groups he manages, but at no time will he be able to delete more permissions or delete the user.
Permission systems extended by tags
The individual access to the modules of an agent can be configured with a Tags system (Tags). Some tags are configured in the system, they are assigned to the modules that are needed and, additionally, it is possible to restrict the access to a user only to the modules that have those tags defined.
The Tags are defined in. Management → Profiles → Module Tags.
- Access by Tags does not replace access by groups: it complements it.
- In some global views (tactical view, group view, general tree counts) the totals show all modules, not just those visible by the Tags.
Modules
Users
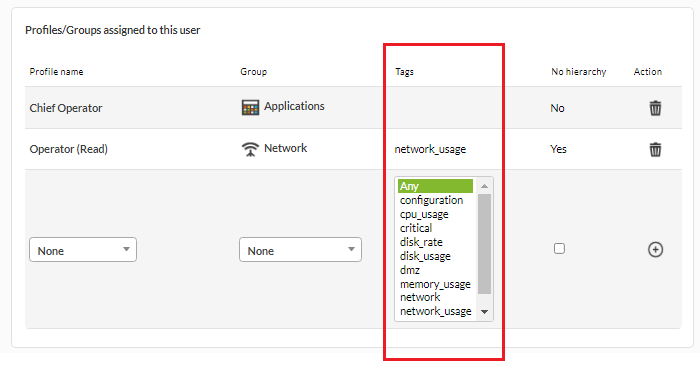
To assign a user specific access to a tag, it must be done through the user editor, in the profile and group assignment, adding a tag:
This system, called Tag-based security mode, allows you to restrict access to all the agent's content, but has performance penalties, so it is designed exclusively to give access to small portions of information, that is, should not be used with more than two or three tags per user/profile/group combination.
Hierarchy
In previous sections it was explained that the permissions of a group can be extended to children using the Propagate ACL configuration option. However, from the user configuration, you can limit this functionality and prevent the ACL from propagating by checking No hierarchy.
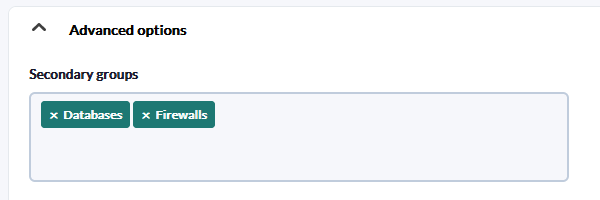
Secondary groups
Secondary groups are optional.
The fact that an agent belongs to a secondary group means that it actually belongs to several groups at the same time. With this functionality, two users who have different permissions can access the same agent by simply adding the appropriate secondary groups.
Some views, such as the Tree View, can show repeated agents. When using secondary groups this is normal behavior.
ACL Enterprise System
The Open Source ACL model is based on Unix style: role/action/group/user .
The ACL Enterprise system allows you to define -according to profile- which pages (defined one by one one or by “groups”) users have access. This will allow you to redefine the sections of the interface that a user can see with the classic Pandora FMS ACL system.
- superadmin are exempt from ACL control, other users are ACL bound, even if they have the Pandora Administrator profile assigned.
- Both models are parallel and compatible. The Classic ACL system is complementary to and evaluated before the ACL Enterprise system.
Viewing permissions on shared items
Groups and profiles are designed so that a user has different roles in Pandora FMS. Basic monitoring elements such as agents and modules are governed by these basic group/profile rules, taking into account how they are extended with the use of secondary groups and tag permissions.
Other Pandora FMS elements such as reports, Visual consoles, maps red and dashboards, act as containers. If a user (with visibility to all managed data) creates a report and assigns it to a general group, users with access to that group will be able to see the report and all its contents, even if they do not have permission access to the groups. individual elements of your report.
Exceptions to this behavior:
- Some dashboard widgets such as the treeview or in the dashboard event control, since they allow you to interact with the data (to validate events) or in independent elements of the visual Console where you can restrict the display of a Console element to a certain group.
- It should be noted that the purpose of such elements, when access is given in read mode, is to be able to access data that could not otherwise be viewed by that user. It may happen that the user has read and write access. In this case, when you edit one of those containers, you will only be able to add items to which you have access andYou can delete items you don't have access to, but you can't add them again.
Servers
Manage servers
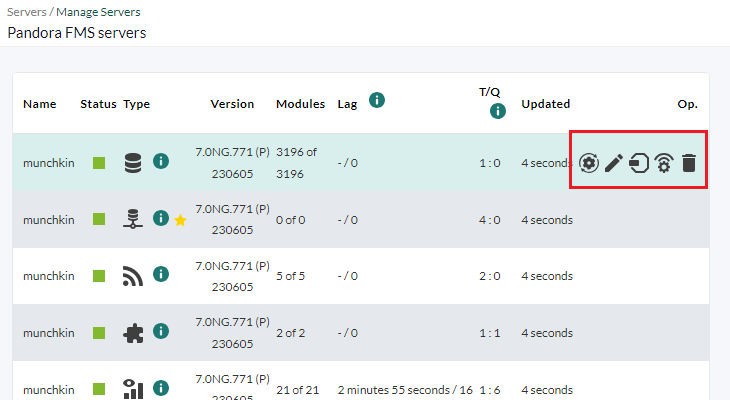
The detailed view of the servers is used to know, in addition to the general status of the Pandora FMS servers, their load level and delay in executions. Go to the Management → Servers menu and click on the Manage servers option:
Each server has its own icons, in the previous example image a Data server:
- Reset module status and triggered alerts count: To reset counts of triggered alerts and modules.
- Edit: To change the IP address and description of the server.
- Manage satellite hosts: Allows you to remotely configure the Satellite servers.
- Remote configuration: To enable remote configuration you will need to change the
remote_configtoken to 1 and then restart the PFMS server.- Server features: where you can enable or disable each of the servers you have according to the type of license purchased.
- Optimization settings: to tune each of the servers according to their characteristics, some more, others less.
- Other server settings: to configure automated tasks.
- Delete: To delete the server.
Manage consoles
Menu Management → Servers → Manage consoles.
To balance the load in the execution of console tasks on the Discovery server, you will be able to declare and add consoles in the config.php section.
Manage Database HA
It is accessed through the menu Management → Servers → Manage database HA, if centralization is enabled in the Command Center (Metaconsole), use the menu Setup → Manage database HA.
It allows to visualize and perform actions on the nodes that make up the High Availability system:
Credential Store
Menu Management → Configuration → Credential Store.
Pandora FMS has a credentials store. This store manages the identities that will be used in sections such as Discovery Cloud or the automatic agent deployment.
Pandora FMS allows the encryption of passwords] to be saved in the database.
To add a new entry, press the Add key button, and seven different types of credentials are available for registration:
- Amazon Web Services® (AWS®) credentials.
- Microsoft Azure® credentials.
- Personalized credentials.
- Google® credentials.
- SAP® credentials.
- WMI type credentials.
- SNMP (v1, v2, v2.c y v3) credentials.
The group assigned to the key controls the visibility of the key. Only a group to which the user creating the credential belongs can be assigned, unless that user explicitly belongs to the ALL group (ALL). Once added, it can be queried, filtered, and so on.
In the modification all fields can be edited except the credential type (Product).
Planned service stops
Pandora FMS has a system for managing planned or scheduled service stops in Management → Tools → Scheduled downtime.
This system allows you to deactivate the alerts in the intervals that there is a service stoppage, deactivating the agents.
When an agent is deactivated, it does not collect information either, so in a service stop, for most metrics or report types, the intervals where there is a service stop are not taken into account in the reports since There is no data from that time in the agents.
Audit log
Pandora FMS keeps a log with all the important changes and actions produced in the Pandora FMS Console. This log can be seen in Management → Admin tools → System Audit Log, where you can see a series of entries related to the Console activity, information about the user, type of action, date and a short description of the recorded events.
At the top left you can filter which entries to display by different criteria, including: actions, user, and IP address. You can even perform a text search and determine the maximum times to search.
It is also possible to export the information displayed on the screen to a CSV file, by clicking on the button at the top right of the screen.
Local server logs
Menu Management → Admin tools → Extension management → System logfiles. From this extension you can consult the logs tanto the console as well as the local server.
If the contents cannot be viewed, configure the permissions of your log files by running in a terminal window with the appropriate permissions:
chown -R pandora:apache /var/log/pandora/
You can adjust the rotator options to keep these settings by modifying the file /etc/logrotate.d/pandora_server
/var/log/pandora/pandora_server.log
/var/log/pandora/web_socket.log
/var/log/pandora/pandora_server.error {
     weekly
     missingok
     size 300000
     rotate 3
     maxage 90
     compress
     notifempty
         copytruncate
     create 660 pandora apache
}
/var/log/pandora/pandora_snmptrap.log {
     weekly
     missingok
     size 500000
     rotate 1
     maxage 30
     notifempty
     copytruncate
     create 660 pandora apache
}
On the other hand, there is also a specific configuration for rotating console logs in /etc/logrotate.d/pandora_console:
/var/www/html/pandora_console/log/audit.log
/var/www/html/pandora_console/log/console.log {
         weekly
         missingok
         size 100000
         rotate 3
         maxage 15
         compress
         notifempty
         create 644 apache root
}
In case of updating by OUM from a version prior to 747, the logrotate file must be modified manually.
Database Management from the Console
The core of the Pandora FMS system is its database. All the data collected by the monitored systems, agent configuration, alerts, events, audit data, different users and their data are stored there.
To perform database maintenance on a regular basis, administrators can use standard MySQL commands from the command line or they can manage the Database from the Console with various extensions for this .
External Tools
Known in previous versions as Network Tools, it is now located in Management → Setup → Setup → External Tools.
- Allows you to customize the sounds of the audible alerts.
- If necessary, you can indicate the full path to the utilities snmp, ping, etc.
- Custom commands can be added, which can use macros such as
_address_(IP address of an agent) as a parameter to execute the respective command.
Backup
For backup option see section Discovery - Console Tasks.
Plugin Registration
It is an extension that allows you to register server plugins and is accessed by Management → Servers → Register plugin.
To register a plugin, choose the file by clicking on Browser and then on Upload.
You can find more information about server plugins (.pspz file format) in the section "Server plugin development".
Insert data
This extension is accessed from Management → Resources → Insert Data. Allows you to add data to an agent module, indicating its date and time and saving it with the Update button.
It also allows you to import data in a comma-separated (CSV) file to an agent module. The format of the CSV file must be date and value, separated by semicolons, one for each line. The date must be given in Y/m/d H:i:s format.
Make sure that the apache user has write rights to the /var/spool/pandora/data_in directory, if necessary run:
chown -R pandora:apache /var/spool/pandora/data_in
Resource registration
This extension allows you to import files in .prt format that contain the definition of network component, smnp component, local component or wmi component. You can also add all of them (except the local component) to a template.
This option is accessed through the menu Management → Resources → Resource registration.
File format.prt
<?xml version="1.0"?>
<pandora_export version="1.0" date="yyyy-mm-dd" time="hh:mm">
     <component>
         <name></name>
         <description></description>
         <module_source></module_source>
         <id_os></id_os>
         <os_version></os_version>
         <data></data>
         <type></type>
         <max></max>
         <min></min>
         <max_cri></max_cri>
         <min_cri></min_cri>
         <max_war></max_war>
         <min_war></min_war>
         <historical_data></historical_data>
         <ff_treshold></ff_treshold>
         <module_interval></module_interval><id_module_group></id_module_group>
         <group></group>
         <tcp_port></tcp_port>
         <tcp_send></tcp_send>
         <tcp_rcv_text></tcp_rcv_text>
         <snmp_community></snmp_community>
         <snmp_oid></snmp_oid>
         <snmp_version></snmp_version>
         <auth_user></auth_user>
         <auth_password></auth_password>
         <privacy_method></privacy_method>
         <privacy_pass></privacy_pass>
         <auth_method></auth_method>
         <security_level></security_level>
         <plugin></plugin>
         <plugin_username></plugin_username>
         <plugin_password></plugin_password>
         <plugin_parameters></plugin_parameters>
         <wmi_query></wmi_query>
         <key_string></key_string>
         <field_number></field_number>
         <namespace></namespace>
         <wmi_user></wmi_user>
         <wmi_password></wmi_password>
         <max_timeout></max_timeout>
         <post_process></post_process>
     </component>
     <component>...</component>
     <component>...</component>
     <template>
         <name></name>
         <description></description>
     </template>
</pandora_export>
Resources export/import
Management → Resources → Resources export/import menu.
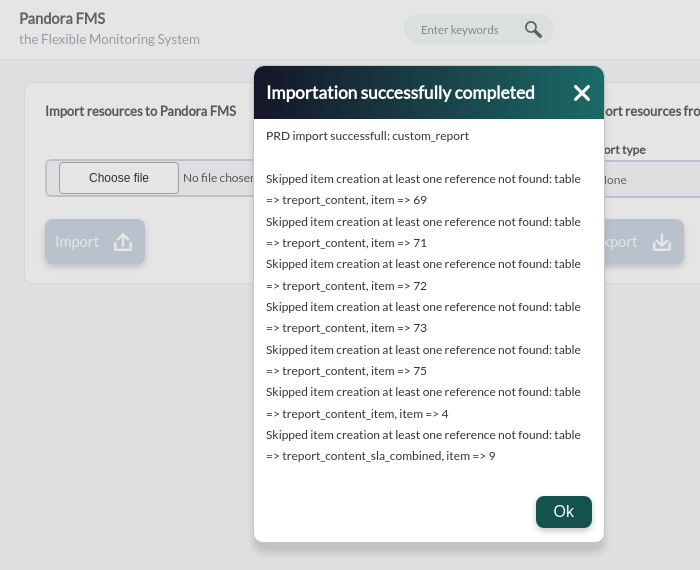
The new feature allows exporting and importing in PRD format, which is separate from database identifiers. This allows further flexibility when copying and/or moving elements between PFMS servers.
Choose an element type and then select one of the existing elements to be exported to a file with automatic naming. The file or files are copied to the target PFMS server and imported, if necessary incompatible elements will be reported.
The items available for export are:
- Custom graph.
- Custom report.
- Dashboard.
- GIS map.
- Network map.
- Policy.
- Service.
- Visual Console.
Text String Translator
This extension belongs to the Management → Setup → Translate string menu and allows you to translate text strings from the Pandora FMS interface in a personalized way.
- Language: Allows you to filter the string by language.
- Free text for search (*): Content of the string that you want to customize.
Three columns will appear: the first will show the original string, the second will show the current translation, and the third will show the custom translation that you want to add. Complete this last column and click the Update button to save.
You must pay attention to copying exactly the HTML code and the JavaScript language that may appear in the text to be translated.
Workspace
This section allows you to interact with Pandora FMS users, or edit the user's own details, as well as some various operations, such as access to the incident system (to open tickets), chat with other connected Pandora FMS users, etc.
Software Agent Repository
Menu Management → Configuration → Software agents repository.
The Software Agent repository is part of the Automatic Agent Deployment, which controls the available versions of agent installers (programs) to be deployed.
To add a new installer to the repository press the Add new software button. Fill in the information corresponding to the type of operating system, type of architecture, version and select the file to upload. Click on the Ok button and in a few moments it will be stored.
The installers for GNU/Linux® (and the entire Unix® and BSD® family) are common for all architectures. Both x64, x86, ARM, etc. share the same .tar.gz installer.
In the list of registered files there is an options column which contains edit, delete and synchronization buttons corresponding to each line.


 Home
Home

