Discovery
Discovery PFMS was updated to version 777, all its tasks were automatically migrated to the new Discovery .disco PFMS.
What is Pandora FMS Discovery?
Version NG 773 or later.
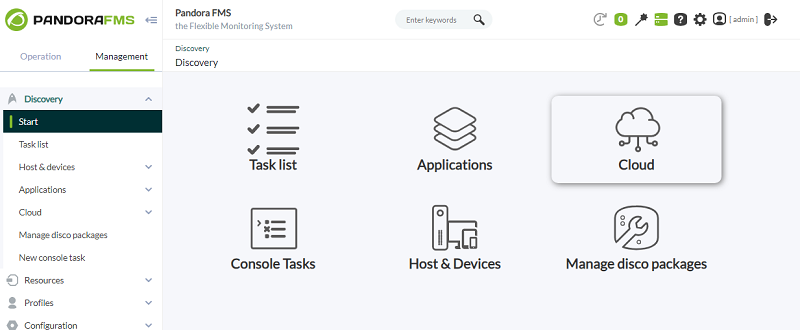
Discovery PFMS provides a set of tools to simplify monitoring through wizards.
- Task list: The Pandora FMS Discovery tool allows you to see a list of all the tasks scheduled in our environment, both at the console level and at the server level.
- Host & devices: It includes the necessary tools to discover or import devices and computers on the network.
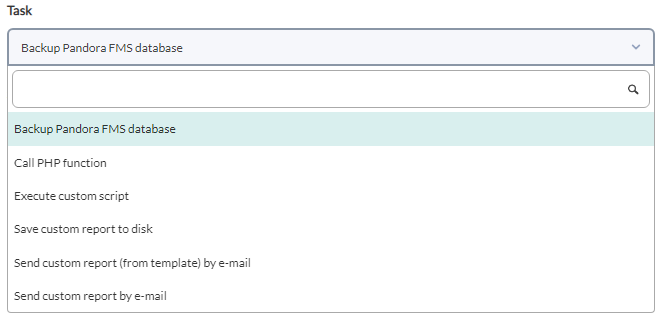
- Console Tasks: It includes the necessary tools to execute scheduled tasks from the Pandora FMS console, such as: - Backups of the Pandora FMS database. - Execute PHP functions. - Execute custom scripts. - Save custom reports. - Send personalized reports (from a template) by mail. - Send personalized reports by mail.
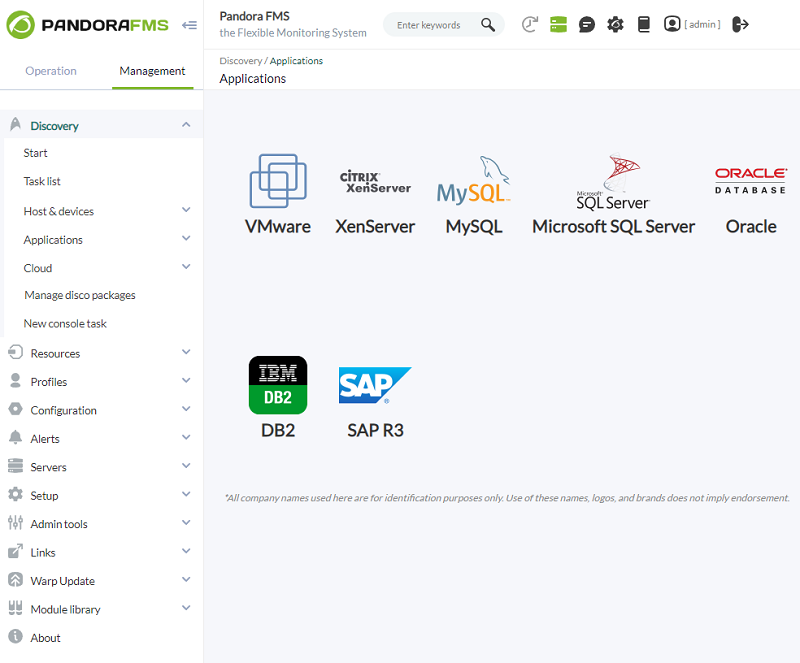
- Applications: It includes the necessary tools to monitor different applications from plugins loaded in the system, such as MySQL®, Oracle® or VMware®.
- Cloud: It includes the necessary tools to monitor different cloud environments from plugins loaded in the system, such as Amazon Web Services® or Azure Microsoft Compute®.
- Custom: It includes the necessary tools to monitor different environments or custom applications from plugins loaded in the system.
- Manage disk packages: The Pandora FMS Discovery tool allows you to load plugins from
.discopackages that can be used to monitor environments or applications. See also .Disco development
Task list
Management → Discovery → Task list menu.
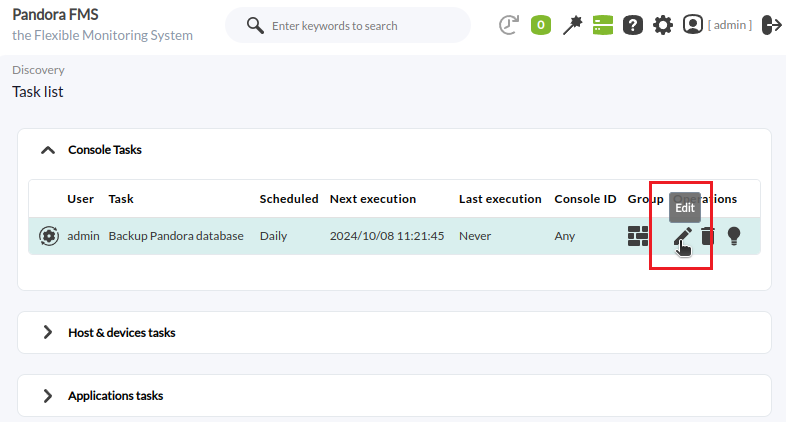
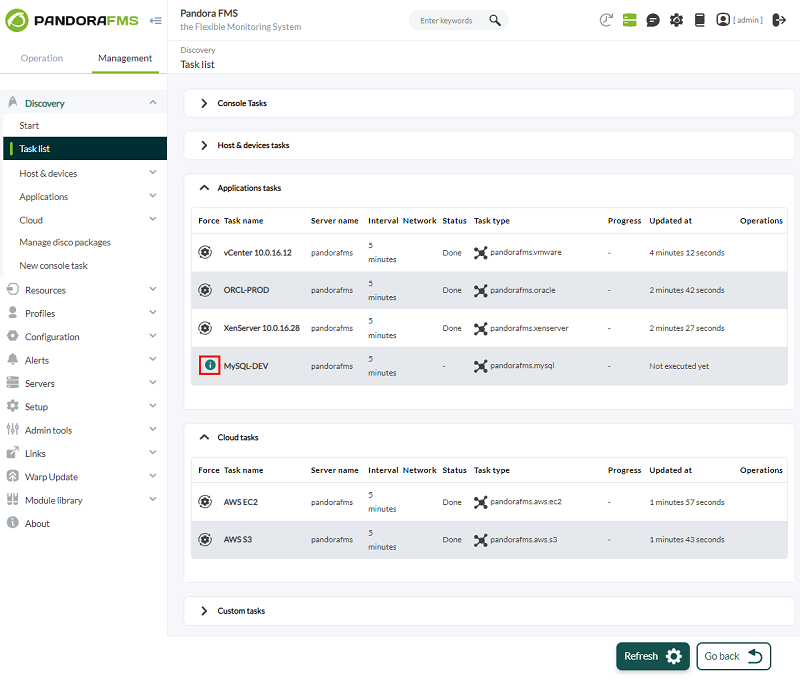
The Discovery Pandora FMS tool allows you to see a list of all the tasks scheduled in the environment, both at the Web Console level and at the server level. These tasks are distributed in tabs, depending on the type of task configured.
- Console tasks
.
- Host & devices tasks
.
- Application tasks
.
- Cloud tasks
.
- Custom tasks
.
Each tab has a button for filtering, as well as a button for reloading filters and clearing parameters
![]() .
.
Console tasks
Management → Discovery → Task list menu → Console tasks tab.
For each console task listed:
- User: Who created the task.
- Task: Summary of the task.
- Scheduled: Calendar planning.
- Next Execution: Specifies the next execution.
- Last Execution: Indicates when it was last executed.
- Group: The group to which it belongs.
- Operations: Shows the actions that can be performed for the current user: edit, delete or disable.
- Console ID: To balance the load in the execution of tasks, you can declare and add consoles in the
config.phpsection. Use the Console ID to identify and assign those consoles when creating or editing Console Tasks.
- Version 770 or later.
- You can indicate the console that will execute the task by Console ID.
- Each console has its own CRON that executes the respective tasks. You can only force the execution of a console task in its respective button. For example, if you have two consoles named A and B, these consoles work independently of each other, both are incommunicado with each other.
- See also Manage Consoles.
- See also Consoles dedicated to reports.
Create or edit console tasks
To create a Console task go to the Management menu → Discovery → New console task.
To edit a Console task go to the Management menu → Discovery → Task list and click the pencil icon corresponding to each task.
In both cases the interface is the same except for the respective button to create (Create) or edit (Update) and save the changes.
The common fields for each task are:
- Scheduled: Periodicity of the task, daily (Daily), every hour (Hourly), monthly (Monthly), once (Not scheduled , see next point), weekly (Weekly) and annually (Yearly).
- Next execution: Next execution of the task, select date in the first field and time in the second field (pop-up menu when clicking on each one).- Group: Group to which the task will belong.
The parameters to fill in change depending on the task you choose from the Task drop-down list:
- Backup Pandora FMS database Pandora FMS database backup task:
Save to disk in path: Path in which the information backup will be stored.
Active backups: Specific number of backups to keep to conserve storage space.
- Call PHP function Function execution task written in PHP language:
Function name: Name of the PHP function to be executed once or periodically.
- Execute custom script Script execution task
Custom script: Name of the script to execute.
- Save custom report to disk Custom report generation and saving task.
Report pending to be created: Custom report (drop-down list) from which this report will be generated. See “Creating a (custom) report”.
Save to disk in path: Path where the created report will be stored (the apache user must have read and write rights to that directory)
File name prefix: Name prefix for successive reports.
Report Type: To be saved in XML, PDF, JSON or CSV format.
- Send CSV log
Task for sending event records (logs) in CSV format, by email.
Send to e-mail: Mailbox to which to send the event records (logs) in CSV format.
- Send custom report (from template) by email
Reports (created from a template) to be sent by email:
- Personalized template for report creation, Template pending to be created.
- Information of the Agents for the report, Agents; if you want to generate separate reports for each report, Report per agent.
- Email addresses (separated by commas) to send the report, Send to email addresses.
- Subject of the email to be sent, Subject.
- Body of the message with which the reports will be sent, Message .
- Type of report that will be sent, Report Type.
- Send custom report by email Reports to be sent by email:
- Custom report (see “Creating a report” ) for report creation, Report pending to be created.
- Information of the Agents for the report, Agents; if you want to generate separate reports for each report, Report per agent.
- Email addresses (separated by commas) to send the report, Send to email addresses.
- Subject of the email to be sent, Subject.
- Body of the message with which the reports will be sent, Message .
- Type of report that will be sent, Report Type.
Host & devices tasks
Management → Discovery → Task list menu → Host & devices tasks tab.
For each task listed:
- Force: Force execution.
- Task name: Name.
- Server name: Server that will execute it.
- Interval: Time interval in which it will be carried out.
- Network: Network where the checks will be carried out.
- Status: Status of the scheduled task.
- Task type: Type
- Progress: Progress, if running.
- Updated at: Last update.
- Operations: The icons allow you to perform actions such as editing or deleting the task, among others. As of version NG 752, an icon is available that allows you to enable or disable each task in the task view.
Applications tasks, Cloud tasks and Custom tasks
Management → Discovery → Task list menu.
For each task listed :
- Force: Force execution.
- Task name: Name.
- Server name: Server that will execute it.
- Interval: Time interval in which it will be carried out.
- Status: Status of the scheduled task.
- Task type: Type.
- Progress: Progress, if running.
- Updated at: Last update.
- Operations: The icons allow you to perform actions such as editing or deleting the task, among others.
Discovery Host&Devices
NetScan
Menú Management → Discovery → Host & Devices → Network scan.
NetScan allows you to discover devices in one or several networks, obtain their topology and automatically monitor them.
This discovery may be configured in two ways:
- Simple mode: Pandora FMS server will automatically try to discover all the networks it is capable of.
- Advanced mode: The user must fill in the form with the data of the networks to be discovered by the task. This second option allows to specifically define the way in which the discovery will be performed.
The following options are configurable in both simple and advanced modes:
- Review results: Users must validate the results by selecting which agents will be created from those found by the discovery task. The user will also be able to decide at the time of the results review whether to create a network map of the task or not.
- Create network map: The task will automatically create a network map with the discovered hosts. This option will also cause the task to add new hosts to all network maps whose data source is this discovery task.
- Apply autoconfiguration rules: It applies the previously defined automatic configuration rules to the detected agents.
- Automatic configuration allows you to apply policies, group and configuration changes, as well as trigger custom events or run scripts on actions.
- Agents detected by NetScan are remote agents without a configuration file. It will not be possible to apply local monitoring policies or add configuration changes in bulk if an agent is not deployed on targets.
The following options will only be available in the advanced mode configuration:
- Networks: List of network addresses to be scanned. Only networks with a valid CIDR format, e.g.
192.168.10.0/24will be scanned. The list of networks can be loaded from a CSV file, where each file line must be a valid network. - Blacklist of IPs and networks: List of IP addresses or networks that will be excluded from the scan. Addresses with or without the network mask in CIDR format, for example
192.168.10.150or192.168.20.0/24will be valid. The list can be loaded from a CSV file, where each line of the file must be a valid IP address or network. - Scan SNMP network interfaces: It enables scanning of SNMP interfaces of discovered devices. This allows the scan to add monitoring modules for network interfaces and to perform a level 3 topology scan for network maps. In simple mode this option is enabled.
- Scan SNMP known hardware: It enables the hardware scanning known by SNMP for the discovered devices. This allows the scan to add SNMP modules based on the manufacturers of the devices (registered in Pandora FMS) using components of the SNMP wizard of the console library. In simple mode this option is enabled.
- Scan WMI devices: It enables the scanning of MS Windows® computers by remote WMI. This allows the scan to add WMI modules using WMI Wizard components from the console library. In simple mode this option is disabled.
- Resolve hosts names: It enables computer name discovery in network scanning. This option is disabled in simple mode.
- Guess hosts OS: It enables operating system discovery for devices found in the network scan. This option can take quite a long time, depending on the number of devices found. In simple mode this option is disabled.
- Scan additional information: It enables the discovery of additional information for the devices found in the network scan. This information will be visible in the description of the agents created by the task. This option may take quite a long time, depending on the number of devices found. In simple mode this option is disabled.
- SNMP credentials to try: Set of SNMP credentials from the Credential Store to be tested for devices found with SNMP enabled. The set of credentials from version 1 and public community is always tested, even if it is not found in the configured credential store.
- WMI credentials to try: Set of WMI credentials from the Credential Store that will be tested for devices found with WMI enabled. These credentials will only be used if WMI device scanning is enabled.
The network scan tries to collect as much information as possible from the network and devices scanned, so it is possible that IP addresses or networks that are not within those defined in the task (intermediate networks, possible connected devices, etc.) may be included as part of the result.
Once the wizard is completed, Discovery PFMS will start running at each defined interval.
Intervals selected as manual must be launched manually. Discovery PFMS will not launch a manual task automatically.
Once the task is finished, if you access from Review , you will see a summary of the devices found and the other metrics available through SNMP or WMI. All IP addresses will be displayed, each in one of these two states:
- Disabled: An agent or module in monitoring already exists in the environment and will not be created or modified.
- Enabled: This is a new element that is not being monitored or that within the metrics obtained has responded with a new module, which will be shown in a drop-down list. In the devices that are in this status you may select to add it to the list of monitored agents or if you choose to add it to any of the new enabled metrics.
Once the targets to be monitored have been selected, the system will automatically create them.
During discovery it will be possible to view the progress of the task at each of its multiple steps, as well as a temporary network map of the topology that has been discovered.
The network map displayed does not necessarily match other network maps configured in the console, as the latter may not be up to date or may have been manually edited by users.
Automatic agent deployment
Management → Discovery → Host & Devices → Agent deployment menu.
The steps to deploy EndPoints from the Console are:
- Register the versions of EndPoints to be deployed in the agents repository: You will need the installers of the agents to be deployed. You can also use custom agents.
- Register the credentials that will be used to connect to the targets in the credentials manager: You will need to specify the credentials with which access to the found or specified targets will be tested.
- Scan, add or load targets.
- Deploy EndPoints with Task list element.
This system does not perform PUSH type operations; all deployments are broadcast offering the EndPoints and ordering the target to install it.
NetScan custom
Management → Discovery → Host & Devices → Custom network scan menu.
It allows the execution of custom scripts for the execution of network recognition tasks.
Please specify:
- Task name: Name of the recognition task.
- Comment: Allows you to add comments.
- Discovery server: Server that will execute the task.
- Group: Group to which it belongs.
- Interval: Execution interval.
Once the task creation process is completed, it will be necessary to specify the script that you want to run, as well as the configuration file necessary for its execution.
Net scan scripts
Management → Discovery → Host & Devices → Manage scan scripts menu.
This section displays the different scripts that have been created for custom recognition tasks. A view is displayed in which the name and description of the task are defined.
Pandora FMS allows you to add additional scripts to facilitate the monitoring and recognition of the required networks.
Parameters to be defined:
- Name: Script name.
- Script full path: Path where the script is located.
- Description: Script description. You can define descriptions of the different fields, as well as default values for them.
- Hide value: If you want to hide the value of a field.
- Help: Help fields.
The creation of scripts allows you to add macros with which you can define all the parameters necessary for the correct execution of the script.
Import CSV
This CSV importer will not perform any Discovery task, it will only create empty agents with the name, IP address, OS type, description and group provided in the CSV file.
Should you wish to record targets in bulk, you may upload a CSV file with the following format:
Agent alias, IP address, OS id, Interval, Group id, Description
- Agent alias: Alias of the future agent, if you select the Alias as name option the name will be the same as the alias.
- IP address: IP address of the computer where the agent will be installed.
- OS id: Operating system identifier number, AIX, BSD, HP-UX, GNU/Linux, Solaris, MS Windows® are supported
- Interval: Time in seconds between each check.
- Group id: Group identifier number to which the agent will belong.
The system will create targets based on what is defined in the CSV.
Applications, cloud and custom
Version NG 773 or later.
With Pandora FMS it is possible to monitor applications and cloud environments remotely using Discovery PFMS.
To do this, it will be necessary to load the plugins that you want to use for monitoring, which may be custom or official Pandora FMS plugins.
These plugins are loaded in ''.disco'' packages which will include their own configuration interface and executables necessary for proper operation.
Creating and editing tasks
When creating or editing a task for Applications, Cloud or Custom, the form that we must fill in will be adjusted according to the plugin used in the task. This means that, for example, the VMware® task form will be different from the XenServer® task form.
However, for all tasks, a minimum necessary information must be indicated:
- Task name (required).
- Group (required).
Once this minimum information is filled in, the following steps of the form will be adjusted according to the plugin used, being able to have tasks with more configuration steps than others:
During the definition of the task we can go from one step to the next using the Next button, which will update the parameters of each step for the task.
We can also finish the definition of the task using the Complete setup button, which will update the parameters of the step in which we are and mark the task as fully configured so that the server can execute it.
When a task is not fully configured, it will be displayed in the task list with an icon indicating so:
Task execution result
All tasks will have a status associated with them:
- Done: The server has completed the task without encountering any errors during its execution.
- Failed: The server has encountered at least 1 error during the execution of the task.
- Not started: The server has not yet started the task.
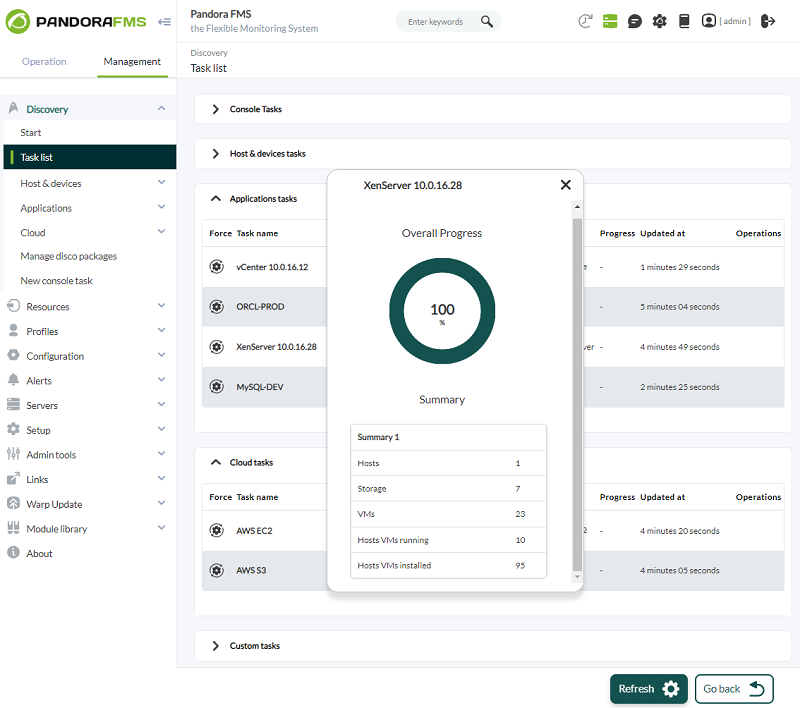
For any task, its execution summary (failed or successful) can be consulted , which depending on how the plugin used for the task is defined, will be displayed with different information:
The result of the execution of a task will always depend on the plugin used by it, so it is possible that even having finished with a Failed status, the task is able to generate monitoring for a set of agents.
Discovery packages
Find the officially available packages for monitoring with Pandora FMS in the module library.
Manage disk packages
This section allows plugins to be loaded from .disco packages that can be used to monitor environments or applications.
Version NG 773 or later.
From the console you can see the list of plugins available for Discovery PFMS and you can load new ones (Load DISCO), whether they are official Pandora FMS or customized.
Each downloaded file with .zip extension must be renamed to .disco extension before being entered in the Web Console.
For each listed plugin:
- Name: Name of the plugin accompanied by an icon that allows distinguishing it. This name and icon are what the plugin will be displayed with when creating new tasks.
- Short name: Identifier name of the plugin. This name is a unique identifier that allows distinguishing the plugin from others, so there cannot be more than one plugin with the same short name loaded in the system. Short names that start with
pandorafms.are used by Pandora FMS to distinguish official plugins, so short names that start like that should never be used for custom plugins. In addition, these short names are used to name the directory that will contain all the files needed by both the console and the Pandora FMS server. - Section: Section of the Discovery interface in which the plugin will be displayed to create and list tasks. It can be app, cloud or custom so that the plugin tasks are inside Applications, Cloud or Custom respectively.
- Version: Version of the plugin loaded.
- Actions: You can delete a plugin from the list (along with all the tasks that use it) or manually synchronize the plugin files found in the console with the Pandora FMS servers in the environment.
File Synchronization
For the tasks of a plugin to work, it is necessary that both the console and the Pandora FMS server have the content of the .disco package in an accessible directory.
That is why the list of plugins includes the action button to synchronize the files with the server in each plugin.
Since the console is in charge of uploading new .disco files, it is the same console that is in charge of synchronizing the necessary files with the server.
The moment a .disco file is loaded, the console automatically synchronizes the files with the server. However, if necessary, the button to synchronize the plugin files will force the synchronization to be carried out at that moment when it is pressed.
Files in the console
As an entry point, the console stores the files for each plugin in a directory with the short name of the plugin inside:
pandora_console/attachment/discovery
For example, the directory for the pandorafms.vmware application would be:
/var/www/html/pandora_console/attachment/discovery/pandorafms.vmware
If the minimum necessary files are not found for a plugin within its directory, the following icon will be displayed, preventing file synchronization with the server, and it will be necessary to upload its .disco package again to solve the mistake.
Files on the server
In order to execute the tasks defined for a plugin, the Pandora FMS server must have the plugin files.
To achieve this, the console synchronizes the files of each loaded plugin with a directory accessible by both the console and the server.
Said directory, called discovery, is found within the one configured in the general configuration of the Pandora FMS console, in the Remote configuration directory field.
By default, the route in which the console would synchronize the files with the server would be:
/var/spool/pandora/data_in/discovery
Within this directory, one will be created for each plugin, using their short names, and inside the plugin files that the server may need.
For example, the directory for the pandorafms.vmware application would be:
/var/spool/pandora/data_in/discovery/pandorafms.vmware
See also «.Disco development».


 Home
Home

