

 Home
Home

Alert system
Introduction
An alert is Pandora FMS's reaction to an incorrect value of a Module. This reaction is configurable and can consist of anything that can be triggered by a script configured in the Operating System where the Pandora FMS Server that processes the Module, Event, or Log is running.
In Pandora FMS, alerts work by defining triggering conditions, chosen actions for that alert, and finally the execution of commands on the Pandora FMS Server, which will be in charge of carrying out the configured actions.
There are several types of alerts:
- Simple alerts.
- Event alerts.
- SNMP trap alerts.
- Log alerts.
- Security event (SIEM) alerts.
- Inventory alerts.
Pandora FMS also has a scheduled service downtime management system in the Management → Alerts → Scheduled downtime menu. This system allows you to disable alerts during the intervals when there is a service downtime.
Alert structure
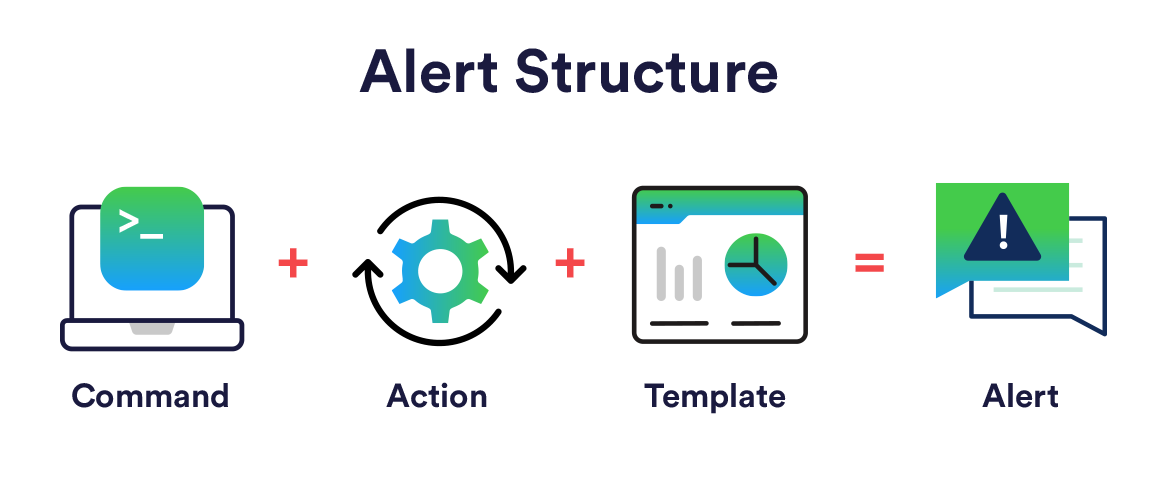
- Commands: Specify what will be done; this will be the execution carried out by the Pandora FMS Server when the alert is triggered.
- Actions: Specify how it will be done; these are the customizations of the command arguments.
- Templates: Specify when it will be done; these define the conditions to trigger the action or actions.
Information flow in the alert system
Templates and actions have a series of generic fields called
Field1 , Field2 , Field3, (…) , Fieldn
which are used to transfer information from the template to the action and from the action to the command, to finally be used as parameters in the execution of said command.
This information is transferred as long as the next step does not already have information defined in its Fieldn fields. That is, in case of overlapping fields or parameters, the action overrides the template (for instance, if the template has Field1 defined and the action does too, the action's Field1 overrides the template's action).
Alert Command
Introduction
Menu Management →  Alerts → Commands.
The actions that Pandora FMS will perform in alert situations will ultimately translate into executions on the server, in the form of commands.
To create alert commands you must log in as a PFMS superuser.
Creating a command for an alert
Menu Management → Alerts → Commands → Create +.
It is recommended to check from the command line if the command execution is successful and produces the desired result (send an email, generate a log file entry, etc.).
- Command: Command that will be executed when triggering the alert. It is possible to use macros to replace the parameters configured in the alert declaration.
- Group: This determines which alert group the command can be associated with. You can only assign a group to which the user creating the alert command belongs, unless said user explicitly belongs to the ALL group (ALL).
- Field description and Field values:
- Available field values: A collection of possible values for that field. If this field is configured (not empty), the field will be a selection list instead of a text box. Said list needs for each possible value a label (the visible option) and a value (the sent option). The syntax is as follows:
value1,label1;value2,label2;value3,label3;valueN,labelN
- Hide: If the field contains a password, enabling this option hides the content with asterisks.
- It is possible to display an HTML code editor in a command field when creating or editing an alert action if that command field has the special token
_html_editor_as its value.
It must be taken into account that alert commands executed by the Pandora FMS Server are run with the same privileges as the user who runs the Pandora FMS server.
Predefined commands
Menu Management → Alerts → Commands.
Some of the commands that come with the Pandora FMS installation:
- eMail: Sends an email from the Pandora FMS Server. Email messages are sent in HTML format. Keep in mind that the receiver must be able to access the resources used in the template, such as images.
- Internal audit: Generates an entry in the Pandora FMS internal audit system. This is stored in the Pandora FMS database and can be reviewed with the event viewer from the Web Console.
- Monitoring Event: Creates a custom event in the Pandora FMS Event Console.
- Alertlog: This is a predefined alert that writes alerts in plain ASCII format to the file \
/var/log/pandora/pandora_alert.log. - SNMP Trap: Sends a parameterized SNMP trap with the arguments used.
- Syslog: Sends an alert to the system log using the logger system command.
- Sound Alert: Plays a sound in the sound event console when an alert occurs.
- Jabber Alert: Sends a Jabber alert to a chat room on a predefined server (the
.sendxmpprcfile must be configured first). To do this, the user alias is placed infield1, the chat room name infield2, and the text message infield3. - SMS Text: Sends an SMS to a specific mobile phone. First it is necessary to define an alert and configure an SMS sending gateway that is accessible from the Pandora FMS Server.
- Validate Event: Validates all events related to a module. It will be passed the agent name and the module name.
- Remote agent control: Sends commands to agents with the UDP server enabled. The UDP server is used to order the agents (MS Windows® and UNIX®) to refresh the agent execution: that is, to force the agent to execute and send data.
- Generate Notification: Allows sending an internal notification to any user. Recipients must be added from memory and each user will delete their notification when they can and/or deem it appropriate.
- Send report by e-mail and Send report by e-mail (from template): Both options allow sending a report in different formats (PDF, JSON, CSV) by email; the second option allows using a template for said attached report.
When a public URL is set for a Web Console, the email messages sent will have this link established.
- Console notification: Allows sending a Web Console notification to any user. Available recipients will be added interactively. Notifications will appear and disappear as the corresponding alert is triggered or recovered. In addition, messages will be permanently deleted according to the token Max. days before delete old messages. Preconfigured macros will be used to show information about the agent, module, etc. You must ensure that the recipient has sufficient read rights over the alerted items.
- API request: Makes an API query using an alert action built based on this command. The following parameters will be needed, in this order:
- URL: IP address or web link to the API server where the query will be made.
- Method: Method to use, from a list of options (
GET,POST,PUT,PATCH,DELETE), similar to those used by the PFMS API (exceptPATCH). - Headers: To include request format (usually in JSON format), authorization token, etc.
- Data: The query itself and its respective parameters.
- SSL: Indicates whether an encrypted connection will be used to make the connection.
A typical request includes code similar to this:
- HEADER: \
Authorization: Bearer abc123token
Content-Type: application/json
X-Request-ID: 123456
- DATA: \
{'title': 'foo', 'body': 'bar'}
Editing a command for an alert
Menu Management → Alerts → Commands → click on the name of the command to edit.
Once the chosen alert has been modified, click on the Update button to save the changes.
The following system commands are unalterable:
eMail(Id. 1).Internal Audit(Id. 2).Monitoring Event(Id. 3).Validate Event(Id. 10).Generate Notification(Id. 13).Send report by e-mail(Id. 14).Send report by e-mail (from template)(Id. 15).Pandora ITSM Ticket(Id 16).Pandora Telegram(Id 19, save token in general setup).RMM Script(Id. 22).Console notification(Id. 23).API request(Id. 24).
Action
Introduction
Actions are the components of the alerts where a command is related to the generic variables:
Field 1, Field 2, … , Field 10.
Actions allow defining how to execute the command.
Creating an Action
Menu Management → Alerts → Actions → Create.
If an alert action based on one of the predefined alert commands is to be created, it is more practical to copy the predefined alert action and then modify it.
- Group: The action's group. You can only assign a group to which the user creating the alert command belongs, unless said user explicitly belongs to the ALL group (ALL). If the associated command has a group different from All, you can only set the action's group to the one associated with the command or the All group. If for some reason this comes to differ, a warning message will be seen for its prompt correction by a user who has the necessary rights.
- Command: Command to be used in case the alert is executed. You can choose from the different predefined commands in Pandora FMS.
- Threshold: An alert action is executed only once within this time interval, regardless of how many times the alert is triggered.
- Command Preview: In this field, which is non-editable, the command that will be executed in the system will automatically appear.
- Field 1 ~ Field 10: If necessary, these fields define the value of the macros (from
_field1_to_field10_) that will be used in the command. These fields can be a text field or a selection list, if configured as such.
When a value is assigned to the Field in the Triggering section, by default they will be the same values for Recovery, unless a different value is assigned.
Predefined alert actions
- Console notification: This command allows you to generate a notification to the supervisor when an alert is triggered. It uses the predefined
Console notificationalert command. By modifying this predefined action, you can select the users who will be notified. - Create Pandora ITSM ticket: When the integration with Pandora ITSM is enabled, incidents can be created automatically in said application.
- Mail to Admin: Uses the predefined
eMailcommand to send an email message as configured in the Destination address field. - Monitoring Event: Uses the command of the same name and you can configure the event types and severity (trigger and recovery), among other details.
- Pandora Goggle chat, Pandora ilert, Pandora MS Teams, Pandora Slack, Pandora Telegram, Pandora Vonage: Pandora FMS can send notifications, after configuration, in several instant messaging applications.
- Restart agent: Allows sending instructions (restart by default) according to the
Remote agent controlcommand to PFMS EndPoints. - Send Report by e-mail and Send Report by e-mail (from template): For sending reports by email. Here you can configure the recipients, the report itself (or template), and its format (PDF, JSON or CSV).
Editing an Action
Menu Management → Alerts → Actions → click on the name of the action to modify.
Deleting an action
Menu Management → Alerts → Actions → click on the corresponding trash can icon (Delete column).
Alert template
Introduction to alert templates
Menu Management → Alerts → Templates.
Templates define the alert trigger conditions (when to execute the action).
They are associated with Modules, in such a way that when the template conditions are met, the associated action or actions will be executed. Their design allows generating a small group of generic templates that work for most possible cases in Pandora FMS.
Creating a Template
Menu Management → Alerts → Templates → Create.
Step 1: General
- Group: The group to which the template will be applied. You can only assign a group to which the user creating the template belongs, unless said user explicitly belongs to the ALL group (ALL).
- Priority: Informational field about the alert. The event generated when triggering the alert will inherit this priority, useful for filtering in alert searches.
Step 2: Conditions
- Use special days list: Sets the special days calendar that will be used in the template.
- Time Threshold: Time that must pass to reset the alert counter. It defines the time interval in which it is guaranteed that an alert will not be triggered more times than the number set in Max. number of alerts. Once the defined interval has passed, the counter will be reset. The trigger counter reset will not restart if the alert is recovered upon receiving a correct value, unless the value Reset counter for non-sustained alerts is enabled, in which case the counter will restart immediately after receiving a correct value.
- Min number of alerts: Minimum number of times the situation defined in the template must occur (always counting from the number defined in the Module's Flip Flop parameter) to start triggering an alert. The default value is
0, which means the alert will be triggered when the first value meeting the condition arrives. It acts as a filter, useful for ignoring false positives. - Max number of alerts: Maximum number of alerts that can be sent consecutively in the same time interval (Time Threshold). It is the maximum value of the alert counter. No more alerts will arrive per time interval than those indicated in this field.
- Default Action: This list defines the default action the template will have. This is the action that will be created automatically when you assign the template to the module. You can set one action or none; however, you cannot set several default actions.
- Schedule: Sets the days on which the alert can be triggered. It is possible to view and configure when the alert will be active each day of the week thanks to the built-in editor shown by default in simple mode. Additionally, by accessing the detailed mode, schedules can be configured more precisely.
- Reset counter for non-sustained alerts: Its activation depends on the number indicated in Min. number of alerts being greater than
0. Enabling this token resets the alert counter when the indicated condition is not repeated consecutively. For example, if the Min. number of alerts field has a value of2, it means the module must pass3times through the status assigned in Condition type to trigger the alert. There are two scenarios with this last token:
- If the reset token is checked, the number of critical statuses must be consecutive, otherwise the counter will be reset:
normal → critical → critical → critical
- If the reset token is not checked, the alert will be triggered after an alternative or continuous sequence of critical statuses:
normal → critical → normal → critical → normal → critical
To periodically check modules in unknown status (Unknown status), the unknown_updates token can be enabled in the PFMS Server configuration.
- Disable event: By checking this token, the event generated in the alert trigger event view will not be created.
- Condition type: Allows specifying the element that will trigger the alert, such as being in a critical status (Critical status) or simply being different from the normal status (Not normal status). Complex alerts (Complex alerts) can also be set, for example, that the sum is exactly equal to two in the last thirty days:

Step 3: Advanced fields
- Alert recovery: List where you can define whether or not to enable alert recovery. If alert recovery is enabled, when the module stops meeting the conditions indicated by the template, the associated action will be executed with the arguments specified by the
fieldfields defined in this column. - In all instances of the
field1…field10fields (in the alert template, as well as in the command and the action), those defined in the macro list can be used.
Once the configuration is complete, finish by clicking on the Finish button.
Predefined alert templates
Templates that are created by default when PFMS is installed:
- Critical condition: Configured with a critical severity, a condition type in critical status, with the default action being sending an email message to the administrator and with alert recovery enabled.
- Manual alert: This is a template used to trigger manual alerts, the condition defined here will never be executed. This template is used to assign to the actions and commands used for remote management (EndPoint reboot, executing commands on the server, etc.).
- Warning condition: Configured with a warning severity, a condition type in warning status, with the default action being sending an email message to the administrator and with alert recovery enabled.
- Unknown condition: Configured with a warning severity, a condition type in unknown status, with the default action being sending an email message to the administrator and with alert recovery enabled.
- Default critical condition: The four previous templates can be customized; this template is read-only (system template) and is a copy of the Critical condition template. It is included this way given the importance of the critical status.
Assigning Alert Templates to modules
Alert Management from the Alerts submenu
Alert Assignment from the Alerts submenu
Menu Management → Alerts → Module Alerts → click on the pencil icon Builder alert.
- Agent: Autocomplete to choose the Agent.
- Module: List of modules of the previously selected Agent.
- Actions: Action that will be executed when the alert is triggered. If the template already has a default action, it can be left as Default.
- Template: Template that will contain the alert trigger conditions.
- Threshold: An alert action will not be executed more than once every
action_thresholdseconds, despite the number of times the alert is triggered. This threshold takes priority over the action's threshold setting.
Modifying alerts from the Alerts submenu
Once an alert has been created, it will only be possible to modify the actions that have been added to the action that the template has.
It is also possible to delete the action that was selected when the alert was created by clicking on the gray trash can icon to the right of the action, or add new actions by clicking on the + button.

As of version 781, the default action is only shown if it is the only one existing.
Managing alerts from the agent
From the agent administration section, new alerts can be added by navigating to the corresponding tab:

There you will be able to:
- View the alert in detail (Template column, magnifying glass icon
 ).
). - Edit or delete each and every action of each alert assigned to the agent (Actions column).
- From the options column (Op.):
- You can disable or enable.
- You can place the alert in standby mode.
- You can add an action.
- You can completely delete the alert (without a confirmation message).
General overview of an alert
- Define critical and warning threshold in module.
- Associate the alert to the module, to do this go to the alerts tab within the Agent where the Module is located.
If necessary, a new action and/or new template can be created; clicking on those buttons will redirect to the corresponding sections. Once the new component(s) have been created, you must return to the previous step.
- With the Add alert button, the new alert is saved.
- Alert scaling: Alert scaling involves additional actions that are executed if the alert is repeated a certain number of times consecutively.
- You only need to add the additional actions and determine between which consecutive repetitions (Number of matching alerts) of the alert this action will be executed.
- When an alert recovers, all the actions that have been executed up to that point will be executed again, not just those corresponding to the current Number of alerts match from configuration.
- Additionally, a Threshold can be set as a second parameter, whereby an alert cannot be triggered more than once during said interval.
Finally, sending alert messages via instant messaging such as Telegram or any other available ones can be configured.
Standby Alerts
Alerts can be enabled or disabled or in standby mode (standby).
The difference between those in standby and disabled alerts is that the disabled ones simply will not work and therefore will not be displayed in the alert view.
On the other hand, alerts in standby will be displayed in the alert view and will work only at the display level. That is, they will show whether they are triggered or not but they will not perform the programmed actions or generate events.
Standby alerts are useful so you can view them without them interfering with or hindering other aspects.
Cascade protection
Cascade protection is a Pandora FMS feature that allows avoiding a massive bombardment of alerts when a group of Agents is unreachable due to a main connection failing.
These types of things happen like when an intermediate network element such as a router or a switch fails, and makes a large part of the network managed with Pandora FMS inaccessible. Because network checks would fail in this scenario, alerts for downed devices would start triggering without it being true.
For the agent to work with cascade protection enabled, it must have the parent Agent correctly configured (Advanced options, Parent token), on which it depends.
If the parent Agent currently has any Module alert in a critical status triggered, the lower agent with cascade protection will only execute its module alerts in warning or unknown status.
Cascade protection is activated from the Setup  of each Agent, Advanced options section, clicking on the Cascade protection modules and/or Cascade protection services option.
Service-based cascade protection
Cascade protection based on services prevents elements of a service from triggering their alerts if the alert of the service they belong to is triggered.
To enable this feature, the Cascade protection services token must be activated in the advanced configuration of the agents that require this behavior, and activate the Cascade protection enabled token in the service configuration to which these agents belong.
When the service alert is triggered, information about which service elements are critical can be sent in the alert with the _rca_ macro, which will indicate the root cause of the service status.
Module-based cascade protection
The status of a parent Agent's Module can be used to prevent alerts from the child Agent from being sent if it goes into a critical status (only the Hierarchy & behavior box is displayed):

Safe operation mode
Safe operation mode can be enabled in the advanced configuration options of an Agent.

If the status of the selected Module changes to critical, the rest of the Agent's Modules are disabled until it returns to normal or warning again. This allows disabling remote Modules if connectivity is lost, among other uses.
Custom module alert macros
These specific macros can be added by expanding the macro section of any module.

- They are defined in the Module.
- They store the data in the database.
- They can have any name, for example
_myMacro. - They are not reflected in the local configuration (
.conf). - They are used exclusively for alerts.
- They cannot be defined at the component level.
- They can be defined in monitoring policies.
- The established values can be used as part of the fields in the definition of alerts.
Email configuration for alerts in Pandora FMS
Pandora FMS alone has the ability to send emails as explained in the general Console configuration. However, its flexibility allows sending emails with different email platforms. Once both mechanisms have been established, you can configure the sending action and create its alert.
Event alerts
Menu Management → Alerts → Event Alerts.
Alerts can be built based on the received events. These alerts can be simple or complex, based on a set of rules with logical relationships.
This type of alert allows working from a much more flexible perspective, since alerts are not generated based on the status of a specific Module, but rather on an event that may have been generated by several different Modules and even from different Agents.
When defining alerts on events, it is essential to indicate the agent, module, and event parameters.
In Command Center environments, event alerts are not centralized. Each node must have its event rules configured since the rules configured in the Command Center will only trigger the alerts of the Command Center's own events.
Each event alert is configured to trigger on a certain type of event; when the logical equation defined by the rules and their operators is met, the alert will be triggered.
Given the high number of events that the Pandora FMS database can hold, the server works on a maximum event window, parameter event_window, which is defined in the pandora_server.conf configuration file. Events generated outside this time window will not be processed by the server.
Creating event alerts
If the Event Server is disabled, it must be enabled with the eventserver 1 parameter in the PFMS Server configuration file or use the Web Console's remote server administration.
Menu Management → Alerts → Event Alerts.
With the Create button, a new event alert is added and the process is similar to creating an alert template.
There are five steps for completely creating an event alert, some important aspects are:
- Step 1, Configure: Contains basic data such as name, agent group to which the event alert will belong, and its severity.
- Step 2, Conditions: Step where an alert template, a special days list, the Disable event option (the event generated in the alert trigger event view will not be created if this token is checked), and a rule evaluation mode will be assigned:
When two or more event alerts exist, they are evaluated one by one following the chronological order of creation and, if necessary, establishing a hierarchy.
Each event alert has two specific configuration parameters for this:
- Rule evaluation mode: Can be Pass or Drop. The first means that, if an event complies with the rules of an alert, the rest of the alerts continue to be evaluated afterwards. This is the default behavior. Drop, otherwise, means that when an event complies with an alert, the rest of the alerts stop being evaluated.
- Grouped by: Allows grouping the rules by Agent, Group, Module, or Module alert. Thus, if a rule is configured to trigger when two critical events are received and is grouped by Agent, two critical events from the same Agent must arrive.
- Step 3, Rules: Rules within an event alert.
- Step 4, Fields: Fields within an event alert
- Step 5, Triggering: Triggering within an event alert.
Upon completing the creation and returning to the global view, you will have the list of registered event alerts and information about them, as well as options over them (operate with the action disabled, in standby mode, add more actions, edit or delete the corresponding event alert). You will also be able to change the order between the different event alerts.
Rules within an event alert
Event alerts are based on filtering rules that employ the following logical operators:
and | nand |
or | nor |
xor | nxor |
These logical operators are used to search for events and/or expressions that match the configured filtering rules, and if matches are found, the alert will be triggered.
To define the alerting rules, it will be necessary to drag the elements from the left side (Available items) to the right side (Rule definition) to build each rule:

Changes will only be saved when you press the Next button to advance to the next step.
These elements will be enabled to guide the user in complying with the rule's grammar. Below is a simplified explanation of the grammar to use:
S → R | R + NEXO +R
R → FIELD + OPERATOR + C | FIELD + OPERATOR + C + MODIFIER
C → VARIABLE
Where S is the set of rules defined for the event alert.
The blocks have simultaneity when fulfilling the condition, with A and B each being a rule:
(A and B)
Forces the analyzed item (event) to simultaneously comply with A and B.
A and B
Forces both rules (A) and (B) to be met within the evaluation window. This means there must be entries that satisfy both rules in the last few seconds (defined by the
parameter event_window).
In the == and != comparison operators, text strings are literally compared. For greater flexibility, consider using the REGEX operator which employs Regular Expressions.
Fields within an event alert
Field2 , Field3, (…) , Fieldn must be configured, which are used to transfer information from the template to the action and from the action to the command, to finally be used as parameters in the execution of said command.
This information is transferred as long as the next step does not already have information defined in its Fieldn fields. That is, in case of overlapping fields or parameters, the action overrides the template (for example, if the template has Field1 defined and the action does too, the action's Field1 overrides the template's action).
Version 764 or later: Macros related to modules and agents are not available in the fields of the Alert recovery section since the recovery of these alerts is executed when the threshold ends and lacks a recovery event to obtain said information.
Triggering within an event alert
In this section, you must configure the actions to be performed when the alert is triggered and indicate at what intervals and how often said action or actions will be executed.
- Actions: Action that needs to be executed.
- Threshold: Time interval that must pass for the action to be executed again once the alarm is triggered.
Once the previous parameters are selected, press the Add button and then you can choose and view the list of configured actions (Select the desired action and mode to view the Triggering fields for this action section).
Information about the last alert triggered will be presented according to how it is configured (Timestamp, time comparison, or compact mode).
Macros for event alert
The macros that can be used within the configuration of an event alert are in the macro list.
Log alerts
Menu Management → Alerts → Log Alerts.
Alerts can be built based on the received logs. These alerts can be simple or complex, based on a set of rules with logical relationships.
This type of alert allows working from a much more flexible perspective, since alerts are not generated based on the status of a specific Module, but rather on a log that may have been generated by several different Modules and even from different Agents.
Each log alert is configured to trigger on a certain type of event; when the logical equation defined by the rules and their operators is met, the alert will be executed.
Given the high number of logs that can be held in Pandora FMS, the server works on a maximum event window, parameter log_window, which is defined in the pandora_server.conf configuration file. Logs generated outside this time window will not be processed by the server.
Creating log alerts
For log alerts to work, the Log Server must be enabled via the parameter logserver 1 in the Pandora FMS Server configuration file.
It is recommended to change this value through the remote configuration graphical interface.
Then the Log collector must be activated in the menu:
Management →  Settings → System Settings → Log collector → Activate Log Collector.
Menu Management → Alerts → Log Alerts.
With the Create button, a new log alert is added and the process is similar to creating an alert template.
There are five steps for completely creating a log alert, some important aspects are:
- Step 1, Configure: Contains basic data such as the agent group to which the log alert will belong, name of the alert, and its severity.
- Step 2, Conditions: Step where an alert template, a special days list, the Disable event option (the event generated in the alert trigger event view will not be created if this token is checked) and a rule evaluation mode will be assigned:
When two or more log alerts exist, they are evaluated one by one following the chronological order of creation and, if necessary, establishing a hierarchy.
Each log alert has two specific configuration parameters for this:
- Rule evaluation mode: Choosing Pass means that, if a log complies with the rules of an alert, the rest of the log alerts continue to be evaluated afterwards. This is the default behavior. In the case of choosing Drop, when a log complies with an alert, the rest of the log alerts will stop being evaluated.
- Grouped by: Allows grouping the rules by Agent, Group, Module, or Module alert. Thus, if a rule is configured to trigger when two critical events are received and is grouped by Agent, two critical events from the same Agent must arrive.
In alerts containing log rules, this will only affect grouping by Agent. If you choose a different grouping, alerts based on log entries will never be met.
- Step 3, Rules: Rules within a log alert.
- Step 4, Fields: Fields within a log alert
- Step 5, Triggering: Triggering within a log alert.
Upon completing the creation and returning to the global view, you will have the list of registered log alerts and information about them, as well as options over them (operate with the action disabled, in standby mode, add more actions, edit or delete the corresponding log alert). You will also be able to change the order between the different log alerts.
Rules within a log alert
Log alerts are based on filtering rules that employ the following logical operators:
and | or | xor |
nand | nor | nxor |
These logical operators are used to search for logs and/or expressions that match the configured filtering rules, and if matches are found, the alert will be triggered.
To define the alerting rules, it will be necessary to drag the elements from the left side to the right side to build each rule.
Changes will only be saved when you press the button to advance to the next step (Next button).
A predefined log alert rule is shown (Kernel Panic):

Below is a simplified explanation of the grammar to use:
S → R | R + NEXO +R
R → FIELD + OPERATOR + C | FIELD + OPERATOR + C + MODIFIER
C → VARIABLE
Where S is the set of rules defined for the log alert.
The blocks have simultaneity when fulfilling the condition, with rules B and A each being:
Forces the analyzed item (log) to simultaneously comply with B and A:
(B and A)
Forces both rules (B) and (A) to be met within the evaluation window (this means there must be entries that satisfy both rules in the last few seconds and this is defined
by the parameter log_window):
B and A
In the != and == comparison operators, text strings are literally compared. For greater flexibility, consider using the REGEX operator, which uses Regular Expressions.
Fields within a log alert
Field2 , Field3, (…) , Fieldn must be configured, which are used to transfer information from the template to the action and from the action to the command, to finally be used as parameters in the execution of said command.
This information is transferred as long as the next step does not already have information defined in its Fieldn fields. \ That is, in case of overlapping fields or parameters, the action overrides the template (for example, if the template has Field1 defined and the action does too, the action's Field1 overrides the template's action).
Version 764 or later: Macros related to modules and agents are not available in the fields of the Alert recovery section since the recovery of these alerts is executed when the threshold ends and lacks a recovery event to obtain said information.
Triggering within a log alert
Here you must configure the actions to be performed when the log alert is triggered and indicate at what intervals and how often said action will be executed.
- Actions: The action that needs to be executed.
- Threshold: Time interval that must pass for the action to be executed again once the log alarm is triggered.
Once the previous parameters are selected, press the Add button and then you can choose and view the list of configured actions (Select the desired action and mode to view the Triggering fields for this action section).
Information about the last alert triggered will be presented according to how it is configured (Timestamp, time comparison, or compact mode).
Macros for event alert
The macros that can be used within the configuration of an event alert are in the macro list.
SIEM alerts
These alerts are evaluated by the SIEM event server at the time of their generation, so for their correct operation, SIEM monitoring must be enabled and configured.

SIEM alert management
Menu Management → Alerts → SIEM Alerts.
In this section, it is possible to create, edit, and delete SIEM alerts. The LW permission is necessary to access this section.
These alerts are based on the SIEM event views filter system, so that any event that was shown with the configured filter conditions will be the ones that trigger the alert.
For example, if a SIEM alert is configured with a critical event filter, right before the SIEM event server generates one with that condition, the alert will be triggered.
SIEM alerts, like the rest of the alerts, have global configuration options for their triggering.
SIEM alert operation
Menu Operation →  SIEM → Alerts.
In this section, it is possible to view, enable/disable, and change the standby mode of the SIEM alerts available in the environment.
The LM permission is required to access this section.
Macro list
Command macros, Action macros, and Event alert macros are common among themselves with some exceptions specified in each description:
| Macro | Description |
|---|---|
_address_ | IP address of the Agent that triggered the alert. |
_addressn_n_ | The IP address of the Agent that corresponds to the position indicated in n: addressn_1_ , addressn_2_, … |
_agent_ | Alias of the Agent that triggered the alert. If it does not have an assigned alias, the Agent name is used. |
_agentalias_ | Alias of the Agent that triggered the alert. |
_agentcustomfield_n_ | Agent custom field number n: _agentcustomfield_9_. |
_agentcustomid_ | Custom identifier of the Agent. |
_agentdescription_ | Description of the Agent that triggered the alert. |
_agentgroup_ | Agent group name. |
_agentname_ | Name of the Agent that triggered the alert. |
_agentos_ | Agent operating system. |
_agentstatus_ | Current status of the Agent. |
_alert_critical_instructions_ | Instructions contained in the Module for a critical status. |
_alert_description_ | Alert description. |
_alert_name_ | Alert name. |
_alert_priority_ | Numeric priority of the alert. |
_alert_text_severity_ | Text priority of the alert (Maintenance, Informational, Normal, Minor, Warning, Major, Critical). |
_alert_threshold_ | Alert threshold. |
_alert_times_fired_ | Number of times the alert has been triggered. |
_alert_unknown_instructions_ | Instructions contained in the Module for an unknown status. |
_alert_warning_instructions_ | Instructions contained in the Module for a warning status. |
_all_address_ | All addresses of the Agent that triggered the alert. |
| Macro | Description |
|---|---|
_critical_threshold_min_ | Minimum critical threshold. |
_critical_threshold_max_ | Maximum critical threshold. |
| Macro | Description |
|---|---|
_data_ | Data that caused the alert to trigger. If a module uses a Data translation, this macro will return the translated value. |
_dataunit_ | Shows the unit type specified in the Unit field (located in the Advanced options section of an agent's module). |
_discovery_task_ | Allows obtaining the name of the Discovery task that failed. |
| Macro | Description |
|---|---|
_email_tag_ | Email mailboxes associated with the Module tags. |
_event_cf_text_ | Only for event alerts: Outputs all custom data information in text mode (with line breaks). |
_event_cf_json_ | Only for event alerts: Outputs the custom data information in JSON format. |
_event_cfX_ | Only for event alerts: Custom field key ( X) of the event that triggered the alert. Thus, if there is a custom field whose key is IPAM, its value can be obtained using the macro _event_cfIPAM_. |
_event_description_ | Only for event alerts: Textual description of the Pandora FMS event. |
_event_extra_id_ | Only for event alerts: Extra identifier. |
_event_id_ | Only for event alerts: Identifier of the event that triggered the alert. |
_event_text_severity_ | Only for event alerts: Text priority of the event that triggers the alert (Maintenance, Informational, Normal Minor, Warning, Major, Critical). |
_eventTimestamp_ | Timestamp when the event was created. |
| Macro | Description |
|---|---|
_fieldX_ | Field X defined by the user. |
| Macro | Description |
|---|---|
_group_contact_ | Group contact information. It is configured when creating the group. |
_groupcustomid_ | Custom identifier of the group. |
_groupother_ | Other information about the group. It is configured when creating the group. |
| Macro | Description |
|---|---|
_homeurl_ | It is a link of the public URL that must be configured in the general configuration options. |
| Macro | Description |
|---|---|
_id_agent_ | Agent identifier, useful for building an access URL to the Pandora FMS Web Console. |
_id_alert_ | Alert identifier, useful for correlating the alert in third-party tools. |
_id_group_ | Agent group identifier. |
_id_module_ | Module identifier. |
_interval_ | Module execution interval. |
| Macro | Description |
|---|---|
_lastdatatimestamp_ | Last check date and time received by a module (useful for alerts passing to unknown). |
_lastdatatime_ | Last check date and time received (in Unix time format) by a module (useful for alerts passing to unknown). |
_logTimestamp_ | Timestamp when the log was created. |
_logSource_ | Source of the log that triggered the alert. |
| Macro | Description |
|---|---|
_module_ | Module name. |
_modulecustomid_ | Custom identifier of the Module. |
_moduledata_X_ | With this macro (X is the name of the Module in question), it is possible to retrieve the latest data from the Module. If it is numeric, it returns it formatted with the decimals specified in the Web Console configuration and with its unit (if it has one). This way, additional (and perhaps highly relevant) information from other modules of the same Agent can be sent.
If |
_moduledescription_ | Module description. |
_modulegraph_nh_ | Only for alerts that use the eMail command: Returns a base64 encoded image of a Module graph with a period of n hours. Requires correct configuration of the server connection to the console via API, which is done in the server configuration file. |
_modulegraphth_nh_ | Only for alerts that use the _email_tag_ command: Same operation as the _modulegraph_nh_ macro with the difference that it includes the Module's critical and warning thresholds, in case they are defined. |
_modulegroup_ | Module group name. |
_modulestatus_ | Module status. |
_modulelaststatuschange_ | Only for command Macros: Timestamp in which the Module's last status change occurred. |
_modulelaststatustime_ | Only for command Macros: Date and time in which the Module's last status change occurred. |
_moduletags_ | The URLs associated with the module tags. |
| Macro | Description |
|---|---|
_name_tag_ | Name of the tags associated with the Module. |
| Macro | Description |
|---|---|
_phone_tag_ | Telephones associated with the module tags. |
_plugin_parameters_ | Can be inserted both in the subject and the body of an alert's email notification. Once there, it will be replaced (in JSON format) by the values found in tagent_modulo.macros for the plugin in question. |
_policy_ | Name of the policy to which the Module belongs (if applicable). |
_prevdata_ | Previous data before the alert triggered (review note about this). |
| Macro | Description |
|---|---|
_rca_ | Root cause analysis string (only for Services). |
| Macro | Description |
|---|---|
_secondarygroups_ | Only for command macros and action macros: Shows the Agent's secondary groups. |
_server_ip_ | IP address of the server to which the Agent is assigned. |
_server_name_ | Name of the server to which the Agent is assigned. |
_statusimagetag_ | Macro used in alert actions with email notifications to visually indicate the status at the time of sending. Generates an HTML element of type img. |
| Macro | Description |
|---|---|
_target_ip_ | IP address of the Module's target. |
_target_port_ | Port of the Module's target. |
_telegramtoken_ | It is replaced by the token configured in Management → Settings → System settings → General setup → Alerts configuration → Telegram configuration. |
_timestamp_ | Time and date when the alert was triggered. |
_time_down_human_ | This macro only works for recovery alerts: Downtime or offline time in long format, such as: “1day 10h 35m 40s”. |
_time_down_seconds_ | This macro only works for recovery alerts: Downtime, or offline time, in seconds. |
_timezone_ | Time zone represented in _timestamp_. |
| Macro | Description |
|---|---|
_warning_threshold_max_ | Maximum warning threshold. |
_warning_threshold_min_ | Minimum warning threshold. |
Note:
For the _prevdata_ macro it is necessary to uncomment the following section in the Pandora FMS server configuration file:

The server process must be restarted for the new changes to be applied.


