Architecture

Pandora FMS Architecture

This chapter provides a general description of Pandora FMS and its components, the way they relate to each other and how to use the Pandora FMS architecture to meet different challenges regarding the topology of its infrastructure.

Pandora FMS can be modular and decentralized or simple and monolithic. The most vital component is the MySQL database, where all the information is stored. Each component of Pandora FMS can be replicated and works in a full HA environment, be it passive, active or in a clustered environment (Active/Active with load balancing).

Pandora FMS' Architecture

Pandora FMS consists of several elements, among them, the ones that are in charge of collecting and processing the data, which are the servers. The servers, with the information generated by themselves or by the agents, enter the data into the database. The console is the part in charge of displaying the data present in the database and interacting with the end user. Software agents are applications that run on monitored systems, and collect the information to send it to Pandora FMS servers.

Pandora FMS Servers

Under Pandora FMS, there are twelve different servers in total, specialized in and responsible for the various tasks necessary to make Pandora what it is today. The servers are integrated into a single application under the general name of 'Pandora Server' which is a multi-threaded application (multi-processing) that executes in sub-processes (threads) each one being different to the instances or to the specialized servers of Pandora FMS. More information can be found in the video tutorial «Server monitoring software». Hereon there is a description of the different Pandora FMS specialized servers.

Pandora FMS servers are the elements in charge of performing the appropriate checks. They verify them and change their status according to their results. They are also responsible for triggering the alerts that are set to monitor the data status.

The Pandora FMS Data Server can work with high availability and / or load balancing. In a very large architecture, it is possible to employ several servers simultaneously to handle large volumes of information, and may be distributed by geographic or functional zones.

Pandora FMS servers are always working and verifying if any monitored elements are experiencing any difficulties and can take appropriate action(s) if those are defined as alerts. When faced with a problem, it executes the response defined in the alert, such as sending an SMS, an email or activating the execution of a script.

There may be simultaneous servers, one of them being a main server and the rest of the servers being slaves. Even though there is a master and a slave server relationship, they work simultaneously. The difference between the two is that when a server of the same type is down (e. g. a network server) the master server is in charge of processing all the data associated with the server that is down.

The server receiving the data file from the agent, or processing the information (if this is of the remote type) is the one which fires the associated alerts after the data is processed.

Pandora FMS automatically manages each server's status, load levels and other parameters. The user can monitor the state of each server through the server status section of the web console.

Enterprise version.The Web User Experience Server (WUX), the Export server, the Inventory server, the Transaction server, the Syslog server, the Event correlation server, the Enterprise Network servers and certain features of the Prediction server are only available in the Enterprise version of Pandora FMS.

The Data Server

It processes the information sent by software agents. The software agents collect information locally from the systems on which they are installed and build an information packet in XML format. These XML packets are sent to the server. They are received in a specific directory on the server, the server processes all the files coming to this input directory and stores the information in the database.

Different data servers can be installed on different systems or on the same host by means of virtual servers. Several servers can work together for very large environments that need to make better use of hardware (e. g. in multi-CPU environments).

Despite its simplicity and scarce use of resources, the data server is one of the critical elements of the system, since it processes all agent information and generates alerts and system events according to those data. The data server only works with the XML data from the software agents and does not perform any kind of remote verification.

The Network Server

It executes remote monitoring tasks through the network: ICMP checks (ping, latency time), TCP requests and SNMP requests. When an agent is assigned to a server, the network server that will run the checks for that agent is specified.

It is very important that the machines running the network servers have “network visibility” in order to be able to execute the network monitoring tasks they have been assigned. That is, if you ping systems on a particular network, the network server can reach said network.

For example, if a module is created to perform a ping check at 192.168.1.1 and this agent/module is assigned to a server on a 192.168.2.0/24 network without 192.168.1.0/24 network access, it will always return DOWN as it cannot contact it.

The SNMP Console

The SNMP Server, also called SNMP trap console, uses the standard daemon of the trap collection system called snmptrapd. This daemon receives SNMP traps and the Pandora FMS Server processes and stores them in the database. It can also trigger the defined alerts linked to SNMP traps.

The WMI Server

WMI is a Microsoft® standard to obtain information from a Windows-based operating system and Microsoft Windows® environmental applications. Pandora FMS has a server devoted to remotely monitor Windows® systems through WMI protocol.

The Recon Server

Recon server was the former name for Discovery server, which is used to explore the network regularly and detect new systems in operation. Discovery Server is also able to assign a monitoring template to recently detected systems and to apply the modules automatically by default, as defined by that template, so they can immediately be used to monitor the new system. Discovery is also capable of identifying Operating Systems using system application such as nmap, xprobe and traceroute and establish network topology based in the systems it already knows.

The Discovery server is also used to launch scheduled tasks, and launch specific monitoring against virtual environments, cloud, databases or all those applications or environments that require exploring what exists before starting to monitor it.

The Plugin Server

The Plugin Server runs complex checks remotely using custom scripts. They may be developed in any language and integrated in Pandora FMS interface, being managed centrally. This allows an advanced user to define their own complex tests, developed by themselves, and integrate them in the application so that they can be used in a simple and centralized way from Pandora FMS.

The Prediction Server

Versión Enterprise.

The Prediction Server is a small component of artificial intelligence that implements a statistically predicted data set which is based on past data with a scope of up to 30 days in four temporal references. This allows us to predict the value of a data item in 10 to 15 minute intervals and know whether a particular data set presents an anomaly regarding its history. You will basically have to build a weekly dynamic baseline.

This server also manages calculating service monitoring (BPM) from Pandora FMS version 5.0. onwards.

The web server (Goliat)

The Web check Server is used to do load tests. It carries out full web tests, from the user identifying process, parameter forwarding by form or content check to menu navigation, etc. It is used for availability checks (it works, it does not) and to obtain latency times (in seconds) of navigation full experience, including resources linked to the website (images, full texts, etc.).

The Export Server

Pandora FMS Export Server allows to transfer data from the monitored device of a Pandora FMS installation to another, making it possible to replicate any data. This is particularly useful for large deployments with several Pandora FMS installations, for example, if we want to have some critical information centralized in only one of them.

The Inventory Server

The Inventory Server obtains and displays inventory information on the systems: installed software, hardware, memory, hard disks, services running on the system, etc. It can obtain this information both locally and remotely from the software agents.

The Event Correlation Server

The Event Correlation Server can be used to correlate events and generate alerts. This is a special server that does not monitor, and like the others, it can be specified in the configuration for its startup. Compared to the rest, this server does not make use of thread configuration or high availability.

The Enterprise Network Server for SNMP and ICMP

They are two additional servers using advanced strategies to process ICMP (ping) and SNMP (polling) checks in a way that offers superior performance to that of the open-source version, in exchange for some delicate criteria (especially SNMP) as they work with OIDs previously validated by the open server.

Satellite server

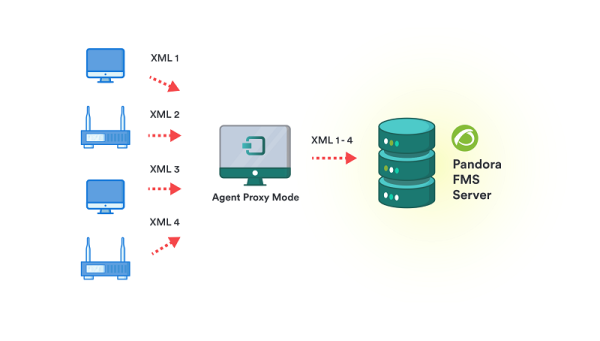
This component is installed separately in Pandora FMS main server. It allows to explore and detect new systems, remotely monitor with high speed ICMP and SNMP, and it executes remote plugins and allows forwarding data files from software agents to the main server, acting as agent proxy. It sends monitoring data as XMLs over a tentacle connection, so no database connection is required.

You can read more about this in the specific section about Distributed monitoring with Satellite server

WUX server

It is a server, which combined with the Selenium Grid, allows complex WEB transactions to be carried out in a distributed manner. It differs from simple WEB checks (Goliat) in that these transactions are executed in a real browser, and their output is captured and processed to display it step by step, including error screenshots, as well as detailed statistics of all WEB requests.

Syslog server

Versión Enterprise.

Log serverThis component allows Pandora FMS to analyze the syslog of the machine where it is located, analyzing its contenta and storing the references in the corresponding ElasticSearch server.

The main advantage of Syslog server consists in complementing log unification. Supported by the Syslog server export features in Linux® and Unix® environments, it allows to check logs regardless or their source, searching in a single common point (Pandora FMS console log viewer).

Transactional server

Version NG 767 or earlier.

Versión Enterprise.

Transactional serverPandora FMS incorporates from version 7 the possibility of monitoring business processes. The component of the Transactional server implemented in this version allows executing tasks that depend on other tasks following a design defined by the user. This means it is possible to coordinate different executions to check a target at a certain time.

The Pandora FMS Console

This is the Pandora FMS User Interface. This administration and operation console allows users with different privileges to control the status of the agents, see statistical information, generate graphics and data tables, as well as managing incidences with its integrated system. It is also capable of producing reports and defining new modules, agents and alerts as well as creating other user profiles in a centralized way.

The web console is programmed in PHP and does not require any additional software to be installed by the end user. It can be accessed from any modern platform that supports HTML and CSS. Firefox® 2.x or Chrome® is recommended. The user experience with browsers such as Internet Explorer® 6 is very poor, and essential console features may be lost.

In the meantime, the network console is able run on multiple servers. This means you may add as many web consoles as you want, either for load distribution or to make access due to logistical problems easier (large networks, several groups with different users, geographical and administrative differences, etc.). Its only requirement is to be able to access the data container where Pandora FMS stores everything: the database, and in the case of the Enterprise version, to access the agent configuration repository in a synchronized way (via NFS).

Pandora FMS Database

Pandora FMS uses a MySQL database where it stores all the information received in real time, normalizing all the data coming from the different source sources. It conforms the most important and critical component of any Pandora FMS installation, containing not only the information and historical data, but all the configurations made over time. Currently, only MySQL/MariaDB/Percona are supported.

These data are managed automatically from Pandora FMS, carrying out periodical and automatic database maintenance, not being necessary any kind of database administration task nor manual process assisted by an operator or administrator. This is done by periodically purging the data on a due date.

Pandora FMS software agents

When we refer to an agent in Pandora FMS, it is important to distinguish between two concepts:

  • The Agent, or agent in console, as container.
  • The Software Agent, as software that runs on a computer.

The Agent (container)

The Pandora FMS agent itself is basically an organizational element, created with Pandora FMS Web Console and associated to a group of modules (seen as individual monitoring elements). This agent can also (optionally) have one or more IP addresses associated to it.

The agent can have associated remote modules, which would have been obtained by network servers, WMI, plugins, etc.

  • Verification of whether the engine is connected or on line (PING).
  • Verification of whether a given port is opened or closed.
  • Verification of whether a network entity, hosted on a specific port of the hardware, is responding correctly.
  • Verification of whether a network entity, hosted on a specific point of the hardware, has the desired content.
  • Hardware verification(s) by SNMP (ascertaining the MIB).
  • Latency time verification between the node and Pandora FMS servers.

The agent can also have local type modules associated to it. Local modules are those defined in the software agent's configuration, which are also required to be defined within the network console's agent. When a data packet arrives for the first time from a software agent, the new agent will be created automatically, with its group of modules executed locally in the web console.

Therefore, an Agent may contain modules of both remote and local types. Remote-type modules are executed by the servers obtaining information remotely (network server, recon server…) and local modules are obtained and processed by the Data Server.

The Software Agent

The software agents are installed on computers to be monitored locally, retrieving the information from the computer itself. They are mainly used in servers for monitoring machine resources (CPU, RAM, disks…) and installed applications (MySQL, Apache, JBoss…). Generally speaking, server and equipment monitoring will be carried out with software agents, while network equipment monitoring will be done remotely without any software installation.

Each software agent performs several checks, called modules that correspond to a specific data, such as CPU usage. All the information of the checks carried out is presented in a single data file in XML format that is sent to Pandora FMS server.

The process of copying the data packet from the agent to the server is done regularly (Synchronous) every so often. This interval is defined in the software agent, which is the one that starts communications with the server.

The default interval is 300 seconds. Values lower than 100 (seconds) are not generally recommended, as they can negatively affect the host-system's performance, in addition to overloading the database and the Pandora FMS server itself.

It is important to remember that Pandora FMS is not a real time system, but a general monitoring system for systems and applications in environments where real time is not a critical factor. It may be adapted to operate in environments with response times of 3 to 5 seconds.

Illustration: Logical diagram of an agent and a physical agent.

XML packet transfers are conducted by the Tentacle Protocol, but they can also be transferred using SSH or FTP.

With either SSH or Tentacle, the process can be made secure, since passwords do not go through the network nor do they contain unencrypted confidential data, assuring the confidentiality, integrity and authentication of the connections between agent and server. The key-generating process for automatic transfer through SCP (SSH) and through Tentacle protocol is further explained in the documentation about agent and server installation and setup.

The transfer may also be done through FTP or any other file transfer protocols. However, Tentacle protocol has been chosen due to its security, user friendliness and its multiple options.

Check the documentation annex regarding configuration of other transfer protocols.

Pandora FMS agents are designed to be executed from the system they collect the data from, although the agents can also collect information stored in accessible engines from the host they are installed on by executing network commands.

The XML Data File

This data file contains an XML structure and its name is formed by combining the hostname of the host where the agent is located, a different serial number for each data packet and the .data extension indicating that it is a data packet.

<host number>.<serial number>.data

The .data file is the file that holds the data. The verification file with the .checksum extension contains an MD5 hash of the data file. This allows to perform a final verification to ensure the data have not been altered in any way before being processed.

<host number>.<serial number>.checksum

The XML data file contains all the information collected by the Agent during its execution. This data packet has a compact, flexible and light design that allows any user to use Pandora FMS agents or his own developments to generate information and for it be processed in Pandora FMS. The data file is an XML similar to the following:

<agent_data os_name="SunOS" os_version="5.8" timestamp="300" agent_name="pdges01" version="1.0">
   <module>
     <name>FTP Daemon</name>
     <type>generic_proc</type>
     <data>0</data>
   </module>
   <module>
     <name>DiskFree</name>
     <type>generic_data</type>
     <data>5200000</data>
   </module>
   <module>
     <name>UsersConnected</name>
     <type>generic_data_inc</type>
     <data>119</data>
   </module>
   <module>
     <name>LastLogin</name>
     <type>generic_data_string</type>
     <data>slerena</data>
   </module>
</agent_data>

Topologies, diagrams and monitoring models

There are different models to address the monitoring process, both local and remote. The following common examples of different topologies may help the reader to become familiar with the possible problems and the solutions Pandora FMS offers. Each of these solutions is described in the chapters below.

Accessible Networks

This is quite usual in small, simple networks but also in very centralized and well organized ones. This one is the easiest model to implement.

  • Network access for centralized remote monitoring. It implies that all machines can be accessed from Pandora FMS to probe them remotely.
  • Network access for agent based monitoring. In this network, Pandora FMS server can be reached from the software agents installed on monitored machines.

Limited-Access Networks

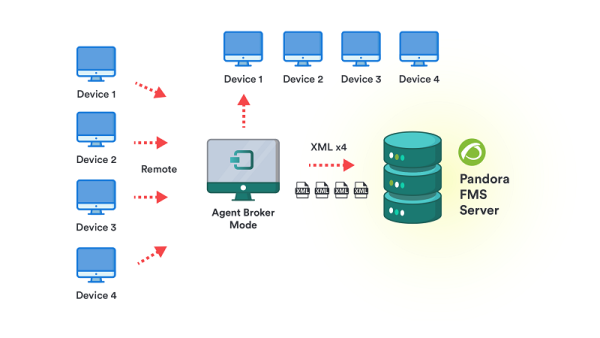
  • Network not reachable through remote Pandora FMS checks: Here you have several options. First, using a software agent to execute remote checks to other systems (using the broker agent mode) or by using the Satellite server, which is capable of executing remote checks and has a series of advanced features.

  • Software agents without access to a Pandora FMS Server: In this case, the proxy characteristics of the software agents are used, allowing those agents without direct access to use another agent with direct access for the connection, forwarding the XML files of all agents apart of their own. The Satellite Server can also work as a proxy agent.

  • The need to monitor different networks for remote monitoring with the server: In this case, make use of the Satellite server, or connect several different Pandora FMS servers to the same database, one server will run a set of checks, and another server another different set. The way to perform the deployment will be different, but in both cases, each component will be fully responsible for your network monitoring and management will be centralized from the Console.

Special Organizational Characteristics

  • The need to have several sites monitored, with different monitoring equipment and configurations. In this case, the Export Server to duplicate part of the monitoring in a segregated Pandora FMS environment, which is independent.

Hierarchical export model along with an Export Server

  • Reporting duality: Additionally, you may configure agents to report to two different Pandora FMS servers, although they can only be managed by one of them.
  • Fragmented management: It is pretty useful if you are required to delegate the administration of part of the equipment to different personnel with different access levels. This is more of a management issue rather than an architectural problem. It can be solved by the assigned permissions on policies.

Large Environments

  • Large-Volume Network, consisting of thousands of network testing processes which must be distributed in different 'remote monitoring probes'. Given their large numbers (over 50,000), they cannot be centralized into a single server. To that end, use servers in broker mode that distribute the remote check load.

  • The need to install a server on HA: for security reasons, in case primary hardware fails. You will see how to mount two servers, one “passive”, waiting for the active to stop responding and start up. There are different ways to do this.
  • The need to monitor a large volume of systems and manage them in a centralized way (more than 2500 agents). In order to do so, different Pandora FMS Servers are configured to be coordinated by the system called Metaconsole'. They can be linearly scaled in this way.