Report Types
Graphs
Simple graph
Shows the simple graph of a Module.
- Label: Label that can be assigned to the element. The same macros indicated can be used for Name.
- Time lapse: Time interval over which the report will be calculated (from the present moment).
- Agent: The control to choose the Agent for this item, type the first letters of the name and you will get a drop-down list.
- Module: Drop-down list that is loaded dynamically with the Modules of the Agent selected in the previous control.
- Graph render: Render in graph with options for Avg only, Max only, Min only, Avg, max & min.
- Full resolution graph (TIP): Full resolution graph or TIP, except for Avg, max & min of the previous point.
- Show threshold: Show thresholds, when activating this feature they will be represented as backgrounds in different colors.
- Time comparison (overlapped): When activated, it shows the graph of the module in that time frame, tabbed on top. For example, if the graph shows a 1-month span, the tabbed graph above is the previous month.
- Sliced mode: It displays the graphs grouped by time (1 hour by default), with the option to display the maximum, minimum, average and summation (Maximum, Minimum, Average, Summation) in area, line or vertical bars mode:
Simple baseline graph
This type of graphs can excessively overload Pandora FMS if a lot of data is used to make future estimates.
You can see future values with estimates of the selected Module. For example, if you select a period of one week and today is Tuesday, you will see the actual data for Monday and Tuesday and the estimates for the other days.
- Label: Label that can be assigned to the element.
- Time lapse: Time interval over which the report will be calculated (from the present moment).
- Agent: The control to choose the Agent for this item, type the first letters of the name and you will get a drop-down list.
- Module: Drop-down list that is loaded dynamically with the Modules of the Agent selected in the previous control.
Custom graph
User-defined combo chart. A field is added by means of the Custom graph to select the custom graphic:
The fields of this form are:
- Name: Report name. The following macros can be used:
_agent_: Name of the Agent you have selected in the report item._agentdescription_: Description of the Agent you have selected in the report item._agentgroup_: Group of the Agent you have selected in the report item._address_: Address of the Agent you have selected in the report item._module_: Name of the Agent Module you have selected in the report item._moduledescription_: Descripción del Módulo de Agente que ha seleccionado en el elemento del informe.
- Time lapse: Time interval over which the report will be calculated (from the moment the report is generated).
- Custom graph: A drop-down list with user-defined graphics. These graphics can be created either from the Create or from the menu Operation → Reporting → Custom graph → Create graph.
SQL query
This kind of graphs defined from SQL have to be used with care because they can overload the Pandora FMS server in excess.
This type of report element allows custom charts to be defined for use in reports.
- These graphs will be created using SQL code entered by the user.
- This SQL code should always return a variable called
labelfor the text labels or name of the elements to be displayed and a field calledvalueto store the numeric value to be represented.
For security reasons the following words are reserved and therefore excluded from queries:
*, DELETE, DROP, ALTER, MODIFY, password, pass, INSERT y UPDATE.
Simple SQL used to create graphs of this type:
SELECT a.nombre as `label`, count(st.id_agente_modulo) as `value`
FROM tagente_estado st, tagente a;
In SQL query, to delimit the report in start and end date and time, you can use the macros _start_date_ and _end_date_ respectively. In Serialised header for each requested field and separated with | the column headers can be set. For this case the use of label and value are omitted so no graph will be drawn.
To save SQL queries with macro variables you must use the Custom SQL option in the Operation → Reporting menu.
Then when requesting the report you expand Filters, in Date you choose Choose start/end date period then select the start date and time in From: and select the end date and time in to:, then click Update:
- Query History Database: Includes data that is stored in the historical database. With this option selected, it may take a little more time to display the result.
SQL pie graph
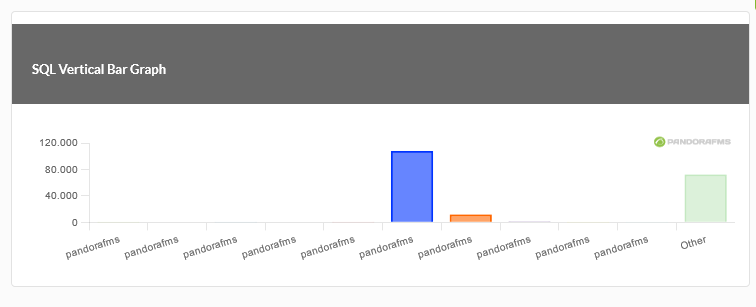
SQL Vertical bar graph
SQL horizontal bar graph
Availability Chart
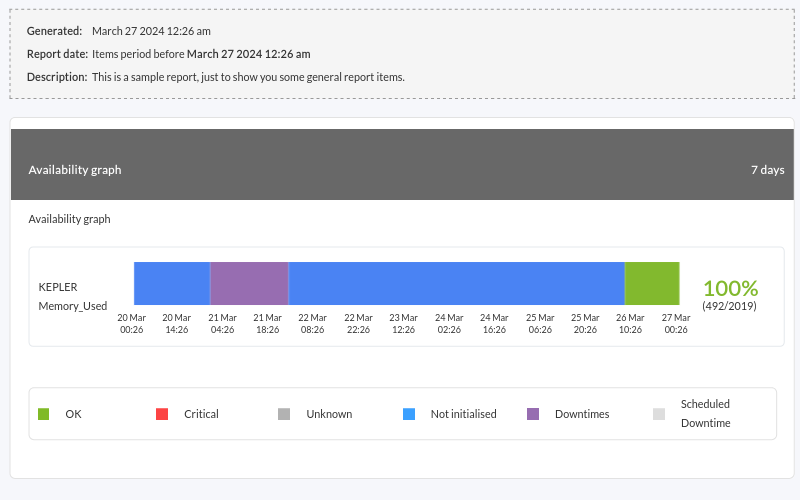
Availability report (Availability graph), shows a detailed report of the states reached by a module in a given time interval.
It will indicate all the relevant information about the time that this module has been available.
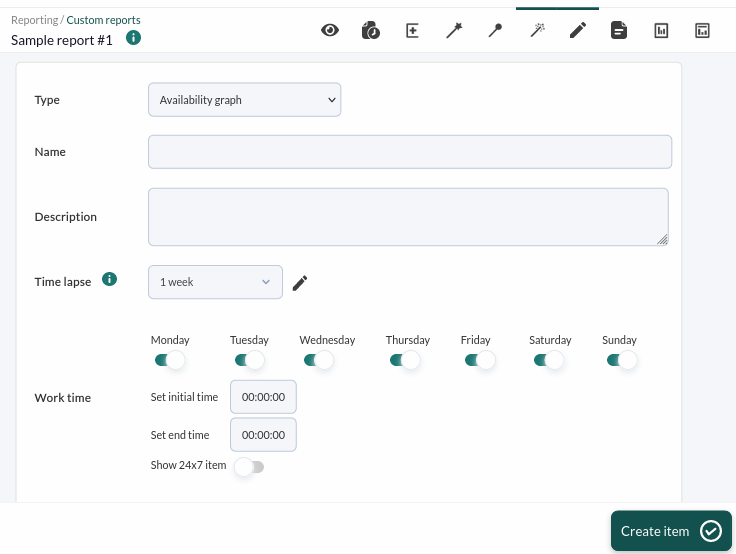
We can choose the time range for which we want the report (for example, the last month) and the working time if, for example, we need to indicate that we are only interested in the status of our module at a certain time (for example, 8×5, 8:00 a.m. to 4:00 p.m. Monday through Friday).
As of version 749 of Pandora FMS, this type of report also includes the possibility of checking the 24×7 box, which is located under working time. In this way, the information will be collected without taking into account the working time configuration and being able to compare both cases, since it will show us 2 independent graphs.
It is also possible to determine a prioritization mode. When choosing the OK prioritization mode, if data in the SLA compliance range and some other status (such as a planned shutdown) are flashed over time, it will color that section in green. If the unknown prioritization mode option is chosen, the color corresponding to the other state will always be displayed.
After saving the data of the report element, we will add the modules that we want at the bottom:
Note: You can use the SLA min. and max. (value) to indicate that the calculation is done in relation to the values reached by the module in that range. SLA limit % will indicate the minimum acceptable (within that range).
By defaultto, if you do not specify a minimum or maximum for the value, the threshold values defined in the module (dynamic limits) will be used.
Viewing the report we will see the availability graph of the chosen module in the selected time range:
Failover mode
This utility is used to assign 'failover or backup' modules to the main module on which you want to perform the availability calculation. In other words, if a module is assigned one or more failover modules, the availability calculation for a given period will be done taking these modules into account.
When the main measured module falls, if there are one or more operational backup modules, these will be taken into account for the calculation of the SLA. In this way, only the real service failure is shown where primary and backups do not work.
Add failover or backup modules
We will do this in the edition of the module on which we want to perform the availability calculation, in the module relations section ('Module relations'):
We select the module that we want to act as failover and select the type of relationship, which in this case is of the failover type.
Once the modules have been assigned in the report, we activate the 'failover mode' option:
We will have two types of visual representation:
- Normal: It will show the graph of the main module, as well as that of all its failover or backup modules and the result graph.
- Simple: It will only show a graph that will be the result of the availability calculation of said modules.
In the simple type 'availability graph' reports, the possibility of adding a failover module directly in the report as a simulation is added, this will work exactly the same as the previous ones.
This is not applicable in the wizard or template reports.
Module Histogram graph
It will display a graph with the state histogram of the chosen module.
IPAM
IPAM networks
You should choose one of the networks created in the Operation view. Two important options are to show the IP addresses that are active and/or the IP addresses that are not assigned to any agent. Other common fields exist.
SLA Items
All the reports of Service Level Agreement (SLA) show information about the compliance of a metric, that is, they indicate the percentage of time that the module has had a known valid value.
- All SLA understand unknown periods as valid, since Pandora FMS cannot guarantee the module status if it does not have data from it.
- All periods in planned stop are also considered valid (since being in a situation of planned stop we assume that the module situation is controlled and accepted) and periods in warning status (service continues to be provided with some shortcomings).
Planned shutdowns can be created in the past as long as the console administrator has enabled it in the general configuration.
Some of the SLA reports present data grouped by time periods and the overall status of these periods is calculated. As these are long periods, the module from which the report is being made may have gone through many states: going to unknown, going through a planned stop… In these reports, there is a configuration parameter called prioritization mode that determines which states take precedence when summarizing. You have two options:
- OK prioritization mode: Prioritizes the SLA compliance value over the non-operation time of the report, planned shutdowns, unknown time and not started.
- Unknown prioritization mode: Any value other than OK will prevail. In this way, the non-operation times of the report, planned shutdowns, unknown time and not started will be seen even though there is some data that makes the SLA be met.
Of course, if at any time the SLA compliance value is not reached, it will be painted red in either mode.
S.L.A.
It allows to measure the level of compliance of a service or any Pandora FMS monitor. Most important fields:
- Time lapse: Time interval over which the report will be calculated (from the current time).
- Work time: The period of time the S.L.A. will be running. The graph will be displayed in full, but will only be calculated with the data within the working time. The S.L.A. will be unknown (N/A) if the interval to be displayed is outside the working interval. It also includes the possibility to check the 24×7 box, which is located below the working time, in this way the information will be collected without taking into account the working time setting and being able to compare both cases, since it will show 2 independent graphs.
- Agent: Combo where you can indicate the agent on which to apply the report.
- Module: In a combo box, the agent module previously set on which the SLA will be calculated is selected.
- SLA min (value): Optional, sets the minimum SLA value. Values less than this value will trigger the SLA. You can leave it blank to use the normal minimum acceptable values of the module.
- SLA max (value): Optional, set the maximum value of the SLA. Values greater than this value will trigger the SLA. You can leave it blank to use the normal maximum acceptable values of the module.
- SLA Limit (%): Sets the percentage of correct time for the SLA. When the module has been within the minimum and maximum value limits for that percentage of time, the SLA will appear as successful, otherwise it will appear as failed. It is possible to add new modules to the SLA to make several combined SLA of modules from the same agent or from different agents.
In the case of combined SLA, compliance with the SLA will depend on compliance with all SLA that have been configured.
The SLA value will take into account only critical states of the selected module and will be marked as valid:
- Time in unknown.
- Time in planned shutdown.
- Time in warning status.
- Time in OK state.
Monthly SLA
This is a variant of S.L.A., which instead of measuring service level over a period, measures it for each day of the months in that period.
Unknown days will be taken into account as valid data for the percentage of SLA-compliant days.
Weekly SLA
Shows the S.L.A. of the modules chosen by weeks throughout the selected period (by default current month, although it can be deactivated in Current Month).
Hourly SLA
Shows the S.L.A. of the chosen modules per hour throughout the selected period (by default current month, although it can be deactivated in Current month).
SLA services
Allows to measure the SLA of any service created in Pandora FMS.
- Work Time: Validity time to be taken into account for the SLA calculation, by default every day and every hour, each day and hour are customizable.
- Only display wrong SLAs: Allows to detail only when the service has failed.
Since the services in Pandora FMS incorporate their own SLA readings, the calculation for the report is different from the standard operation. The SLA validity limit values will be automatically retrieved from the definition of the service itself.
In order to add one or more services, you must first create the report item and then edit and add these elements in the footer.
Prediction Items
Prediction date
Using a projection of a module's data into the future, it returns the date on which the module is likely to take a value in a given range.
The least squares method is used for the calculation.
- Periodicity: The time period to be used as the basis for the estimate.
- Data Range: The interval within which the module data must be within to return the probable date.
Projection graph
It allows to estimate the values that a module will take in the future.
This estimate is based on the least squares method.
- Periodicity: The time period to be used as the basis for the estimate.
- Projected period: The future time period over which the data will be projected.
The area marked Period represents the evolution of the module data during the selected time interval and Projection period shows the probable evolution of the module in the requested time.
Module Items
Avg. Value
Allows you to display the average value of a module (with the option of displaying a graph) in the defined period. This value is calculated at the moment of viewing the report.
- Label: Label that can be assigned to the element. The following macros can be used:
_agent_,_agentdescription_,_agentgroup_,_address_,_module_,_moduledescription_. - Time lapse: The period of time it will take backwards in the time point at which the report is generated. This value can be changed in the filter date field when viewing the report.
- Calculate for custom intervals: Display average data in custom intervals. Enabling this option will enable the following fields:
- Time lapse intervals: Time periods in which the period is divided for more precise calculations.
- Table only / Graph only / Graph and table: Show table, graph or both.
- Use prefix notation: Prefix notation for numeric values, otherwise the full numeric value will be displayed.
Max. value
Displays the maximum value of a module in the defined period, this period is calculated at the time of viewing the report.
- Label: Label that can be assigned to the element. The following macros can be used:
_agent_,_agentdescription_,_agentgroup_,_address_,_module_,_moduledescription_. - Time lapse: The period of time it will take backward at the time point at which the report is generated. This value can be changed in the date field of the filter when displaying the report.
- Calculate for custom intervals: Show maximum data in custom intervals. Enabling this option will enable the following fields:
- Time lapse intervals: Time periods in which the period is divided to show each maximum value.
- Table only / Graph only / Graph and table: Show table, graph or both.
- Use prefix notation: Prefix notation for numeric values, otherwise the full numeric value will be displayed.
Min. value
Displays the maximum value of a module in the defined period, this period is calculated at the time of viewing the report.
- Label: Label that can be assigned to the element. The following macros can be used:
_agent_,_agentdescription_,_agentgroup_,_address_,_module_,_moduledescription_. - Time lapse: The period of time it will take backward at the time point at which the report is generated. This value can be changed in the date field of the filter when displaying the report.
- Calculate for custom intervals: Show minimum data in custom intervals. Enabling this option will enable the following fields:
- Time lapse intervals: Time periods in which the period is divided to show each minimum value.
- Table only / Graph only / Graph and table: Show table, graph or both.
- Use prefix notation: Prefix notation for numeric values, otherwise the full numeric value will be displayed.
Monitor report
Shows the percentage of time that a module has been in normal state or another of its states, such as warning or critical (values OK and Not OK, respectively), in the defined period of time.
- Label: Label that can be assigned to the element. The following macros can be used:
_agent_,_agentdescription_,_agentgroup_,_address_,_module_,_moduledescription_. - Time lapse: Time interval over which the report will be calculated (from the current time).
Serialise data
Shows an item in the report in table format from the data stored in the tagente_datos_string table in the Pandora FMS database. For this, the agent must serialize the data separating them with a line separator character and another field separator, and all the lines must contain all the fields.
This type of item, for example, is used for the agent that extracts management data from the SAP platform.
- Serialised header: Text field where to put separated by
|to define the headers of the table that will be displayed in the report, for each column that would appear when separating the compacted field. - Field separator: Separator in different fields of the serialized text string.
- Line separator: Separator in different lines (made up of fields) of the serialized text string.
The module that generates the following report returns lines with the following content:
Some text sample|some value#this is a new row|and another value
Summation
Shows the sum of the values of a module in a given period.
- Use prefix notation: Use prefix notation for numeric values (example: 20.8 Kbytes/sec); otherwise, the full value will be displayed (example: 20742 bytes/sec).
- Uncompress module: To use data from uncompressed modules.
Historical data
It is used to receive a dump of the old stored data from the module that is indicated in the report configuration. The historical_database|historical database] must be enabled.
- Time lapse: Time interval over which the report will be calculated (from the present moment).
- Agent: The control to choose the Agent for this item, type the first letters of the name and you will get a drop-down list.
- Module: Drop-down list that is loaded dynamically with the Modules of the Agent selected in the previous control.
Increase
Use this type of report element (Increment) to display a brief analysis indicating the change in value for the indicated modulus.
- Name: Name of the report. The following macros can be used:
_agent_: Name of the Agent that you have selected in the report element._agentdescription_: Description of the Agent that you have selected in the report element._agentgroup_: Agent group that you have selected in the report element._address_: Address of the Agent that you have selected in the report element._module_: Name of the Agent Module that you have selected in the report element._moduledescription_: Description of the Agent Module that you have selected in the report element.
- Time lapse: Time interval over which the report will be calculated (from the present moment).
- Agent: The control to choose the Agent for this item, type the first letters of the name and you will get a drop-down list.
- Module: Drop-down list that is loaded dynamically with the Modules of the Agent selected in the previous control.
Report display example:
Last Value
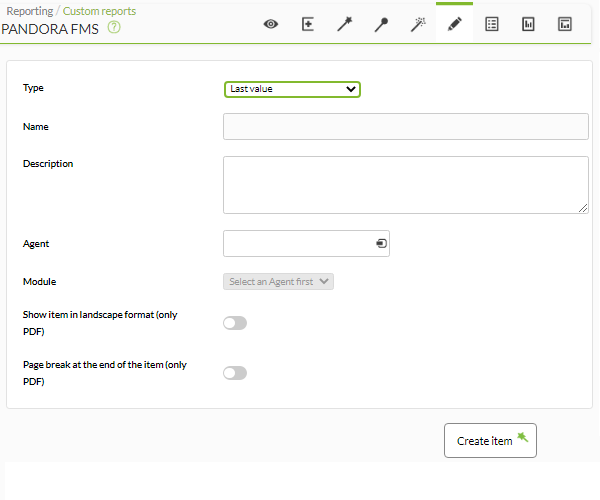
Last value (Last Value) of a module in the defined period. This period is calculated at the time of viewing the report.
- Name: Name of the report. The following macros can be used:
_agent_: Name of the Agent that you have selected in the report element._agentdescription_: Description of the Agent that you have selected in the report element._agentgroup_: Agent group that you have selected in the report element._address_: Address of the Agent that you have selected in the report element._module_: Name of the Agent Module that you have selected in the report element._moduledescription_: Description of the Agent Module that you have selected in the report element.
- Agent: The control to choose the Agent for this item, type the first letters of the name and you will get a drop-down list.
- Module: Drop-down list that is loaded dynamically with the Modules of the Agent selected in the previous control.
In the HTML version of the report, an item of this type is generated, for example:
Items grouped
Overall
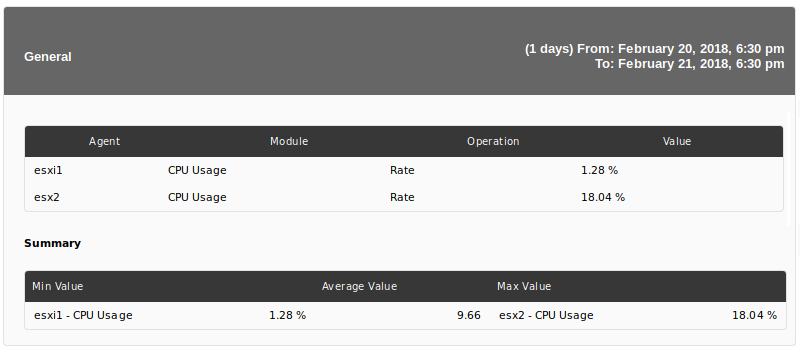
Shows values from different modules sorted (ascending, descending or by agent name) or/and grouped by agent.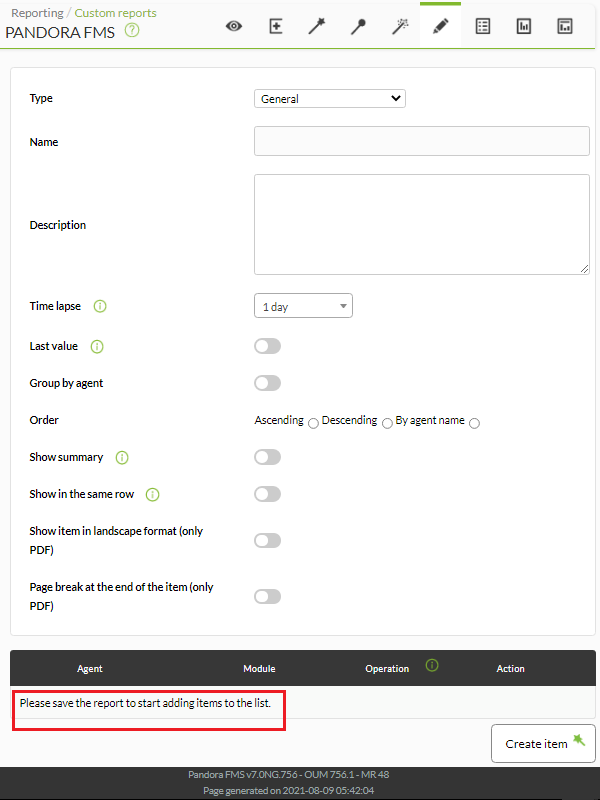
- Name: Name of the report. The following macros can be used:
_agent_: Name of the Agent that you have selected in the report element._agentdescription_: Description of the Agent that you have selected in the report element._agentgroup_: Agent group that you have selected in the report element._address_: Address of the Agent that you have selected in the report element._module_: Name of the Agent Module that you have selected in the report element._moduledescription_: Description of the Agent Module that you have selected in the report element.
- Time lapse: Time interval over which the report will be calculated (from the present moment).
- Last value: Show only the last reading of the chosen modules. By selecting this option, Time lapse is disabled and is not displayed.
Reports in period 0 cannot show past information. The information contained in this type of report will always show the most recent information.
- Group by agent: Group the report metrics by agent.
- Order: Order in which to display the metrics.
- Show summary: Show a final summary with the average, maximum and minimum values.
- Show in the same row: Show all operations (max., min., avg. or sum.) in the same row.
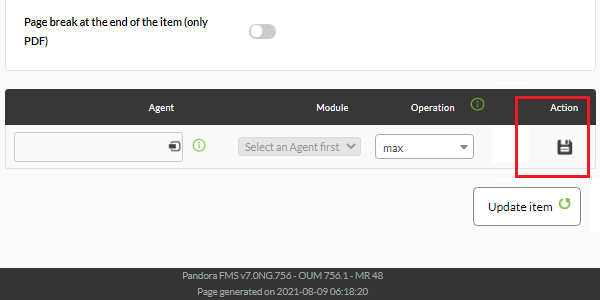
- Once the data of the previous fields has been added, save the report to be able to add agents and modules. For each agent and module that you add, you only have to use the respective save icon, click once and wait. Only use the Update item button if you are editing any of the above fields again.
Report display example:
Report Group
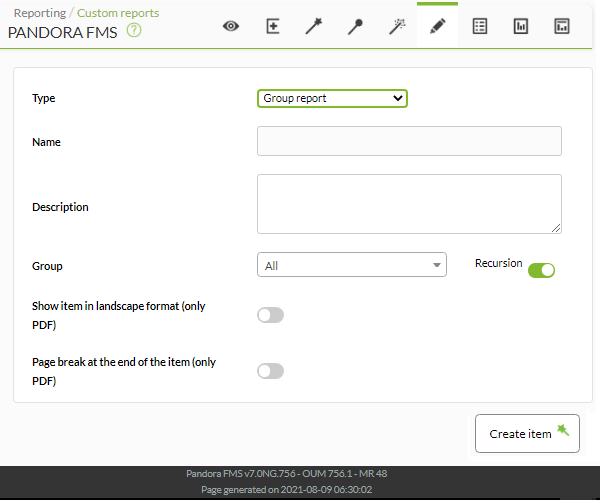
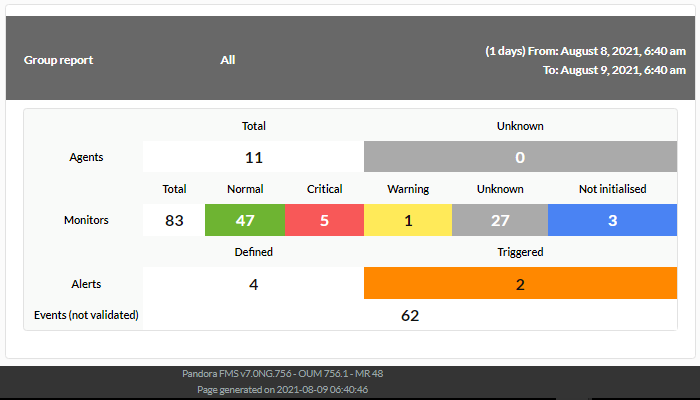
Displays a table with the following information for a given group:
- Agents
- Total number.
- Number of agents in unknown status.
- Modules
- Total number.
- Number of modules in normal state.
- Number of modules in critical state.
- Number of modules in warning state.
- Number of modules in unknown state.
- Number of modules not started.
- Alerts
- Number of alerts defined.
- Number of alerts triggered.
- Events
- Number of events in that group in the last 8 hours.
- Name: Name of the report. The following macros can be used:
_agent_: Name of the Agent that you have selected in the report element._agentdescription_: Description of the Agent that you have selected in the report element._agentgroup_: Agent group that you have selected in the report element._address_: Address of the Agent that you have selected in the report element._module_: Name of the Agent Module that you have selected in the report element._moduledescription_: Description of the Agent Module that you have selected in the report element.
- Cluster: Combo to select the group. Even if the person creating the group report does not explicitly belong to the EVERYONE group (ALL), they will still be able to assign the group ALL as a source of Agents, Alerts, etc.
- Recursion: Recursively analyze the child groups of the selected group.
Report display example:
Exception
Shows the values of various modules that fulfill logical operations (Condition):
- Equal to ( = ): Equal to the indicated value.
- Everything: Any value.
- Greater or equal to ( >= ): Greater or equal to the indicated value.
- Greater than ( > ): Greater than the indicated value.
- Less than ( < ): Less than the indicated value.
- Less than or equal to ( ⇐ ): Less than or equal to the indicated value.
- Not equal to ( != ): Not equal to the indicated value (any value other than the indicated value).
- Not OK: Report when its status is different from
OK. - OK: Report when its status is
OK.
We can configure the following fields:
- Name: Name of the report. The following macros can be used:
_agent_: Name of the Agent that you have selected in the report element._agentdescription_: Description of the Agent that you have selected in the report element._agentgroup_: Agent group that you have selected in the report element._address_: Address of the Agent that you have selected in the report element._module_: Name of the Agent Module that you have selected in the report element._moduledescription_: Description of the Agent Module that you have selected in the report element.
- Time lapse: Time interval over which the report will be calculated (from the present moment).
- Last value: Show only the last reading of the chosen modules.
- Order: Order in which to display the metrics.
- Value: Value that will be considered with the chosen condition.
- Show graph: Allows you to choose to show chart and graph (Chart & Graph), only graph (Only graph) or only table (Only table).
- Show summary: Show a final summary with the average, maximum and minimum values.
- Once the data of the previous fields has been added, save the report to be able to add agents and modules. For each agent and module that you add, you only have to use the respective save icon, click once and wait. Only use the Update item button if you are editing any of the above fields again.
Report display example:
Agents/Modules
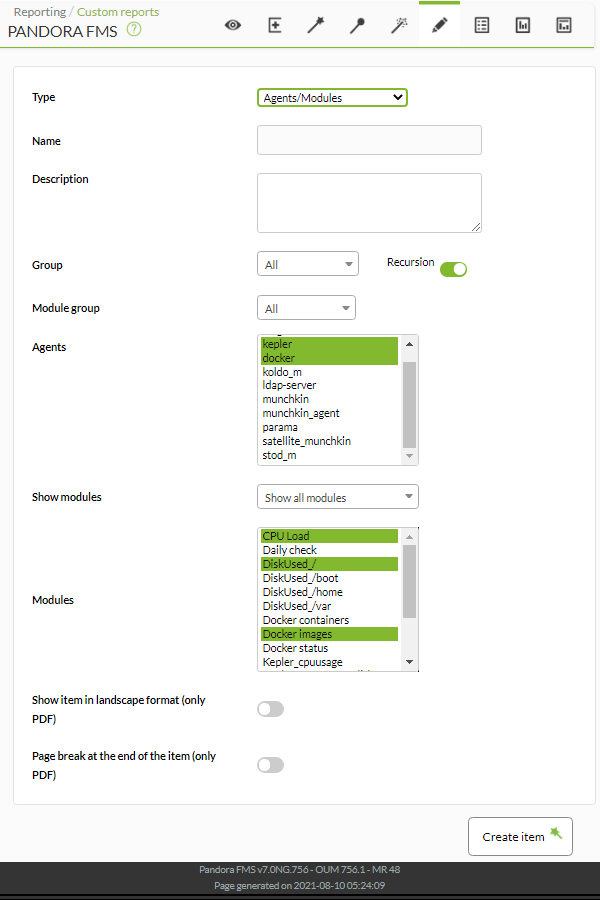
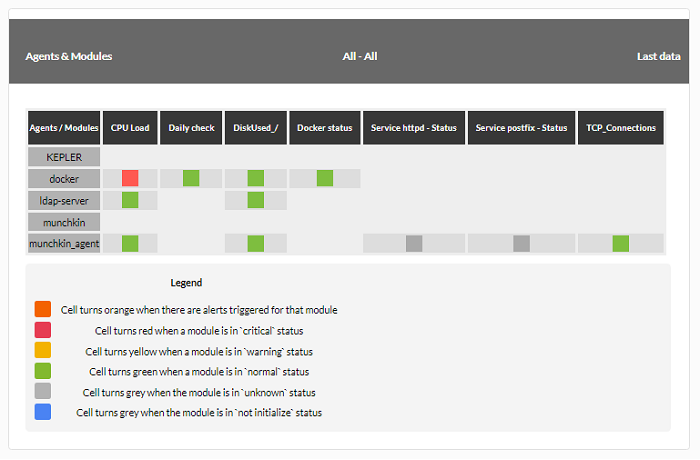
Agents/Modules displays an array of agents and modules from a given group of selected modules with their associated status. You can get the agents by groups (includes recursion option for subgroups) and filter by common modules between them. Furthermore, the modules can also be filtered by groups (application, database, network, etc.).
- Name: Name of the report; macros are disabled in this field.
- Group: Allows you to select groups of agents. To display absolutely all agents, select All.
- Recursion: If you have selected a group other than ALL from the previous list, you can check this option to search for agents in the subgroups.
- Module group: Filter the agents by groups (Application, Database, General, etc.).
- Agents: Multiple selection of agents to display in the report.
- Show modules: Allows you to show all the modules of the agents selected in the previous points. You can use the option to see only the modules that they have in common with each other (Show common modules).
- Modules: Multiple selection of modules to show in the report.
Example:
If you edit the report again, you will need to reselect the modules again.
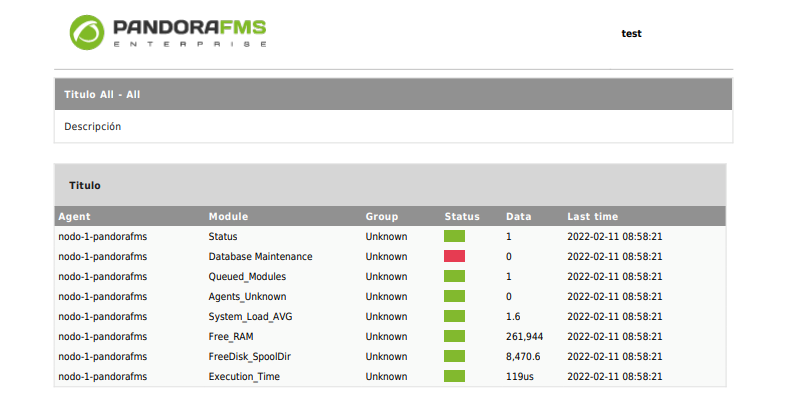
Agents/Module Status
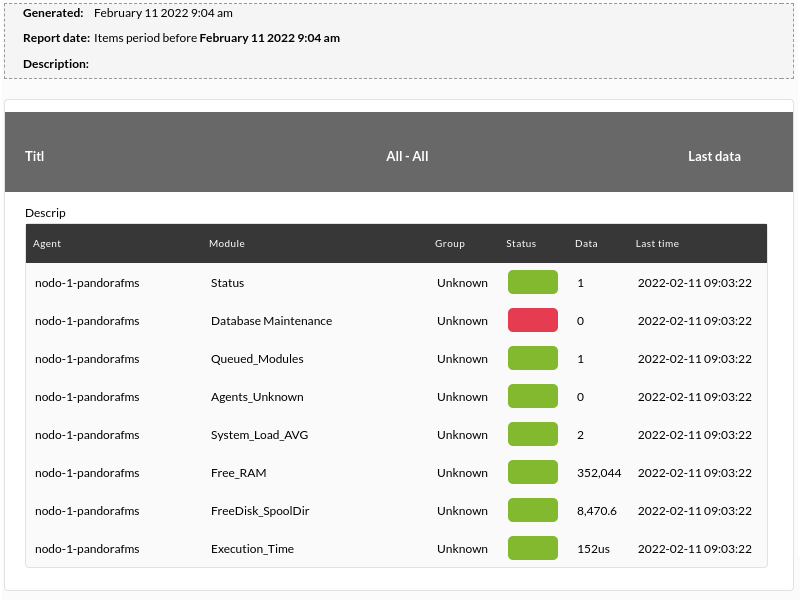
Agents/Modules status shows in table mode the status of themodules as well as their data and the last time to record said data. Request example:
Generates the following example output:
Apart from the general options, it also allows you to filter by:
- Group (Group).
- Selector for multiple agents (Agents and the corresponding All button).
- Selector for multiple modules (Show modules, Modules and the corresponding All button).
- Each of the added modules can be excluded by clicking on the X icon that accompanies its name.
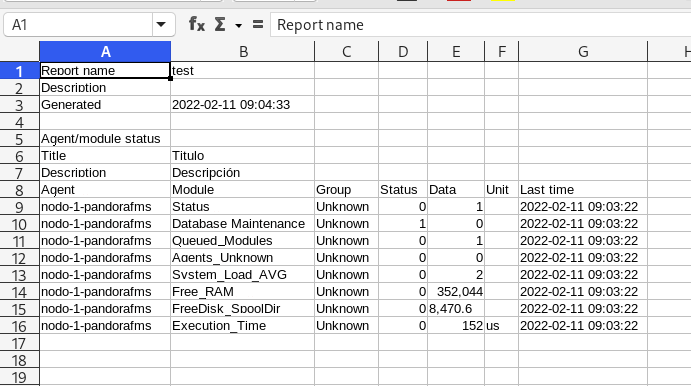
The report can be exported to PDF and CSV (in the image a CSV opened in a spreadsheet):
In the Command Center (Metaconsole), the report contains the server to which the agent belongs:
Templates are in both node and Command Center (Metaconsole): This allows you to search using regular expressions. Example:
SQL Queries
This feature also works in Command Center (Metaconsole).
This item shows a table to have personalized data extracted directly from the Pandora FMS database.
This type of items must be used carefully as they can excessively overload the Pandora FMS server.
When selecting the SQL Query report type:
- Name: Name of the report; macros are disabled in this field.
- Custom SQL template: Drop-down list containing saved query SQL templates for easy use. These can be managed through the Reporting→ Custom SQL menu.
- Query SQL: If an SQL template is not chosen, this text box is enabled to enter the SQL query.
- Serialized header: Text field to define the headers of the table that will be displayed in the report, for each column of the result of the SQL query made. Separate these headers with the character
|. - Query History Database: Checkbox that when checked will make the SQL query also collect the data from the historical database.
Due to security restrictions, there are some reserved words that cannot be used:
*.DELETE.DROP.ALTER.MODIFY.password.pass.INSERT.UPDATE.
Custom SQL
You can define your own templates in the Operation → Reporting → Custom SQL menu.
In the query list view, you can create a new stored query by clicking the Create custom SQL button. Define your query and put a name to identify it and press Save to make it appear in the list.
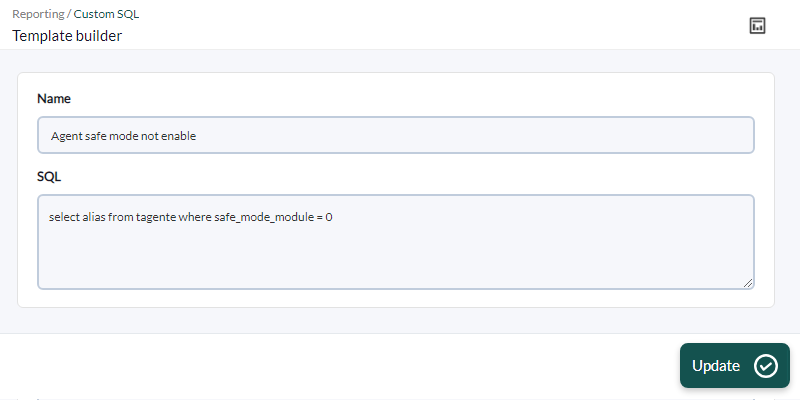
To edit the SQL query, in the list of queries click on the name and you will get a screen similar to the next figure:
Make the necessary changes and to save press the Update button.
First example
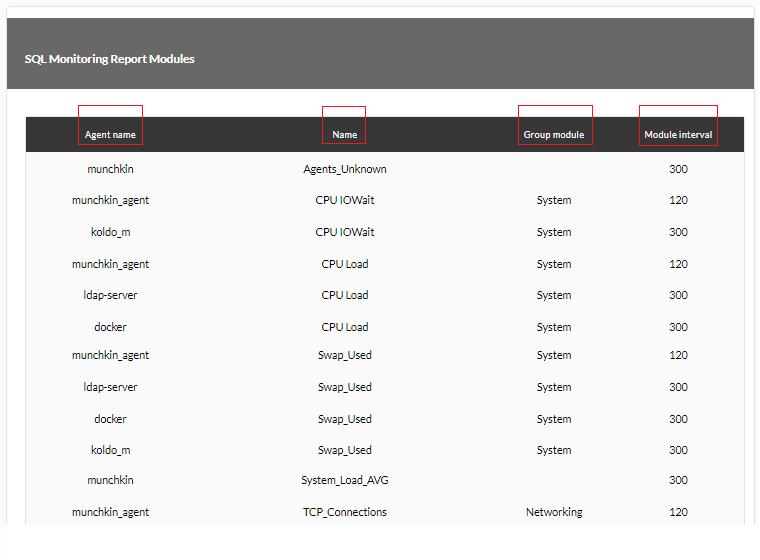
Example query using the Custom SQL template dropdown (predefined “SQL Monitoring Report Modules” query, note the use of the corresponding headers in the Serialized header):
Report display from the previous example:
Second example
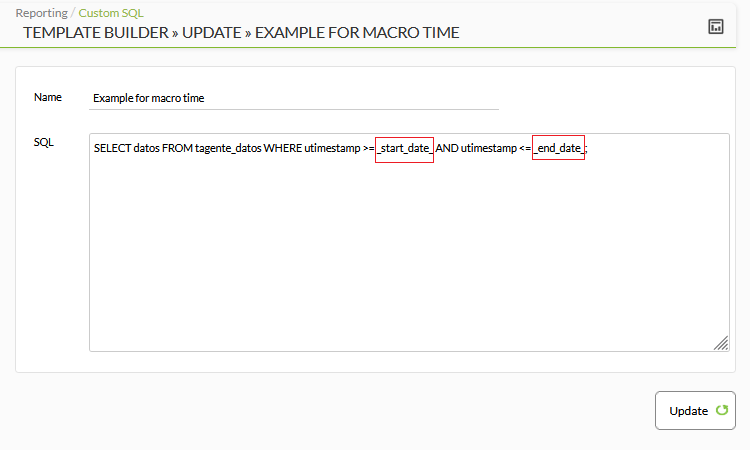
In an SQL query, to delimit the report on both the start and end date and time, you can use the _start_date_ and _end_date_ macros respectively. Example:
Third example
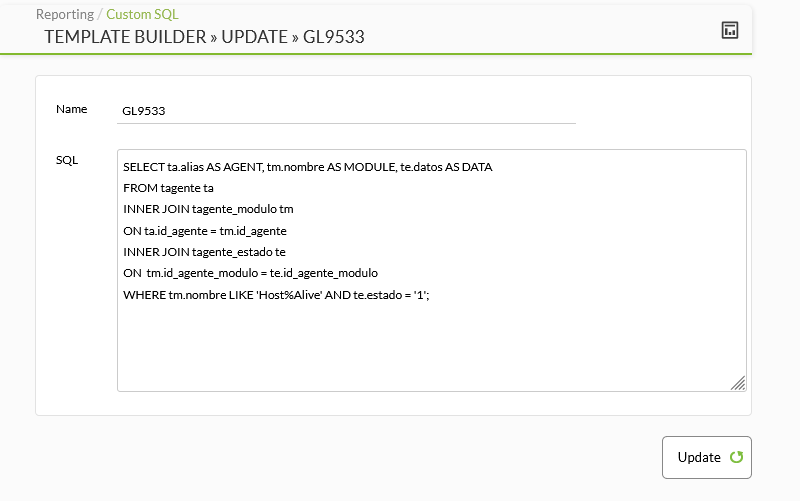
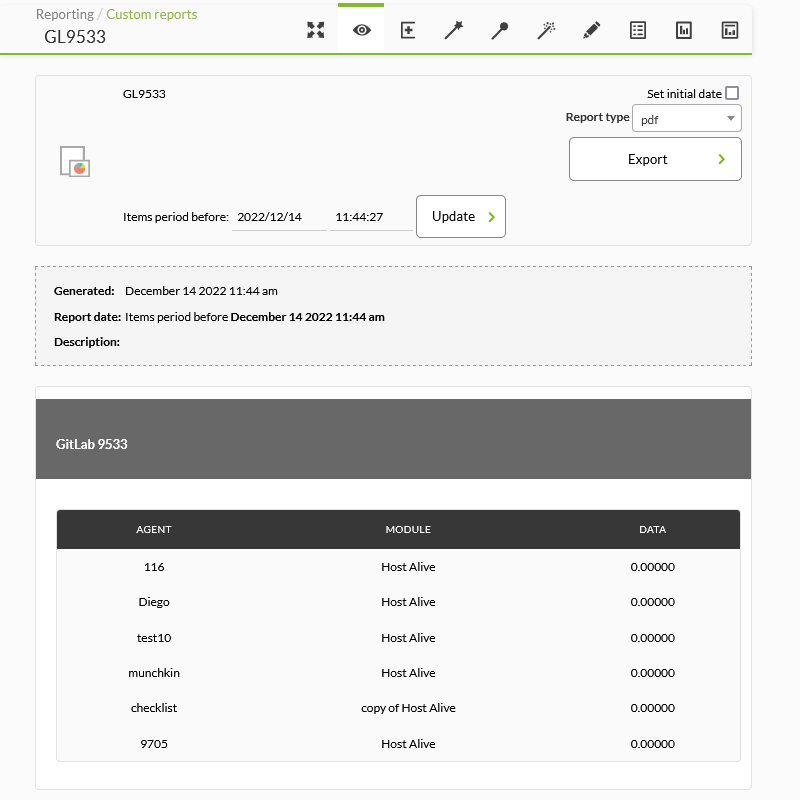
Get all modules called Host Alive that are in a critical state. For this example go to the Reporting menu → Custom SQL and add a query with the following code:
SELECT ta.alias AS AGENT, tm.name AS MODULE, te.data AS DATA
FROM tagente ta
INNER JOIN tagente_modulo tm
ON ta.id_agent = tm.id_agent
INNER JOIN tagent_state te
ON tm.id_agent_module = te.id_agent_module
WHERE tm.name LIKE 'Host%Alive' AND te.status = '1';
Save the query with a suitable name.
Now go to the Reporting menu → Customs reports and add a report with the Create report button. Again use a suitable name and fill in the requested fields, save the report with the Save button.
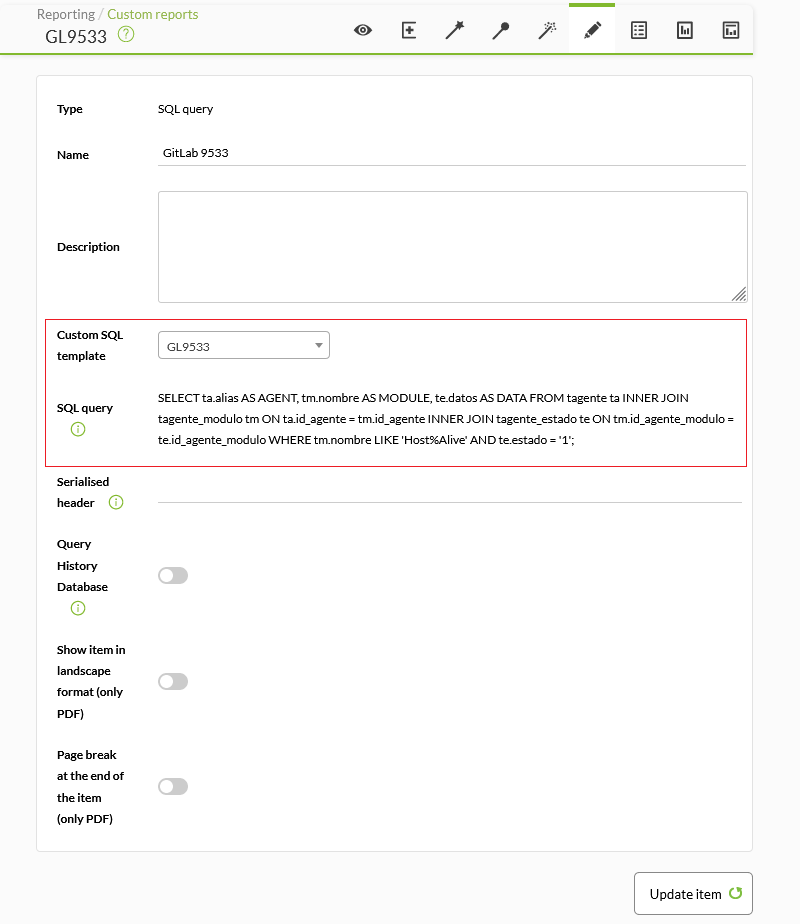
Now go to the item editor by clicking on the Item editor icon and select the SQL query option in Type from the drop-down list (it is in the Grouped subsection). Leave the Serialised field blank and fill in the rest of the fields appropriately. Save the changes.
Go to the display button, you will get something like this:
Fourth example
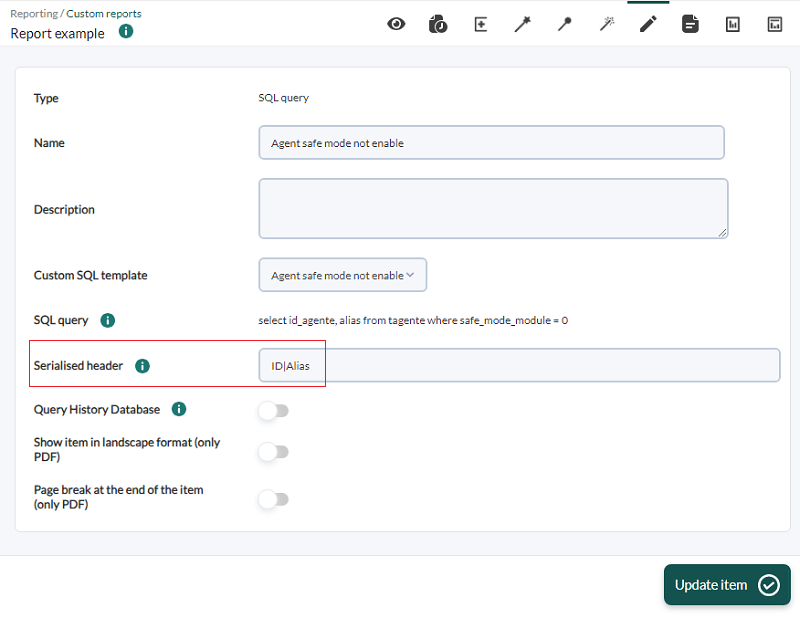
Modify the template that comes by default with Pandora FMS called Agent safe mode not enabled:
Add the id_agent field to the query, click Update to save the changes. In a custom report add a SQL Query item and select the modified query.
In the Serialized header field, add ID|Alias and save by clicking Update item.
Top N
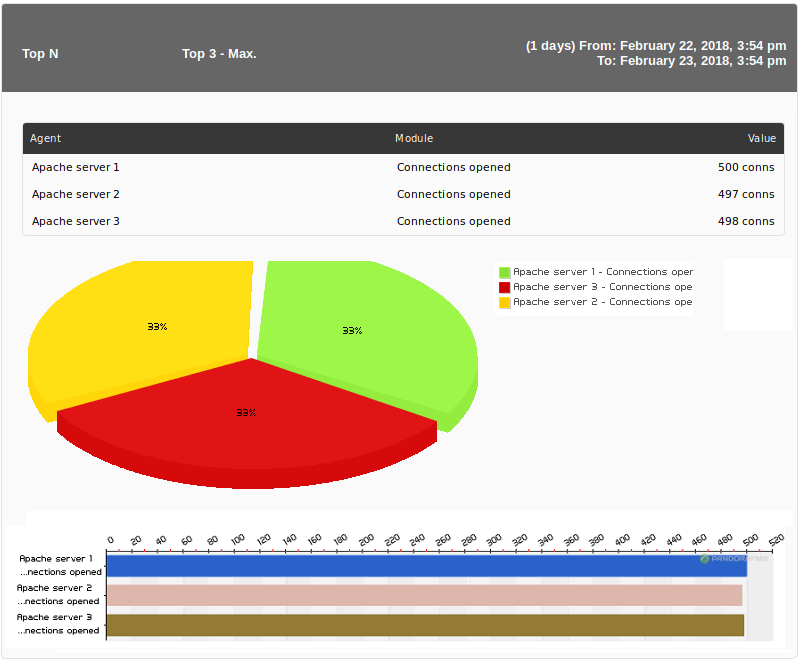
Shows the first values, specified in the Quantity(n) field, discriminated by: maximum, minimum or average over the total number of modules added. They can be sorted ascending, descending or by agent name.
- Name: Name of the report; macros are disabled in this field.
- Time lapse: Time interval over which the report will be calculated (from the present moment).
- Order: Order in which to display the metrics.
- Quantity(n): Quantity of metrics to display.
- Display: Select maximum, minimum or average.
- Show graph: Allows you to choose to show chart and graph (Chart & Graph), only graph (Only graph) or only table (Only table).
- Show summary: If enabled, displays a summary graph with the maximum, minimum and average number of total modules at the end of the report and the checks.
- Use prefix notation: Use prefix notation for numeric values (example: 20.8 Kbytes/sec); otherwise, the full value will be displayed (example: 20742 bytes/sec).
- Once the data of the previous fields has been added, save the report to be able to add agents and modules. For each agent and module that you add, you only have to use the respective save icon, click once and wait. Only use the Update item button if you are editing any of the above fields again.
- Be careful: when the module has different intervals during its lifetime, sum may return erroneous results.
Example:
Network interfaces
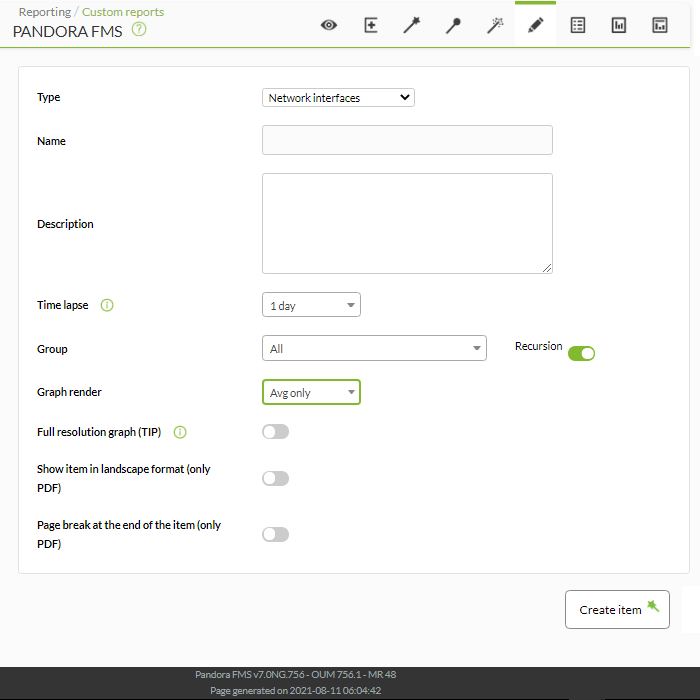
This type of report element generates the network interface graphs of all those devices that belong to the selected group.
- Name: Name of the report; macros are disabled in this field.
- Time lapse: Time interval over which the report will be calculated (from the present moment).
- Agent: The control to choose the Agent for this item, type the first letters of the name and you will get a drop-down list.
- Module: Drop-down list that is loaded dynamically with the Modules of the Agent selected in the previous control.
- Time comparison (overlapped): When activated, it shows the graph of the module in that time frame, tabbed on top. For example, if the graph shows a 1-month span, the tabbed graph above is the previous month.
- Group: Group where agents with interface traffic modules will be searched (see the following note about interface traffic). Even if the person creating the report item does not explicitly belong to the EVERYONE group (ALL), they will still be able to assign the group ALL as a source of Agents with Network Interface Modules.
- Graph render: Allows you to select in the graph only the maximum (Avg only), only the minimum (Max only), only the average (Avg only) or the three fields (Avg, max & min).
- Full resolution graph (TIP): Use the TIP real data painting system instead of the standard engine. Enabling this option disables Graph render.
An agent will be considered to have interface traffic data when it has modules with the following format:
<Interface name>_ifInOctects.<Interface name>_ifOutOctects.<Interface name>_ifOperStatus.
Note: Input/Output octet counters can also be collected from HC counters (hcOctets).
Example:
Custom Graphic Representation
Advanced knowledge about Pandora FMS is necessary to carry out this type of report since it is capable of combining several different elementsis from PFMS, some more complex than others.
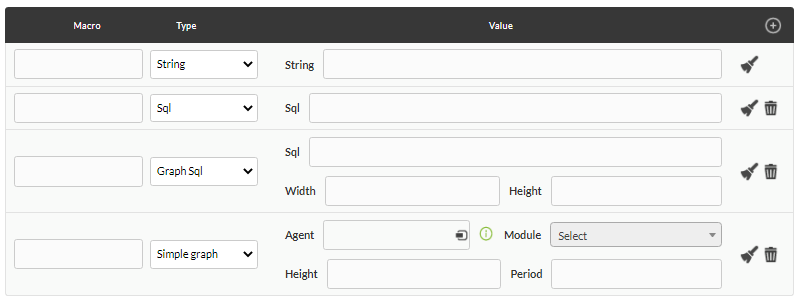
Custom render allows you to generate direct and concise reports both on screen and in PDF (with certain limitations in the latter format). It consists of two components, the definition of macros (Macros definition) and the graphic definition in HTML (Render definition) where the results of the macros will be inserted.
Macro definition
- In the drop-down list (Type) select the type of macro to use.
- All macros, in the Render definition, must go with a special format: at the beginning and at the end with the character
_. For example: if you add a macro calledmacronameyou would put_macroname_in the Render definition. - String type (String): inserts a string where the macro name is located (with the format
_macroname_) in the Render definition. - Structured language query type (SQL): It will obtain information from the database (single value) and it will be inserted where the name of the macro is located in the Render definition.
- Structured language query graph type (Graph SQL): Allows you to create a pie type graph through an SQL query (see “Graphics defined from SQL ”). This query can only have two fields that must have
labelandvalueas aliases; You can also define its height and width. - Simple graph of a module (Simple graph): It will allow adding a simple graph of a Pandora FMS module, therefore it consists of the selection field of an agent and then a module, also the height of the graph and its period amount of time in seconds.
Rendering definition
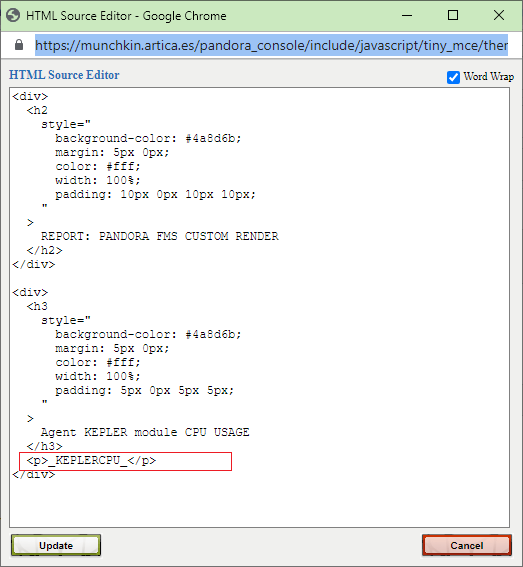
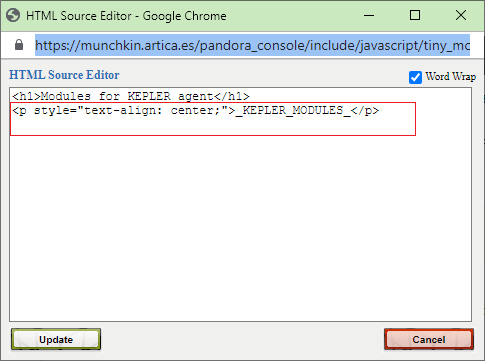
- It has an HTML editor “what you see is what you get” (abbreviated in English WYSIWYG) and also, by pressing the corresponding button, you can insert pure HTML code in a pop-up editing window.
Some CSS instructions are not supported for PDF report generation.
Example 1 (Simple graph)
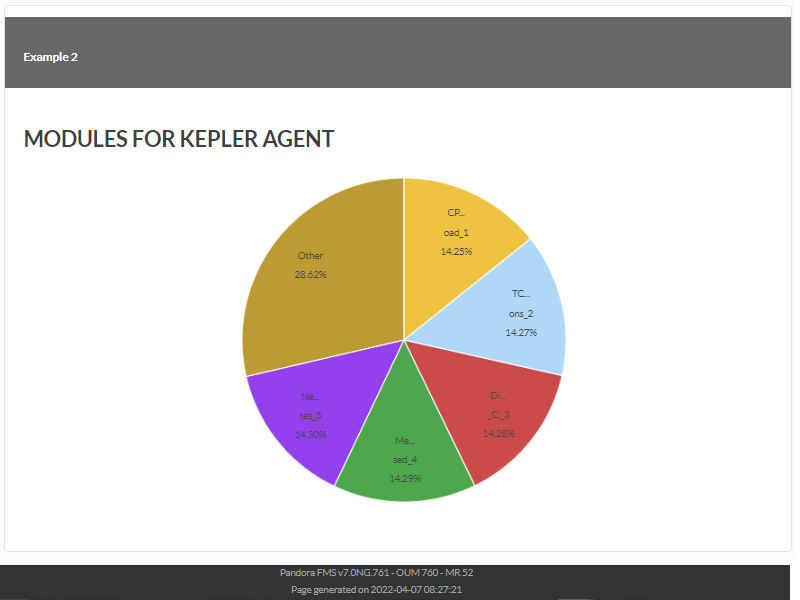
Example 2 (Graph SQL)
This example is completely devoid of practical use in real life and is for teaching purposes only. Querying the database is extremely simple:
SELECT taggent_module. name as 'label', tagente_modulo.id_agent_modulo as ' value' FROM tagente_modulo WHERE tagente_modulo.id_agent=43;
Note the use of the aliases label and value in the query (see “Charts defined from SQL” and “Pandora FMS Engineering”).
Availability
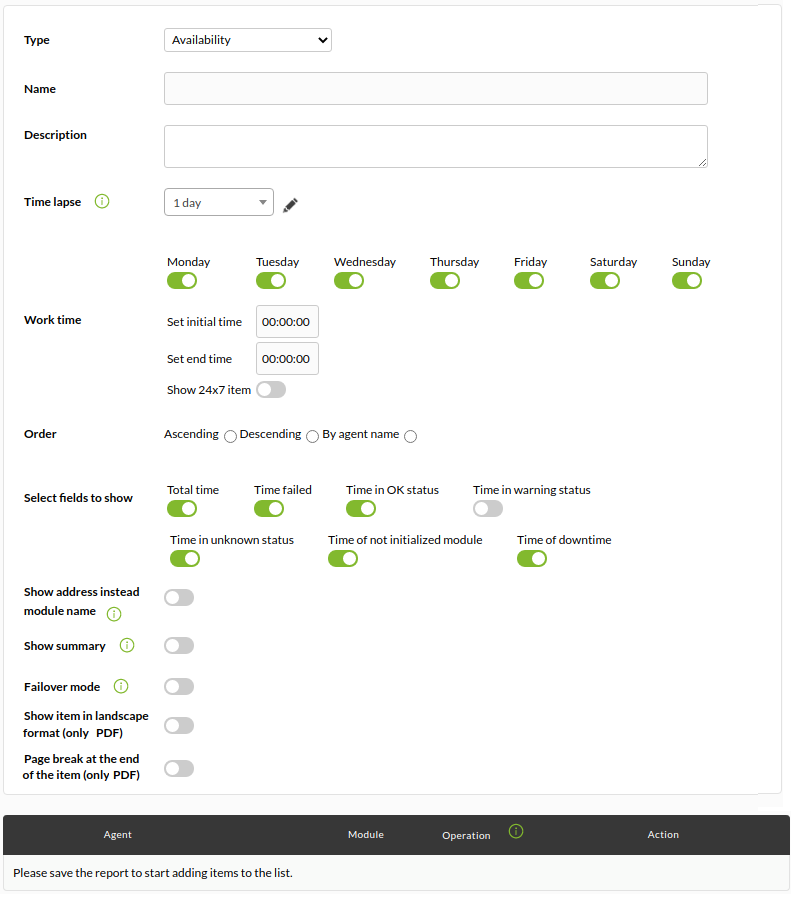
This item (Availability) shows a table with the availability data of a selected list of agents and modules. The data represented in it is an exact reflection of the situation of the modules throughout the selected period.
It also offers the possibility of showing a summary in which the modules with the highest and lowest availability will be shown, as well as an analysis of the average.
- Name: Name of the report; macros are disabled in this field.
- Time lapse: Time interval over which the report will be calculated (from the present moment).
- Work time: The period of time that the module should have been working. The graph will be displayed complete, but it will only be calculated with thes data within working time. Availability will be unknown (N/A) if the interval to display is outside the working interval. As of version 749 of Pandora FMS, this type of report also includes the possibility of checking the box Show 24×7 item, in this way the information will be collected without taking into account the configuration of Work time . This allows you to compare both cases, since it will show 2 independent graphs.
- Order: Order in which to display the metrics.
- Select fields to show: Allows you to select the following fields to show:
- Total time: Total time selected.
- Time failed: Time in failure state.
- Time in OK status: Time in OK status (time in warning status is treated as time in OK if the “Time in warning status” check box is disabled).
- Time Warning: Time in warning status.
- Time in unknown status: Time in unknown status.
- Time of not initialized module: Time in not initialized state.
- Time of downtime: Time out of work.
- Show address instead of module name: It will show the main address of the agent instead of the name.
- Show summary: Show a final summary. You can select the following fields to display:
- Total checks: Total checks.
- Checks failed: Verifications failed.
- Checks in OK status: Checks in OK status.
- Unknown checks: Checks in unknown state.
- Agent max value: Maximum value of the agent.
- Agent min value: Minimum agent value.
- Fail over mode: The SLA calculation must be performed taking into account the modules that have recovered from failures assigned to the primary module. Enabling this option will activate the Fail over type field, which allows you to select between Fail over normal or Fail over simple.
- Once the data of the previous fields has been added, save the report to be able to add agents and modules. For each agent and module that you add, you only have to use the respective save icon, click once and wait. Only use the Update item button if you are editing any of the above fields again.
Example:
Displays the following information:
- Agent: Agent.
- Module / IP Address: When configuring the item you can show the primary IP address of the agent instead of module, very useful for reports that list agents and IP addresses instead of agents and modules ping.
- Total time: Total time to analyze.
- Time failed: Time in critical state.
- Time OK: Time in OK or warning status.
- Time Unknown: Time in unknown state.
- Time Not init: Time not started.
- Time downtime: Time in planned stop.
- %OK: Percentage of time in correct state.
- Total checks: Total number of checks performed during the period of time configured for the report.
- Checks failed: Number of checks that have failed (critical).
- Checks OK: Number of correct checks.
- Checks Unknown: Approximation based on events and Pandora FMS logic that allows indicating the number of checks that should have been performed, but for which there is no response.
Example with Show 24×7 item and Show summary selected:
Text/ HTML Items
Text
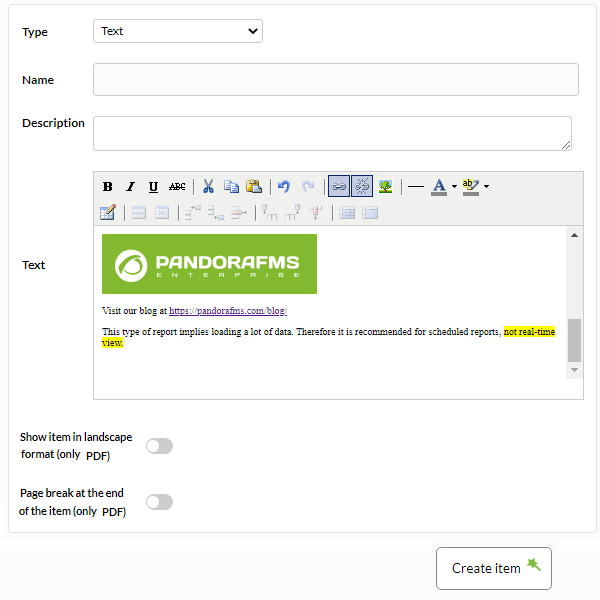
This item shows in the reports a text formatted with HTML, useful to include additional information of each company.
Example screenshot of the window to add link:
Example screenshot of the window to add image:
You can add any HTML content to this element. Report display example:
Import text from a URL
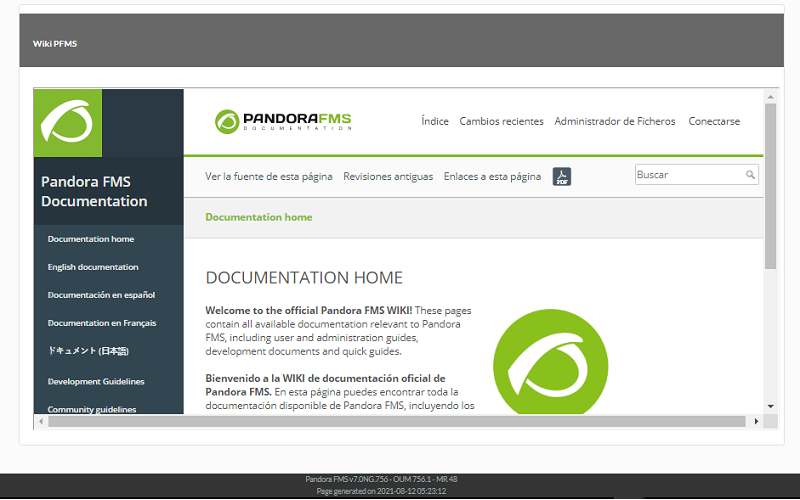
This item (Import text from URL) shows the text extracted from an external server to which Pandora FMS Console has access. You should always keep in mind that in the HTML type report format it will show it as it is, but in the PDF report version it will only show the text in plain format.
- URL: Text field to enter the address of the external server to extract the text.
You must indicate the protocol in the URL ( http: , https:, …)
Example:
Alert Items
Module Alert Report
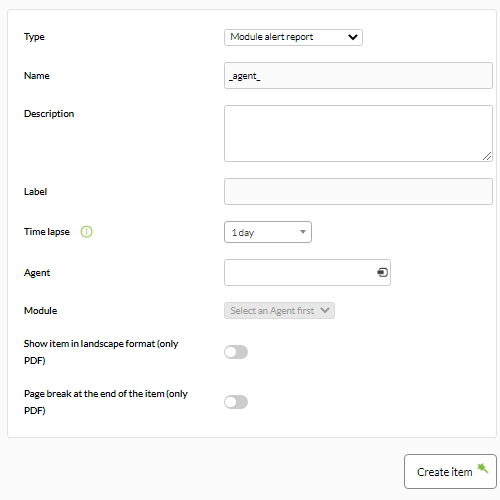
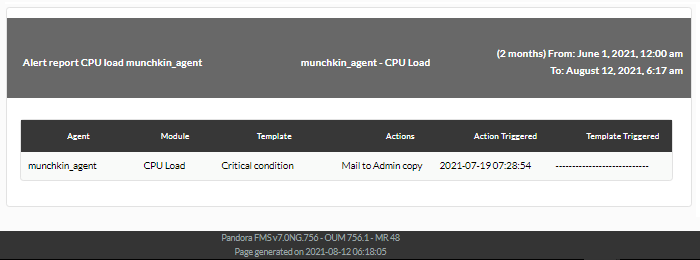
Shows a list with the alerts launched by the module selected in the report, in the defined period (Alert report module).
- Name: Name of the report. The following macros can be used:
_agent_: Name of the Agent that you have selected in the report element._agentdescription_: Description of the Agent that you have selected in the report element._agentgroup_: Agent group that you have selected in the report element._address_: Address of the Agent that you have selected in the report element._module_: Name of the Agent Module that you have selected in the report element._moduledescription_: Description of the Agent Module that you have selected in the report element.
- Label: Label that can be assigned to the element. The following macros can be used:
_agent_,_agentdescription_,_agentgroup_,_address_,_module_,_moduledescription_. - Time lapse: Time interval over which the report will be calculated (from the present moment).
- Agent: The control to choose the Agent for this item, type the first letters of the name and you will get a drop-down list.
- Module: Drop-down list that is loaded dynamically with the Modules of the Agent selected in the previous control.
Example:
Agent Alert Report
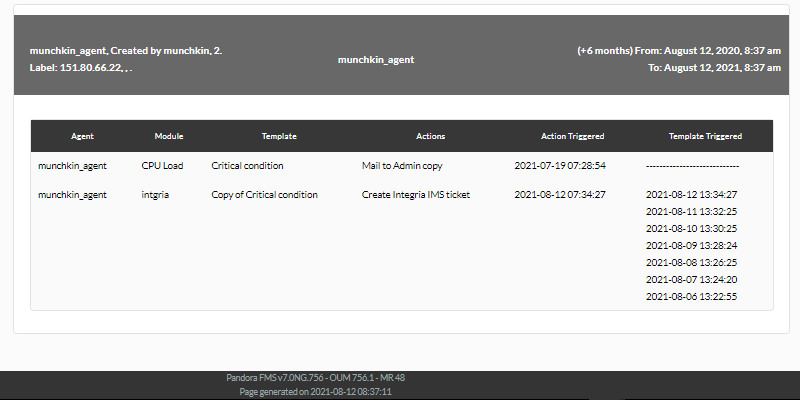
Shows a list (Alert report agent) with the alerts launched by the agents of the report group in the defined period.
The fields of this form are:
- Name: Name of the report. The following macros can be used:
_agent_: Name of the Agent that you have selected in the report element._agentdescription_: Description of the Agent that you have selected in the report element._agentgroup_: Agent group that you have selected in the report element._address_: Address of the Agent that you have selected in the report element._module_: Name of the Agent Module that you have selected in the report element._moduledescription_: Description of the Agent Module that you have selected in the report element.
- Label: Label that can be assigned to the element. The following macros can be used:
_agent_,_agentdescription_,_agentgroup_,_address_,_module_,_moduledescription_. - Time lapse: Time interval over which the report will be calculated (from the present moment).
- Agent: The control to choose the Agent for this item, type the first letters of the name and you will get a drop-down list.
Action Alert Report
Shows a list (Actions alert report) with the alerts launched by the modules of the report group in the defined period.
For this report to be displayed in the Command Center (Metaconsole) you must have event replication enabled, otherwise the report will always indicate that it has no data to display.
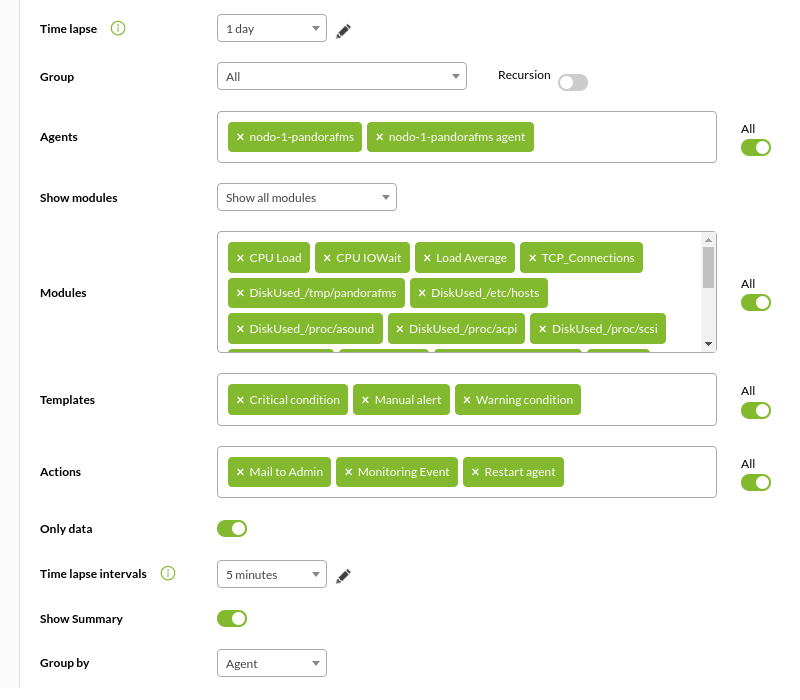
- Time lapse: Time interval over which the report will be calculated (from the present moment).
- Group: List that filters the agents that appear in the following field. It is not reflected in the report, it is just a form utility. Even if the person creating the report item does not explicitly belong to the EVERYONE group (ALL), they will still be able to assign the group ALL as a source of Agents for inventory.
- Recursion: To select the subgroups of the selected group(s).
- Show modules: Selector of all the modules or only those common to the previously selected agents.
Command Center (Metaconsole) will not be able to group or filter by templates.
- Only data: If it is activated, it will only show in the result the groups / modules / agents / templates that contain at least one triggered alert, if it is deactivated it will show them all.
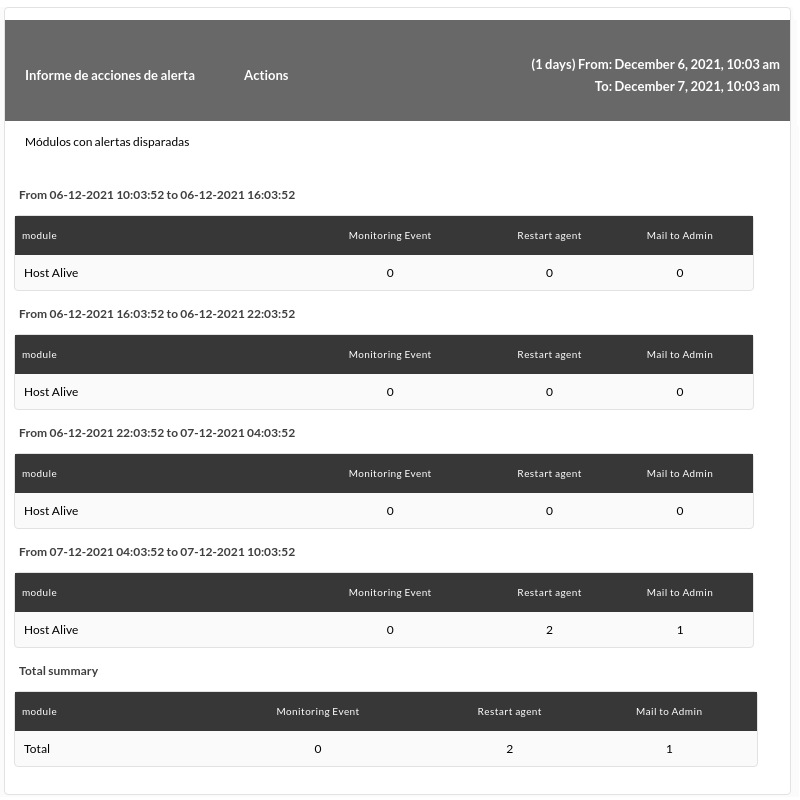
- Time lapse intervals: Time lapse intervals that generate tables. For example, if the reporting period is 24 hours (1 day) and you group by 6 hour intervals, the information will be displayed in four different tables ( 24/6=4 ).
- Show summary: To show or not a table of the totals of the required information.
- Group by: To group the report, either by group / agent / module / template.
In Command Center (Metaconsole) it will not be possible to group or filter by templates.
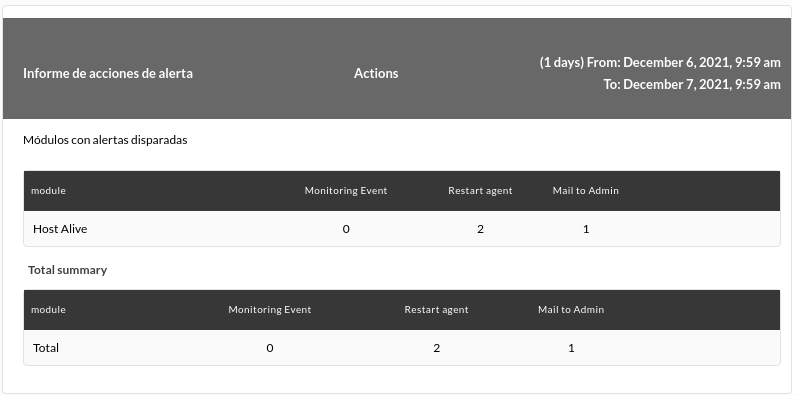
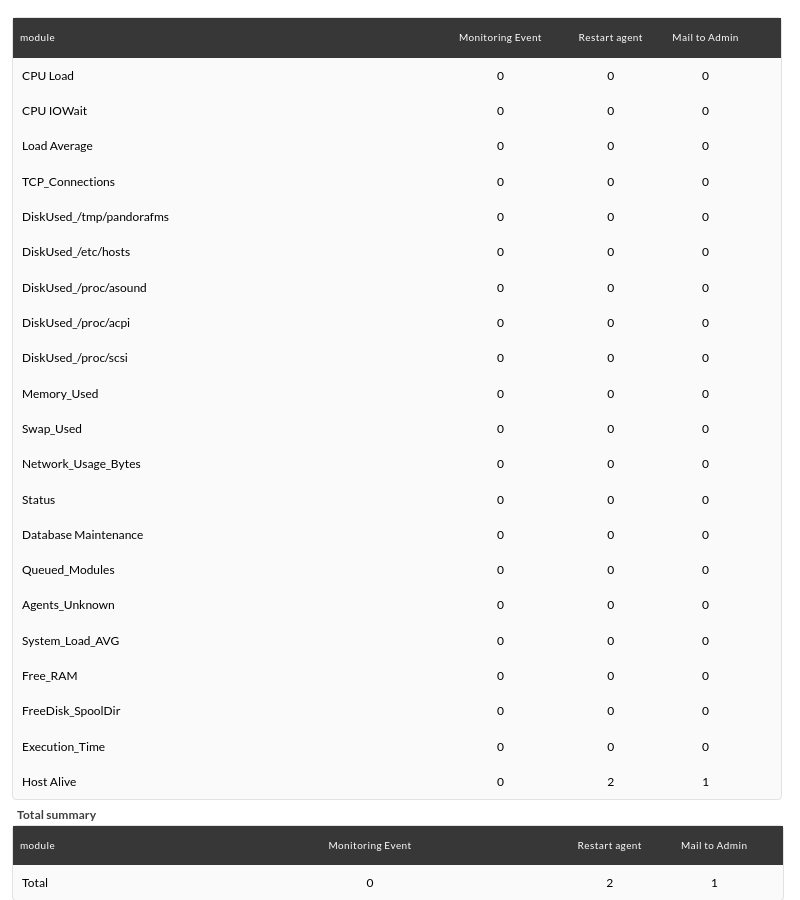
Examples:
Showing only the modules with triggered alert and its total.
Showing all modules with or without alert triggered and their total.
Showing 6 hour intervals:
Group Alert Report
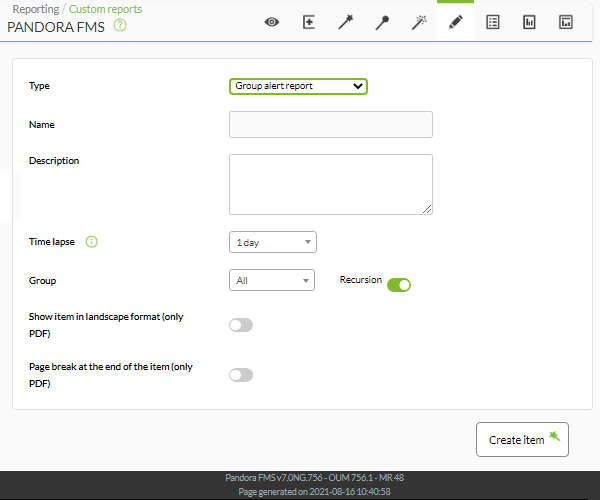
Shows a list (Group alert report) with the alerts launched on any element of the group defined in the report, in the defined period.
- Name: Name of the report; macros are disabled in this field.
- Time lapse: The backward time range over which the report will be produced (for example, one month from the chosen date).
- Group: Group on which the alert trigger information will be analyzed. Even if the person creating the alert report for a group does not explicitly belong to the ALL group (ALL), you will still be able to assign the group ALL as the source of group alerts.
- Recursion: Analyze the child groups of the defined group recursively.
Example:
Event Items
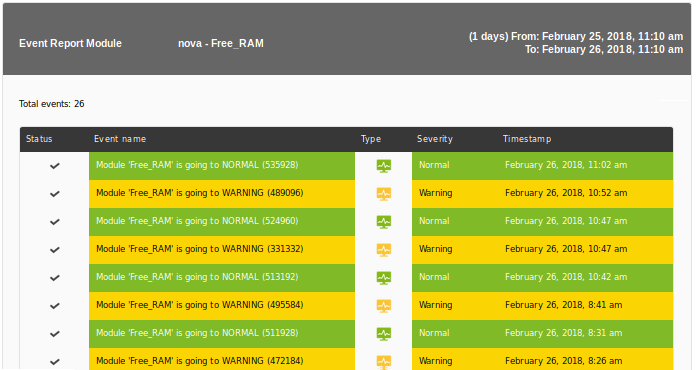
Module Event Report
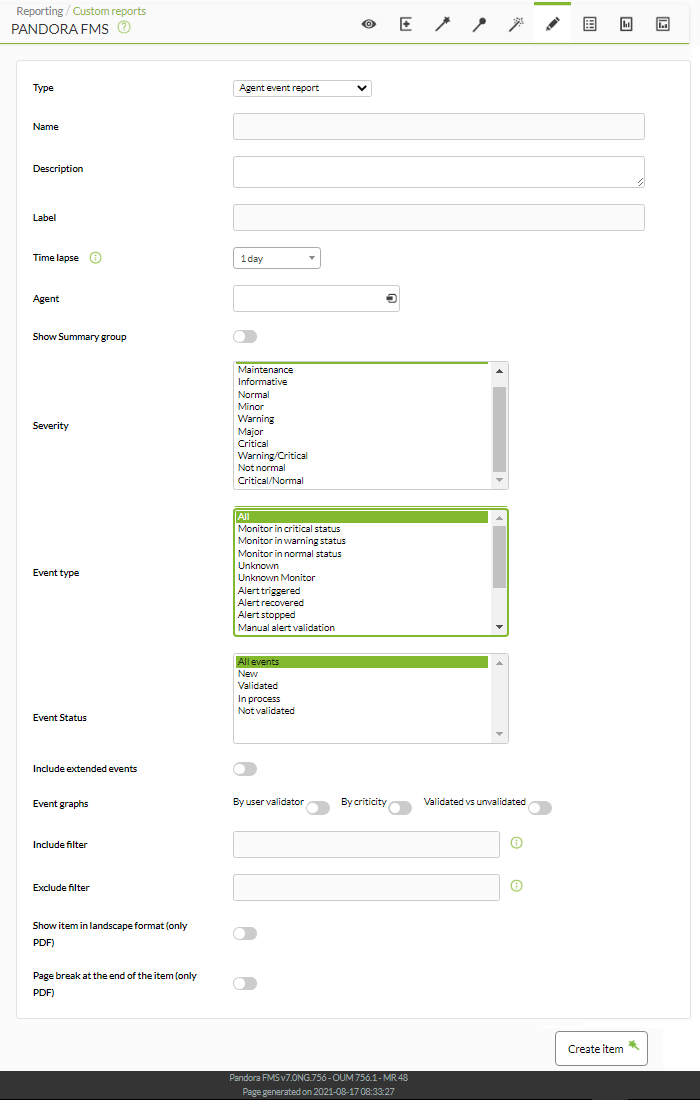
Shows a list (Module event report ) with the events that have occurred in the module of a selected agent, in the defined period.
- Name: Name of the report. The following macros can be used:
_agent_: Name of the Agent that you have selected in the report element._agentdescription_: Description of the Agent that you have selected in the report element._agentgroup_: Agent group that you have selected in the report element._address_: Address of the Agent that you have selected in the report element._module_: Name of the Agent Module that you have selected in the report element._moduledescription_: Description of the Agent Module that you have selected in the report element.
- Label: Label that can be assigned to the element. The following macros can be used:
_agent_,_agentdescription_,_agentgroup_,_address_,_module_,_moduledescription_. - Time lapse: Time interval over which the report will be calculated (from the present moment).
- Agent: The control to choose the Agent for this item, type the first letters of the name and you will get a drop-down list.
- Module: Drop-down list that is loaded dynamically with the Modules of the Agent selected in the previous control.
- Show Summary group: Show summary group (similar to agent event report).
- Severity: Select the events according to their severity (or select all of them with All).
- Event type: Select the events according to their type:
- Monitor in critical status: Monitor in critical status.
- Monitor in warning status: Monitor in warning status.
- Monitor in normal status: Monitor in normal status
- Unknown: Unknown.
- Unknown Monitor: Monitor in unknown state.
- Alert triggered: Alert triggered.
- Alert recovered: Alert recovered.
- Alert stopped: Alert stopped.
- Manual alert validation: Manual alert validation.
- Agent created: Agent created.
- Recon host detected: Network device detected with recon.
- System: System.
- Mistake.
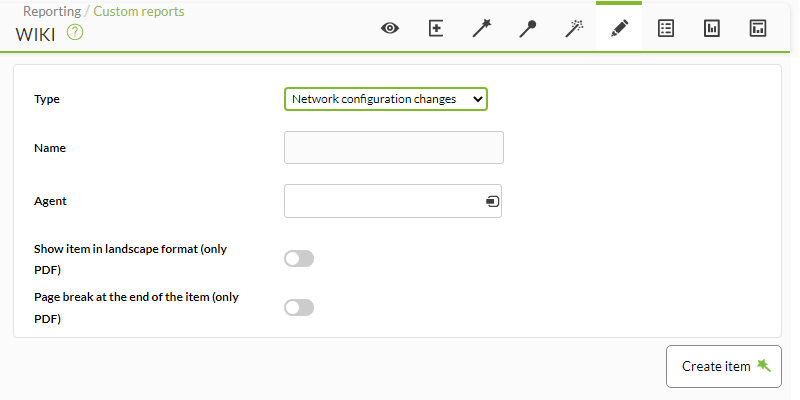
- Configuration change: Configuration change.
- Event status: Select the events according to their status (or select all of them with All events).
- Include extended events: Include extended events.
- Event graphs: Event graphs:
- By user validator: By user validator.
- By criticality: By priority.
- Validated vs unvalidated: Validated versus invalidated.
- Include filter:Include filter (free text search in event description)
- Exclude filter: Exclude filter (free text search in event description)
Example:
Agent Event Report
(Agent event report) Shows a list with the events that occurred in the selected agent, in the defined period.
- Name: Name of the report. The following macros can be used:
_agent_: Name of the Agent that you have selected in the report element._agentdescription_: Description of the Agent that you have selected in the report element._agentgroup_: Agent group that you have selected in the report element._address_: Address of the Agent that you have selected in the report element._module_: Name of the Agent Module that you have selected in the report element._moduledescription_: Description of the Agent Module that you have selected in the report element.
- Label: Label that can be assigned to the element. The following macros can be used:
_agent_,_agentdescription_,_agentgroup_,_address_,_module_,_moduledescription_. - Time lapse: Time interval over which the report will be calculated (from the present moment).
- Agent: The control to choose the Agent for this item, type the first letters of the name and you will get a drop-down list.
- Show Summary group: Show group summary.
- Severity: Select the events according to their severity (or select all of them with All).
- Event type: Select the events according to their type:
- Monitor in critical status: Monitor in critical status.
- Monitor in warning status: Monitor in warning status.
- Monitor in normal status: Monitor in normal status
- Unknown: Unknown.
- Unknown Monitor: Monitor in unknown state.
- Alert triggered: Alert triggered.
- Alert recovered: Alert recovered.
- Alert stopped: Alert stopped.
- Manual alert validation: Manual alert validation.
- Agent created: Agent created.
- Recon host detected: Network device detected with recon.
- System: System.
- Mistake.
- Configuration change: Configuration change.
- Event status: Select the events according to their status (or select all of them with All events).
- Include extended events: Include extended events.
- Event graphs: Event graphs:
- By user validator: By user validator.
- By criticality: By priority.
- Validated vs unvalidated: Validated versus invalidated.
- Include filter:Include filter (free text search in event description)
- Exclude filter: Exclude filter (free text search in event description)
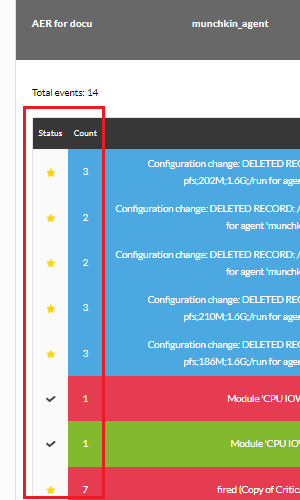
Example:
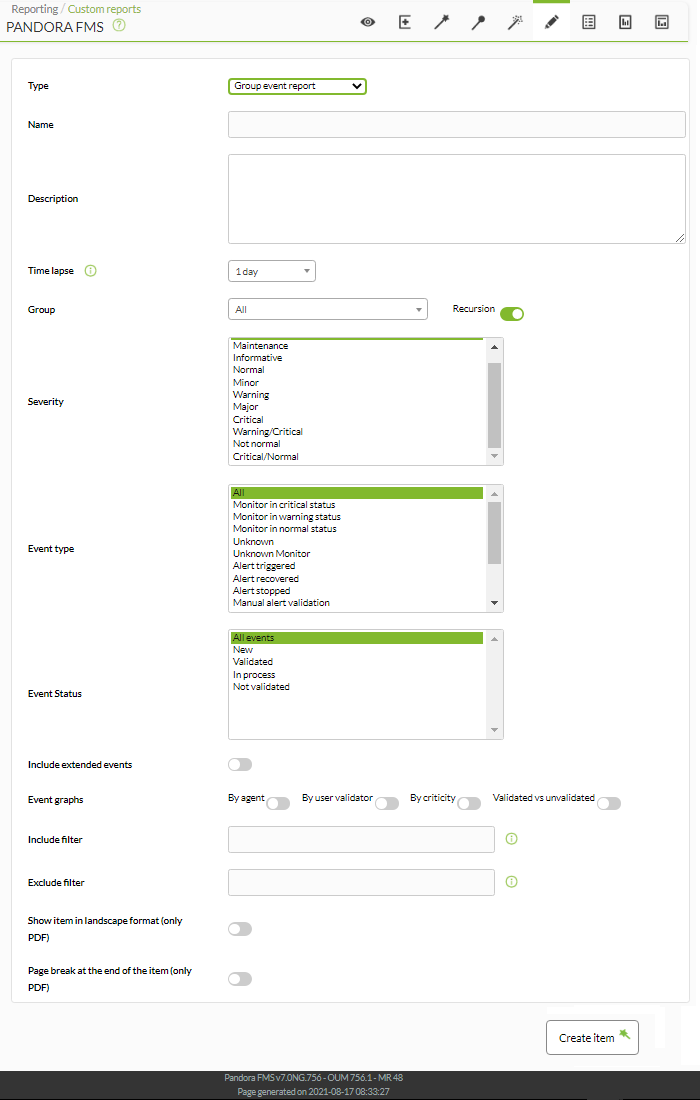
Group Event Report
Shows a list with the events that occurred in the agents of the selected group, in the defined period (Group event report).
- Name: Name of the report; macros are disabled in this field.
- Time lapse: Time interval over which the report will be calculated (from the present moment).
- Group: Combo to select the group. Even if the person creating the event report item does not explicitly belong to the EVERYONE group (ALL), they will still be able to assign the group ALL as the source of group events.
- Severity: Select the events according to their severity (or select all of them with All).
- Event type: Select the events according to their type:
- Monitor in critical status: Monitor in critical status.
- Monitor in warning status: Monitor in warning status.
- Monitor in normal status: Monitor in normal status
- Unknown: Unknown.
- Unknown Monitor: Monitor in unknown state.
- Alert triggered: Alert triggered.
- Alert recovered: Alert recovered.
- Alert stopped: Alert stopped.
- Manual alert validation: Manual alert validation.
- Agent created: Agent created.
- Recon host detected: Network device detected with recon.
- System: System.
- Mistake.
- Configuration change: Configuration change.
- Event status: Select the events according to their status (or select all of them with All events).
- Include extended events: Include extended events.
- Event graphs: Event graphs:
- By user validator: By user validator.
- By criticality: By priority.
- Validated vs unvalidated: Validated versus not validated.
- Include filter:Include filter (free text search in event description)
- Exclude filter: Exclude filter (free text search in event description)
Example:
Inventory Items
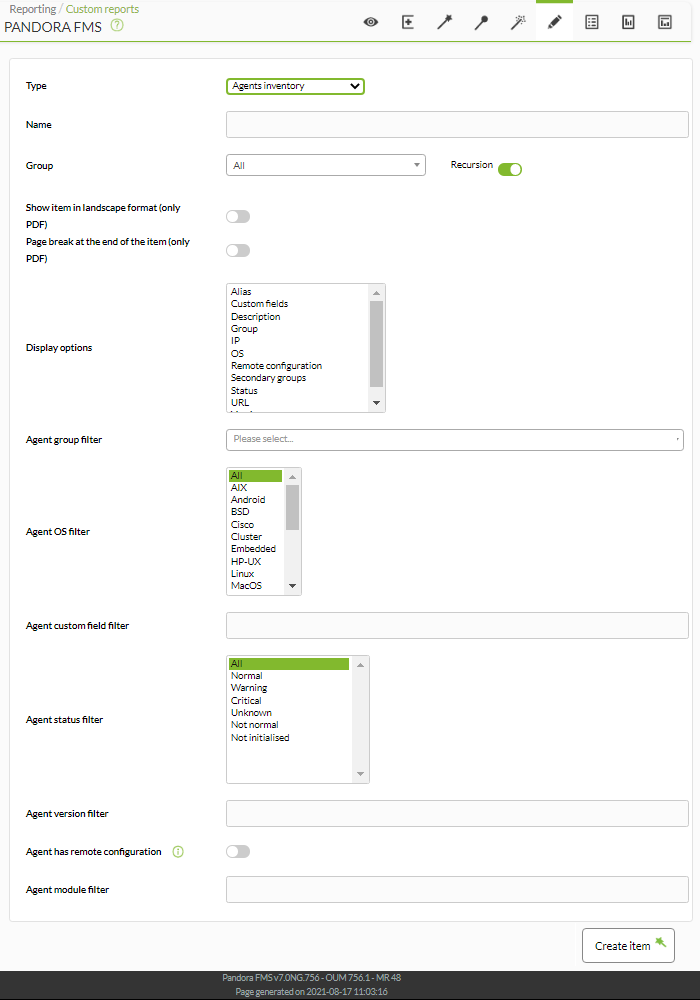
Agent Inventory
Agents inventory lists the registered agents and has several filters to select in a very detailed way, even at module level.
- Name: Name of the report; macros are disabled in this field.
- Group: Allows you to select groups of agents. To display absolutely all agents, select All.
- Display options: Allows you to select the report columns with the characteristics of each agent.
- Agent group filter: Allows you to select a group and its respective agents.
- Agent OS filter: Allows you to filter by operating system of each agent.
- Agent status filter: Allows you to filter the agents by their status.
- Agent version filter: Allows you to filter the agents by their software version. Example filtering the expression
756and selecting the fieldVersionin Display options:
- Agent has remote configuration: Allows you to filter the agents that have remote configuration.
- Agent module filter: Allows filtering by agent modules.
Example:
Module Inventory
Version 765 or later.
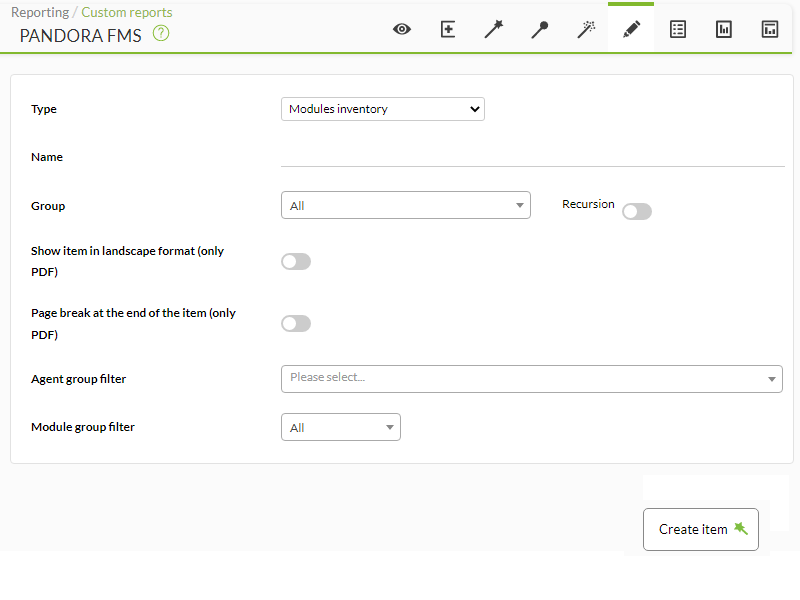
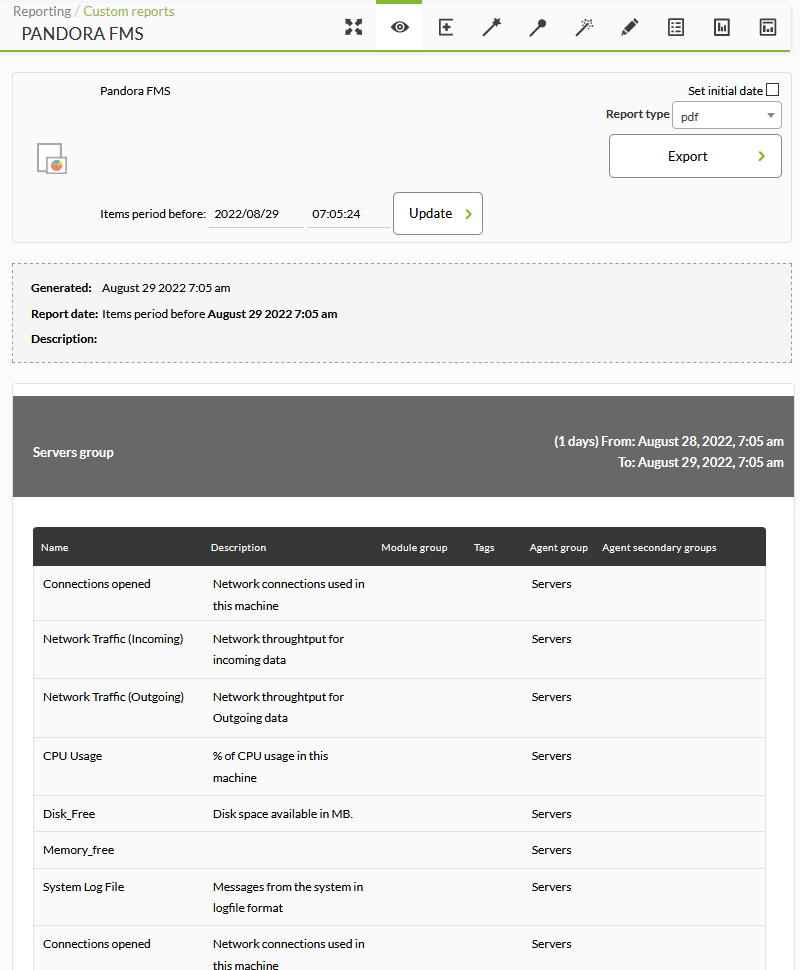
Modules inventory lists the registered modules and has filters to select in detail, even at the module group level, showing name, description, module group, labels, agent group and secondary agent group.
- Name: Name of the report.
- Agent group filter: Allows you to select by groups of agents. To display absolutely all agents, select All.
- Module group filter: Allows you to filter by groups of modules.
Example:
Inventory
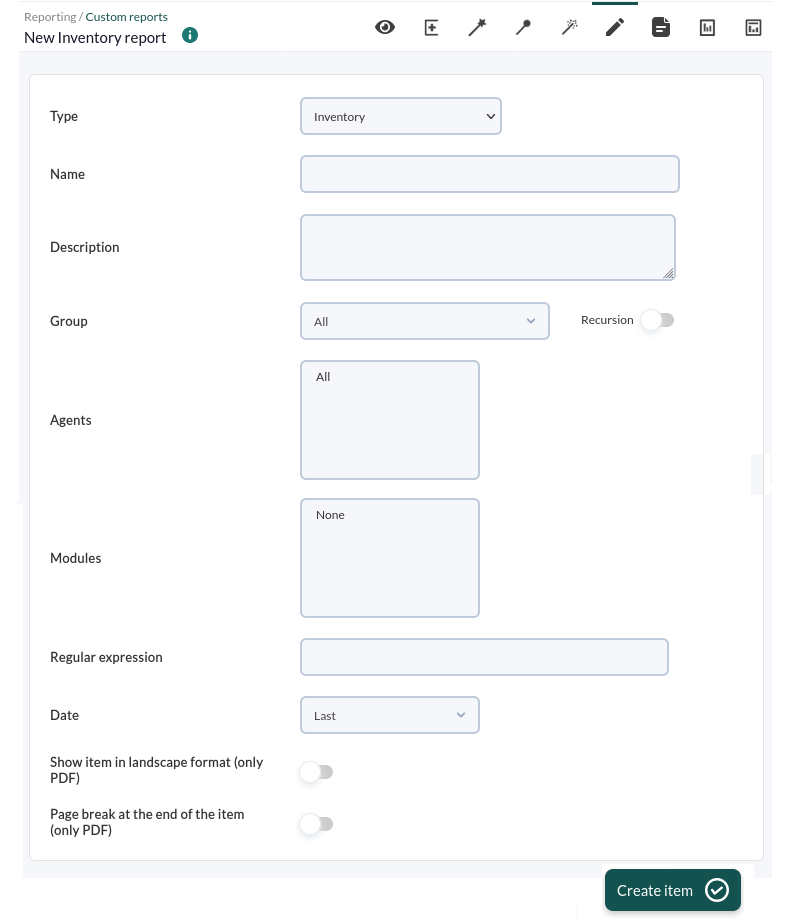
This item (Inventory) shows the selected inventory of one or several machines corresponding to a specific moment or the last known one.
The fields of this form are:
- Name: Name of the report; macros are disabled in this field.
- Group: Combo that filters the agents that appear in the following field. It is not reflected in the report, it is just a form utility. Even if the person creating the report inventory item does not explicitly belong to the EVERYONE group (ALL), they will still be able to assign the ALL group as a source of Agents for inventory.
- Recursion: To select the subgroups of the selected group(s).
- Agents: Agents ofthe machines from which inventory will be taken. Only agents with inventory modules will appear.
- Modules: The inventory modules common to the selected agents.
- Regular expression: Expression that allows you to filter by keywords in the different fields of the report.
- Date: Date of the displayed data. If Last is chosen, the last known inventory data of the selected modules will be taken.
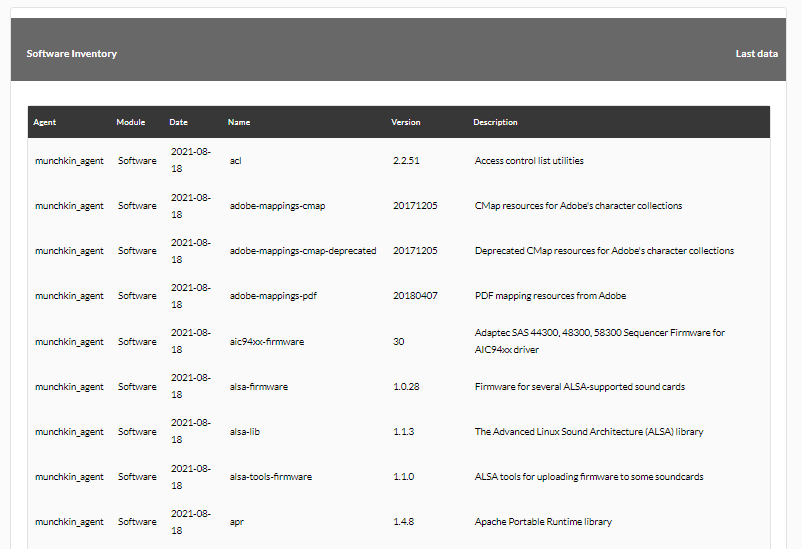
Example with the parameters selected in the list above (the list is longer than the one shown here):
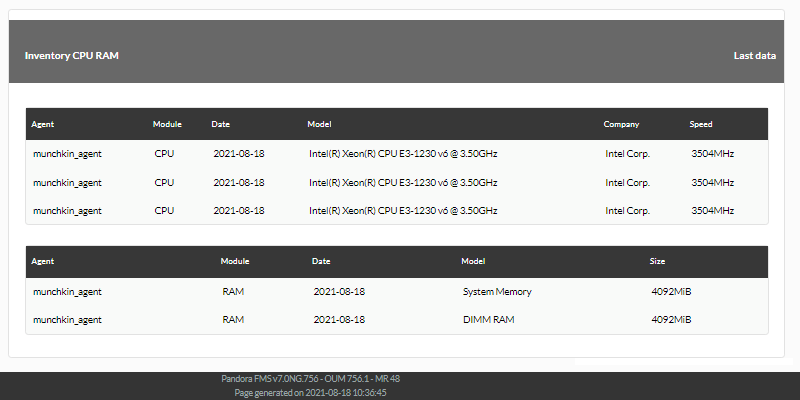
Example showing CPU and RAM:
Change Inventory
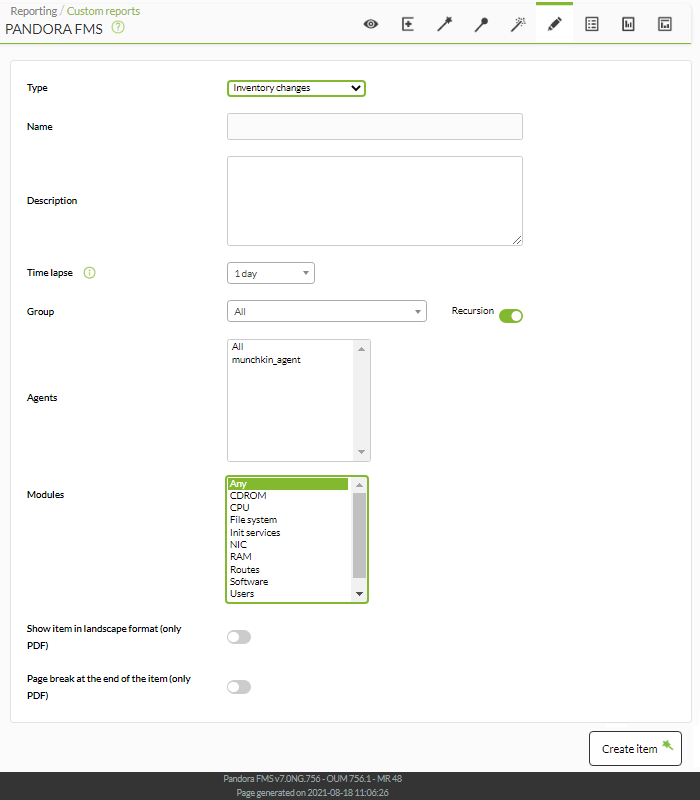
This item (Inventory changes) shows the inventory changes registered in one or several machines within a selected period.
- Name: Name of the report; macros are disabled in this field.
- Time lapse: Period in which the changes were recorded.
- Group: Combo that filters the agents that appear in the following field. It is not reflected in the report, it is just a form utility. Even if whoever is creating the inventory change report item does not explicitly belong to the EVERYONE group (ALL), they will still be able to assign the group ALL as a source of Agents with change in their inventory.
- Agents: Agents of the machines from which the inventory will be taken. Only agents with inventory modules will appear.
- Modules: The inventory modules common to the selected agents.
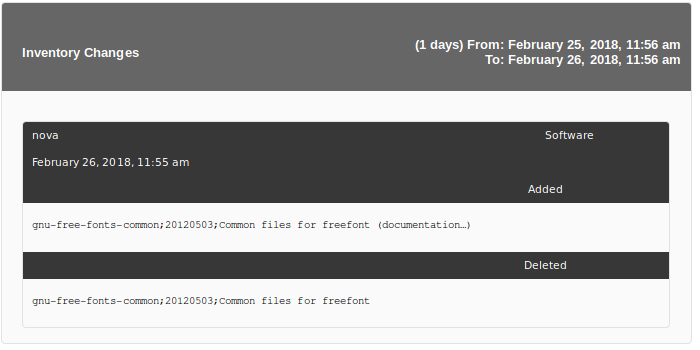
The data for this item is collected from inventory change events. If the item is too big, you can remove some of those events manually to reduce it.
Example:
Configuration Items
Agent Configuration
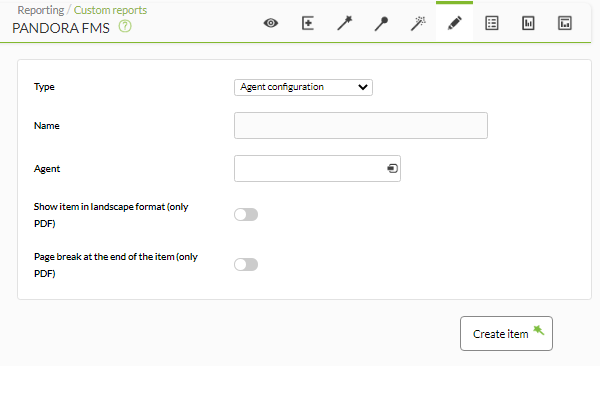
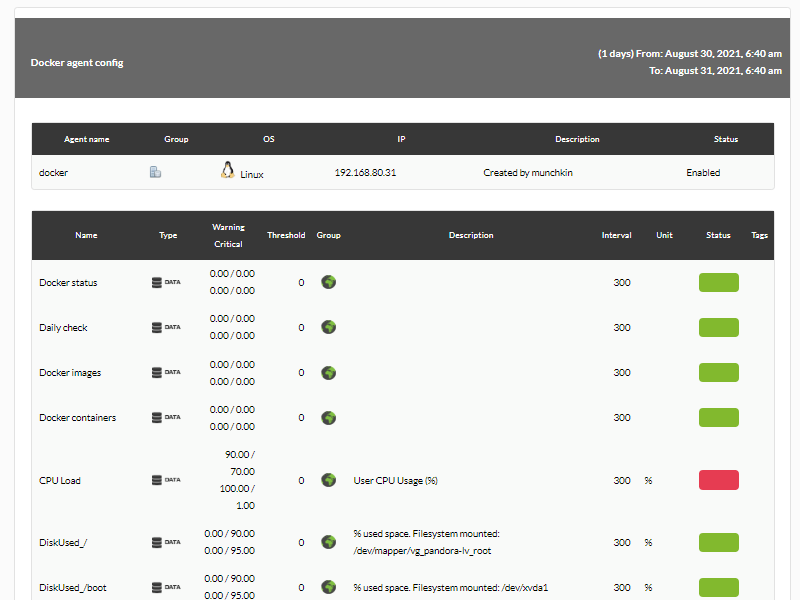
This type of report (Agent configuration) allows you to display a snapshot of the selected agent's status:
- Name: Name of the report. The following macros can be used:
_agent_: Name of the Agent that you have selected in the report element._agentdescription_: Description of the Agent that you have selected in the report element._agentgroup_: Agent group that you have selected in the report element._address_: Address of the Agent that you have selected in the report element._module_: Name of the Agent Module that you have selected in the report element._moduledescription_: Description of the Agent Module that you have selected in the report element.
Example:
Group Settings
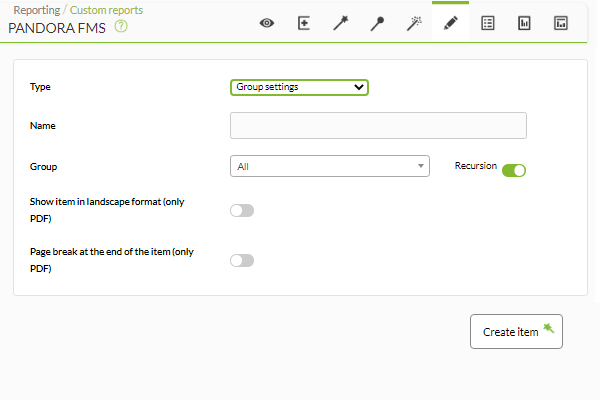
This type of report (Group settings) will display a snapshot of the status of the agents that belong to the selected group:
- Name: Name of the report; macros are disabled in this field.
Even though whoever is creating the group options item does not explicitly belong to the EVERYONE group (ALL), they will still be able to assign the group ALL as the source of Group Agents.
Example:
NetFlow Items
NetFlow Area Chart
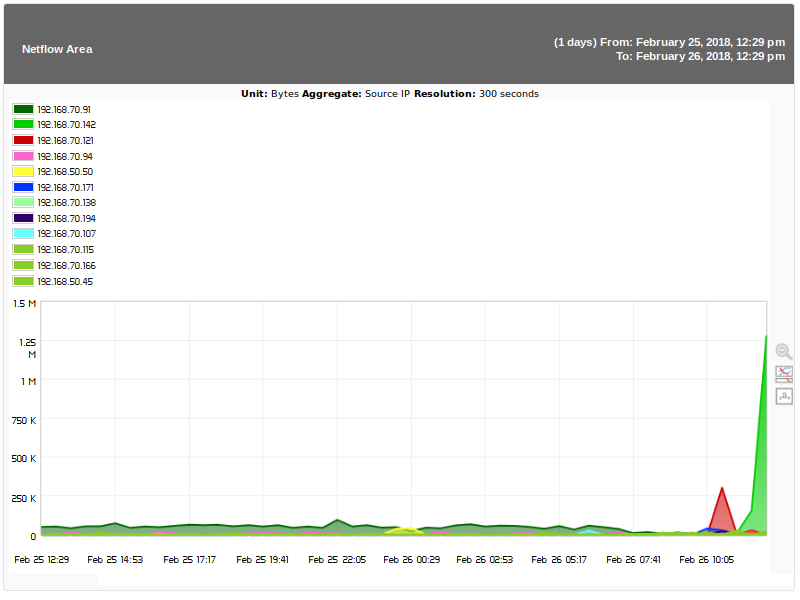
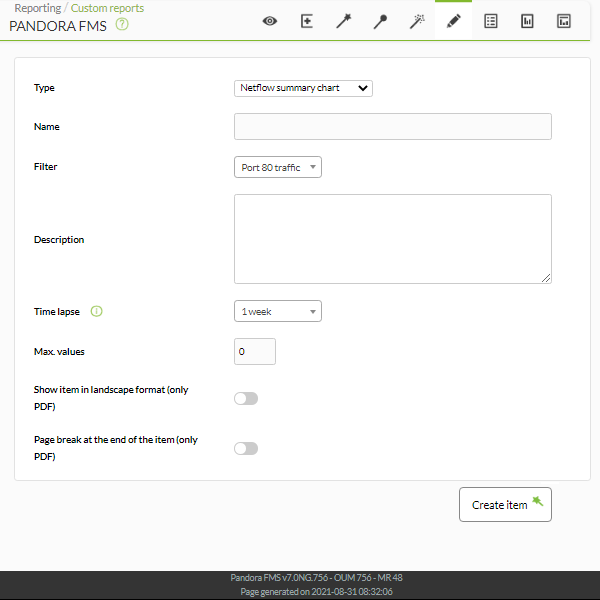
This report element (NetFlow Area Chart) will display a graph with traffic analysis using filters already created in the NetFlow view.
- Name: Name of the report; macros are disabled in this field.
- Time lapse: Time interval over which the report will be calculated (from the present moment).
Example:
NetFlow Data Table
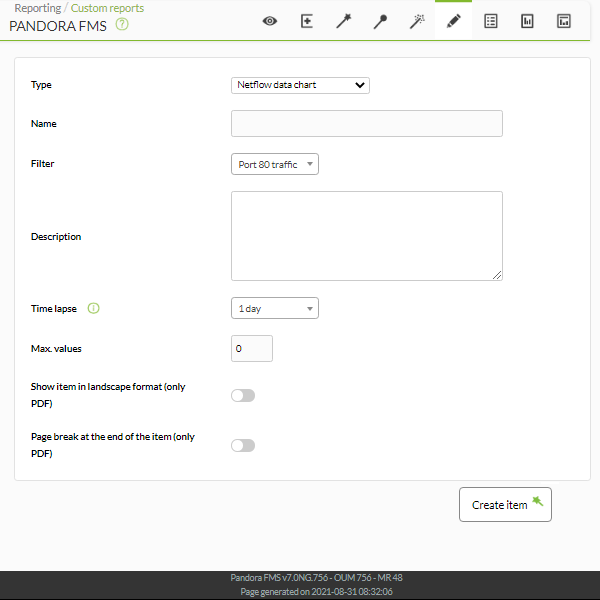
This element (NetFlow Data Chart) shows the data obtained by applying the NetFlow filter indicated by the user in a table ordered by date and origin.
- Name: Name of the report; itthe machines from which inventory will be taken. Only agents with inventory modules will appear.
- Modules: The inventory modules common to the selected agents.
- Regular expression: Expression that allows you to filter by keywords in the different fields of the report.
- Date: Date of the displayed data. If Last is chosen, the last known inventory data of the selected modules will be taken.
Example with the parameters selected in the list above (the list is longer than the one shown here):
Example showing CPU and RAM:
NetFlow Summary Table
This report element (NetFlow Summary Chart) will show a table with summary information of the traffic that matches the NetFlow filter indicated in the Filter parameter .
- Name: Name of the report; macros are disabled in this field.
- Time lapse: Time interval over which the report will be calculated (from the present moment).
Example
First N NetFlow Connections
Top-N connections (First N connections) is a table showing the TOP-N connections between Source IP - Destination IP pairs, based on the traffic between these IP addresses (the sum of the percentages of the N elements in the table is not going to be a hundred because there are many other pairs of src/dst connections that are not in the table).
Top-N connections is a table that shows the connections between pairs of Source IP - Destination IP addresses, based on the traffic between these IP addresses.
A filter, time period and type are chosen. The filters required for that report element are those of the Live view.
By default it is selected grouped by port destination, Show aggregate by destination port (values fmt:%sap,%dap,%ibyt,%ipkt,%bps) and you can also choose by source and destination traffic Show InBound/Outbound traffic per SrcIP/DestIP (values fmt:%sap,%dap,%ibyt,%obyt,%ipkt,%opkt,%bps)
- Display graph: Enables graphical display, enabled by default.
- Display summary table: Displays summary totals, enabled by default.
- Display data table: Displays the values themselves in a table, enabled by default.
The sum of the percentages of the N elements of the table not necessarily will be one hundred because there may be other pairs of connections src/dst.
Log Items
Log report
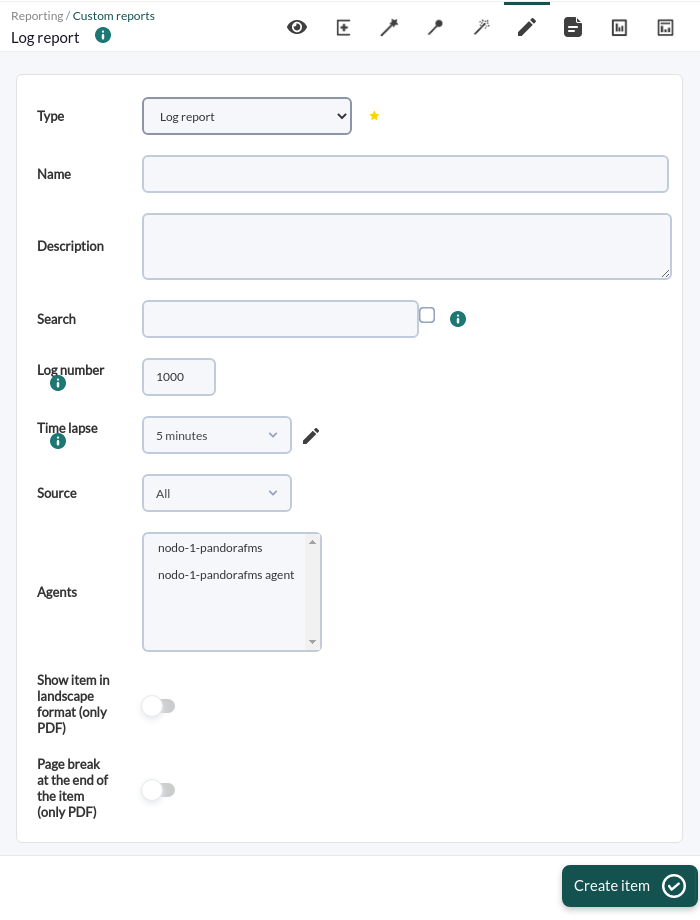
This type of report (Log report) will show the log entries in the selected period.
- Name: Name of the report. The following macros can be used:
_agent_: Name of the Agent that you have selected in the report element._agentdescription_: Description of the Agent that you have selected in the report element._agentgroup_: Agent group that you have selected in the report element._address_: Address of the Agent that you have selected in the report element._module_: Name of the Agent Module that you have selected in the report element._moduledescription_: Description of the Agent Module that you have selected in the report element.
- Search: Text string to search for.
- Log number: Maximum number of log block entries to display when generating this report.
- Time lapse: Time interval over which the report will be calculated (from the present moment).
- Source: Source of logs.
- Agents: Agents for filtering.
Example:
Log report by period
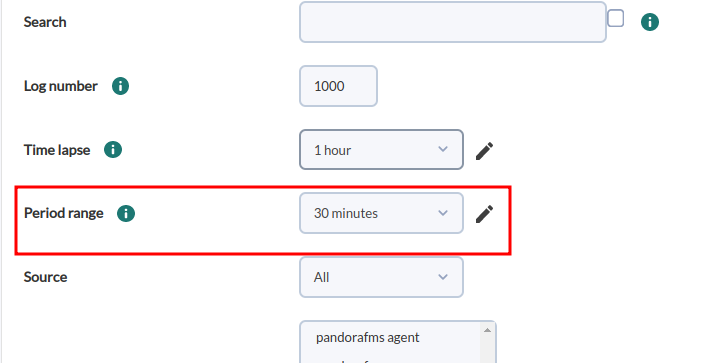
This type of report (Log report by period) is based on Log report with the difference that a period of time can be set for the data ( Period range).
A unique index must be generated daily for each instance of Pandora FMS in Elasticsearch, otherwise no data will be displayed. See the topic “Monitoring and collecting logs”.
Permission Report Items
User Permissions Report
Allows you to select users or user groups and list their names, groups and permissions.
- Name: Name of the report; macros are disabled in this field.
- User: Allows you to select and filter the users.
- Select by group: Allows you to select one or more groups and their users. If you activate this option User (previous point) it will no longer be available.
Example:
NCM Reports
Security hardening
Security hardening reports are only available with the plugin bearing the same name installed and running.
Top-N agents with the worst score
This report shows the last scores of the top ten agents (10 by default) and is sorted from the worst score to the best score and can be filtered by group (with or without Recursion subgroups).
Top-N most frequent failed checks
In this report, the last data of all agents are grouped (by default or you may select a group) and by type of check and the checks with the highest number of failures among all the agents are shown. It works in the Command Center (Metaconsole) in an analogous way, only that the agents of all the nodes are grouped. The number of checks to be shown, by default, is 10.
Top-N checks failed by category
In this report, the latest data of all agents (or only the selected group) are grouped by categories and the categories with the highest number of failures among all agents are listed.
For the Command Center (Metaconsole) it is the same but node agents are grouped. The configurable parameters are: by group (All by default) and number of total categories to list (10 by default).
Vulnerabilities by category
In this report, a category is chosen and the failed and passed checks (optionally the skipped ones with the token Skipped) of all the agents in the selected group (All selected by default) will be grouped.
The result is displayed in a pie chart where the vulnerabilities are unique, i.e. if a check with the identifier “N” has failed in two different agents they are not added together, the result is 1.
Available categories:
- Access Control Management (selected by default).
- Account Management.
- Application Software Security.
- Audit Log Management.
- Continuous Vulnerability Management.
- Data Protection.
- Data Recovery.
- Email and Web Browser Protections.
- Inventory and Control of Enterprise Assets.
- Inventory and Control of Software Assets.
- Issue Response Management.
- Malware Defenses.
- Network Infrastructure Management.
- Network Monitoring and Defense.
- Secure Configuration of Enterprise Assets and Software.
- Security Awareness and Skills Training.
- Service Provider Management.
List of checks (agent)
This report lists the last checks of a selected agent filtered by category and their status: failed, approved, skipped or all (default selected option, All).
Available categories:
- Access Control Management (selected by default).
- Account Management.
- Application Software Security.
- Audit Log Management.
- Continuous Vulnerability Management.
- Data Protection.
- Data Recovery.
- Email and Web Browser Protections.
- Inventory and Control of Enterprise Assets.
- Inventory and Control of Software Assets.
- Issue Response Management.
- Malware Defenses.
- Network Infrastructure Management.
- Network Monitoring and Defense.
- Secure Configuration of Enterprise Assets and Software.
- Security Awareness and Skills Training.
- Service Provider Management.
Scoring by date
This report shows the last scores of the agents of the selected group (or All) within the selected time range.
It always takes the last score of each agent within the time range, i.e. if a range of one month is set, the last score of the agents within that month will be searched.
Displaying items with extended history data can have an impact on system performance. We do not recommend that you use intervals longer than 30 days, especially if you combine several of them in a report, dashboard or visual console.
Evolution
This report shows a global evolution of Security hardening by averaging the tests passed and those that failed, grouped by day, of all the agents or those within the selected group with the last 11 dates to avoid overflowing the graph.
The minimum recommended period is every 7 days when the plugin is activated, so if you run it 4 times a month, you will get better results than doing a monthly grouping.
In the Command Center (Metaconsole), the average of all the agents of al nodes is made, they are not separated.
Vulnerabilities
Severity graph bar
- This report allows filtering by agent group (Group) and has the option to include subgroups by activating Recursion.
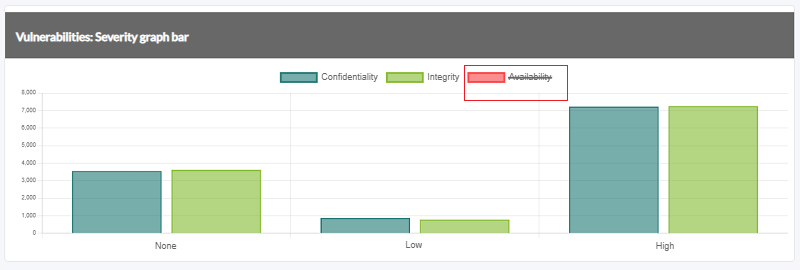
It displays a report of features grouped into Confidentiality, Integrity, Availability of the selected group(s) and their severity score (none, low or high).
Once displayed on the screen (HTML option) you may click on any of the features to show or hide these bars.
Attack complexity doughnut chart
- This report allows filtering by agent group (Group) and has the option to include subgroups by activating recurrence (Recursion button).
It displays an attack complexity report grouped into low, medium and high complexity (Low, Medium and High) of the selected group(s) and their respective score.
Once displayed by screen (HTML option), you may click on any of the complexities to show or hide said bars.
By packages in pie chart
- This report allows filtering by agent group (Group) and has the option to include subgroups by activating recurrence (Recursion button).
It displays a report of vulnerabilities in a pie chart and grouped by software packages installed on the monitored devices of the selected group(s) and their score.
Once displayed on the screen (HTML option), you may click on any of the packages to show or hide these bars.
Detailed security report
This report allows you to see each agent with its key information: Operating system and version installed, group, security monitoring status, vulnerability, among other relevant data.
- You may filter by agent groups, even recursively (Recursion option in Group), by default it shows all groups (All).
- Secmon status (Security monitoring status): It allows filtering by security monitoring status, Warning) and Critical status, by default all statuses are shown (All).
- Security hardening score: It allows filtering by percentage value, in steps of 10 units, according to the security score. By default it shows all percentages (All), for agents that have not yet been assigned a score, you should always use this option.
- Vulnerabilities status: It filters by vulnerability status, Warning and Critical status, by default all statuses are shown (All).
Vulnerabilities of agent
The report allows to choose only one agent to show the detected vulnerabilities. In the following options, when creating a report item, (All) is selected by default in all the options of each list.
- Package: After selecting an agent and after a few seconds, a list of packages detected with vulnerabilities (if any) for that agent will be displayed. Only one package or all packages can be selected.
- Severity: Detection severity grouped into None, Low, and High.
- Attack Complexity: Attack complexity grouped into Low and High.
- Privileges Required: Privileges required to perform the attack grouped into None, Low, and High.
- User Interaction: If the attack requires interaction by the attacked user, grouped into None and Required.
- Attack vector: The form of attack grouped into Adjacent network, Local, Network and Physical.
The most important information of the report is described below:
- Name: Name of the software package with detected vulnerability.
- CVE: Identifier assigned in the vulnerability database.
- Version: Affected version(s).
- Score: Vulnerability score.
- Detection time: Date and time when it was detected by PFSM that the installed version falls within the scope of the vulnerability.
- Severity: Vulnerability severity for the installed version.
Top-N agents with more risk
The report allows to show the most risky 10 agents.
- It allows filtering by agent group, by default All.
- The default maximum number of agents displayed (Max items) is ten.
Top-N common vulnerabilities
This report shows the top 10 vulnerabilities (CVE identifier) most frequently present in agents (sorted from highest to lowest number of agents).
- It can be filtered by agent group and optionally with recursion (subgroups), by default All.
- The maximum number of vulnerabilities displayed (Max items) is ten (default) and may be changed as needed.


 Home
Home


