Oracle Database Monitoring
Easily control Oracle with Pandora FMS from the Discovery Server
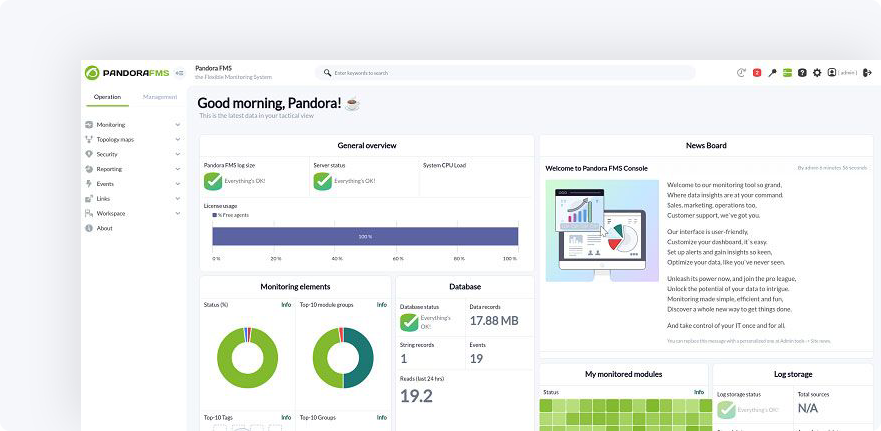
Monitor lots of metrics from an intuitive web interface. Get metrics from any Oracle database remotely from a single point without installing anything in the vSphere environment.
Comprehensive and Efficient Supervision

Comprehensive Monitoring
Remotely connect to any Oracle database for detailed performance metrics, allowing you to measure response times and ensure optimal performance.

Real-Time View
Know the status of your Oracle databases at all times to make fast and effective decisions.

Custom Report Generation
Combine and generate graphs and performance reports from different databases for detailed analysis and informed decision-making.

Instant Alerts
Receive concise and immediate alerts through email, SMS, Telegram, or other chat tools to keep you informed of any anomalies.

Multi-Database Management
Manage different databases with custom metrics and intervals based on their criticality, making it easier to manage large infrastructures.

Segmented Visibility
It provides segmented visibility to different groups or customers for more efficient and custom management.

Custom and Quick Setup
Configuring a monitoring task for Oracle DB from Pandora FMS is very simple.
1. Select Oracle Application
Launch the wizard by selecting the Oracle app.
2. Add the Required Parameters
Enter the required parameters, such as the database connection string and user credentials. You may add more than one connection string separating them by commas, thus allowing you to monitor multiple databases with the same configuration and credentials.
3. Select the Metrics
From the user interface, easily choose from several options of predefined metrics to monitor or define custom queries for this task.
4. See Discovery Task List
At the end of the wizard, you’ll be able to see a list of all scheduled Discovery tasks and the status of each one.
5. Summary of Execution
In addition, you will be able to see in detail the summary of the execution in a simple way.

Clear and Accurate Results
Running this task will return different results depending on the metrics enabled in the monitoring section or if custom metrics were defined.
Metrics
If engine_uptime is enabled
| restart_detection | It will be 0 if an unexpected restart was detected, and 1 if this is not the case. When a server restarts unexpectedly, there can be an interruption in access to the database and transactions or data that are not properly saved may be potentially lost. |
If query_stats is enabled
| queries: select | Number of SELECT queries. SELECT queries are used to retrieve data from the database. Monitoring SELECT queries allows you to evaluate query efficiency and index optimization. By identifying slow or inefficient SELECT queries, you may take steps to improve their performance, such as adding appropriate indexes, optimizing queries, or adjusting server configuration. |
| queriers: update | Number of UPDATE queries. UPDATE queries are used to modify existing data in the database. Monitoring UPDATE queries is important to assess the frequency and efficiency of data updates. You may identify UPDATE queries that affect a large number of rows or have a significant impact on server performance. This allows you to optimize queries, double check table structure or take steps to reduce the load generated by updates. |
| queries: delete | Number of DELETE queries. DELETE queries are used to retrieve data from the database. Monitoring DELETE queries is useful for assessing the frequency and efficiency of data deletions. You may identify DELETE queries that affect a large number of rows or have a significant impact on server performance. This allows you to optimize queries, double check table structure or take steps to reduce the load generated by deletions. |
| queries: insert | Number of INSERT queries. INSERT queries are used to enter new data into the database. Monitoring INSERT queries allows you to assess the frequency and efficiency of data insertions. You may identify INSERT queries that generate a high load on the server or that could be causing performance issues. This allows you to optimize queries, double check table structure, or consider delayed insertion strategies to improve performance in high-concurrency environments. |
If analyze_connections is enabled
| session usage | Number of current connections regarding the total maximum connections. Monitoring session usage in SQL Server is important for optimizing performance, identifying blocking issues, improving security and auditing, and efficiently planning server resources. |
If cache_stats is enabled
| cache hit ratio (dictionary) | The dictionary cache ratio. The “Cache Hit Ratio (Dictionary)” refers to the proportion of Oracle dictionary data access requests solved using cached data compared to requests that require disk access. The Oracle Dictionary contains information about the database structure, items, metadata, and other important details. A high hit ratio indicates that most dictionary access requests are solved using cached data, which improves system performance by preventing disk access. |
| cache hit ratio (library) | The library cache ratio. The “Cache Hit Ratio (Library)” refers to the proportion of access requests to Oracle procedures, functions, and packages stored in the shared library cache. The shared library cache stores the compiled code of frequently executed SQL programs and queries. A high hit rate indicates that most requests are solved using cached code, which avoids the need to recompile and improves performance by reducing runtime. |
| cache hit ratio (buffer) | The buffer cache ratio. The “Cache Hit Ratio (Buffer)” refers to the proportion of Oracle dictionary data access requests solved using cached data compared to requests that require disk access. The buffer cache stores the data blocks that are read or modified frequently. A high hit rate indicates that most data access requests are solved using blocks stored in the buffer cache, reducing the need to access the disk and improving overall system performance. |
If check_tablespaces is enabled
| tablespace |
Use percentage in GB. It is important to monitor the “tablespace free” in Oracle to keep track of the amount of space available in the tablespaces. This allows you to proactively manage the growth of storage space and avoid insufficient space issues that may affect database functionality. When monitoring free tablespace, actions such as adding more storage space or making adjustments to settings can be taken to ensure that enough space is available. |
| tablespace |
Table status, 1 if online and 0 if not. Monitoring tablespace status in Oracle is critical to assessing the health and condition of tablespaces. It provides information on the structural integrity of tablespaces, including the existence of errors or corruption issues. By monitoring the tablespace status, you may detect problems early and take steps to fix them, such as restoring from backups or performing recovery tasks. This ensures database continuity and stability, preventing data loss or performance deterioration due to tablespaces issues. |
If fragmentation_ratio is enabled
| fragmentation ratio | The fragmentation ratio. The Fragmentation Ratio in Oracle Database is a value that indicates the amount of space wasted due to fragmentation in a data structure. A high Fragmentation Ratio indicates greater fragmentation and a greater waste of space, which may affect system performance. |
The plugin will also create a module for each custom query defined in the configuration file.
Configure and optimize Oracle remote environment monitoring with Pandora FMS
Pandora FMS not only facilitates Oracle integration and monitoring, but also offers advanced tools to manage your entire network infrastructure. Ensure optimal performance and efficient management of your devices with this powerful combination.


