Efficient Google Cloud Monitoring with Pandora FMS
Get full control over your instances and resources with Google Cloud
And it optimizes performance from a single centralized platform. Pandora FMS makes it very easy to monitor Google Cloud environments from the Discovery Server, allowing you to monitor virtual machines in the cloud in just a few clicks.
Why monitor Google Cloud?
Google Cloud Platform (GCP) offers a scalable, high-performance infrastructure, but without proper monitoring, you could face unexpected problems.

Real-time problem prevention
Detect critical states in your virtual machines and avoid operational interruptions.

Resource optimization
Monitor CPU, disk and network usage to ensure that your resources are being used efficiently.

Managed scalability
Plan the growth of your infrastructure by ensuring that available resources are adapted to future demands.

Multi-zone and multi-client management
Manage distributed and segmented environments with ease, even in different regions.
Why is Pandora FMS the best choice for monitoring Google Cloud?
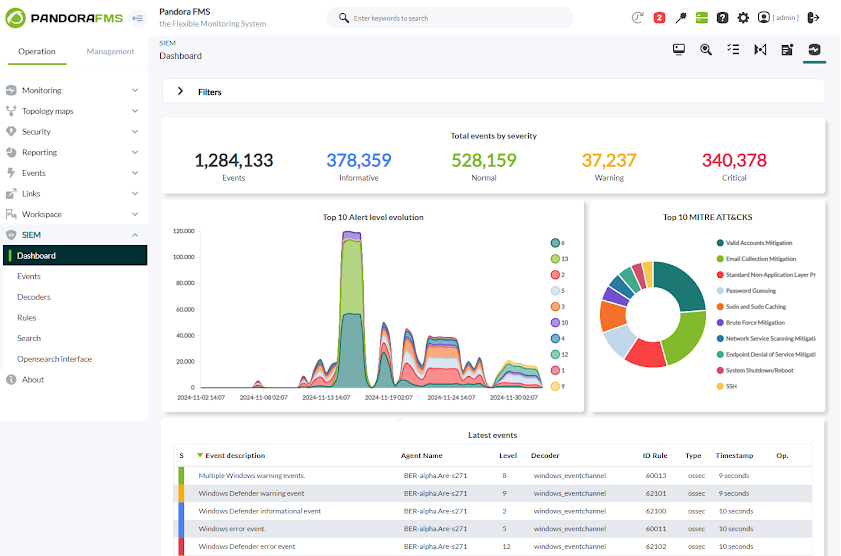
Efficient management of multiple Google Cloud environments
With Pandora FMS, you can manage multiple Google Cloud environments from different zones or clients simultaneously. It offers segmented visibility, allowing you to assign different levels of access to groups or clients to ensure a more flexible and efficient administration.
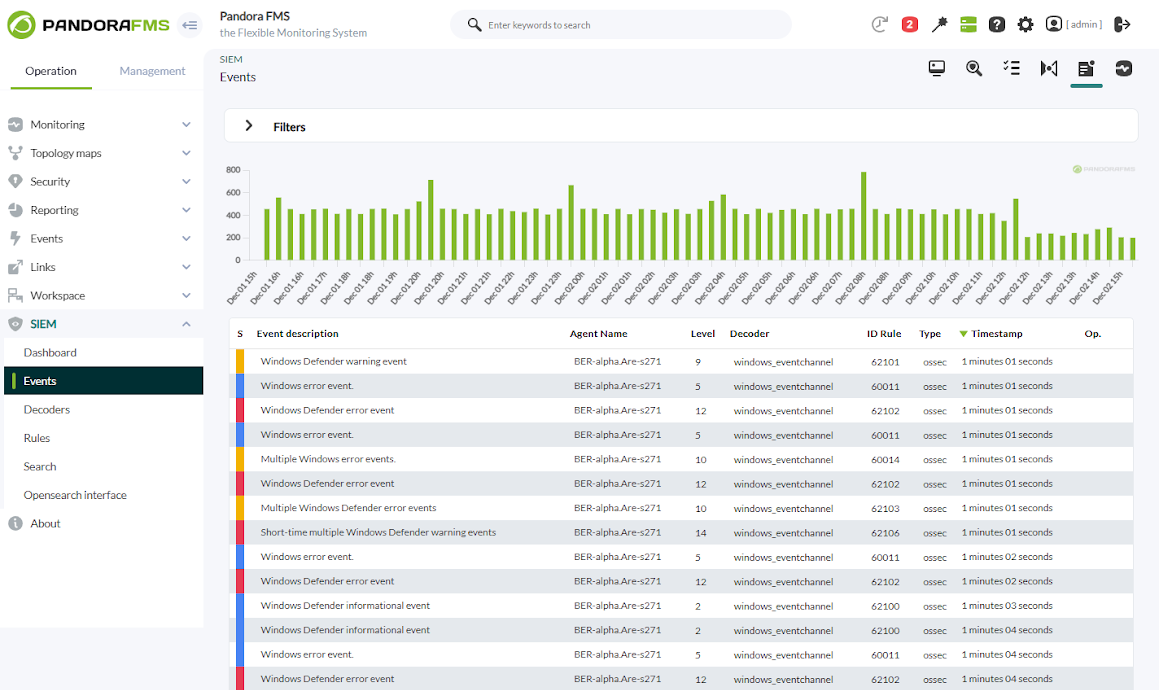
Predefined and custom metrics
Select from a wide catalog of predefined metrics for Google Cloud, such as CPU usage, disk, network, disk operations and instance status. Customize metrics according to your needs to ensure detailed monitoring tailored to your objectives.
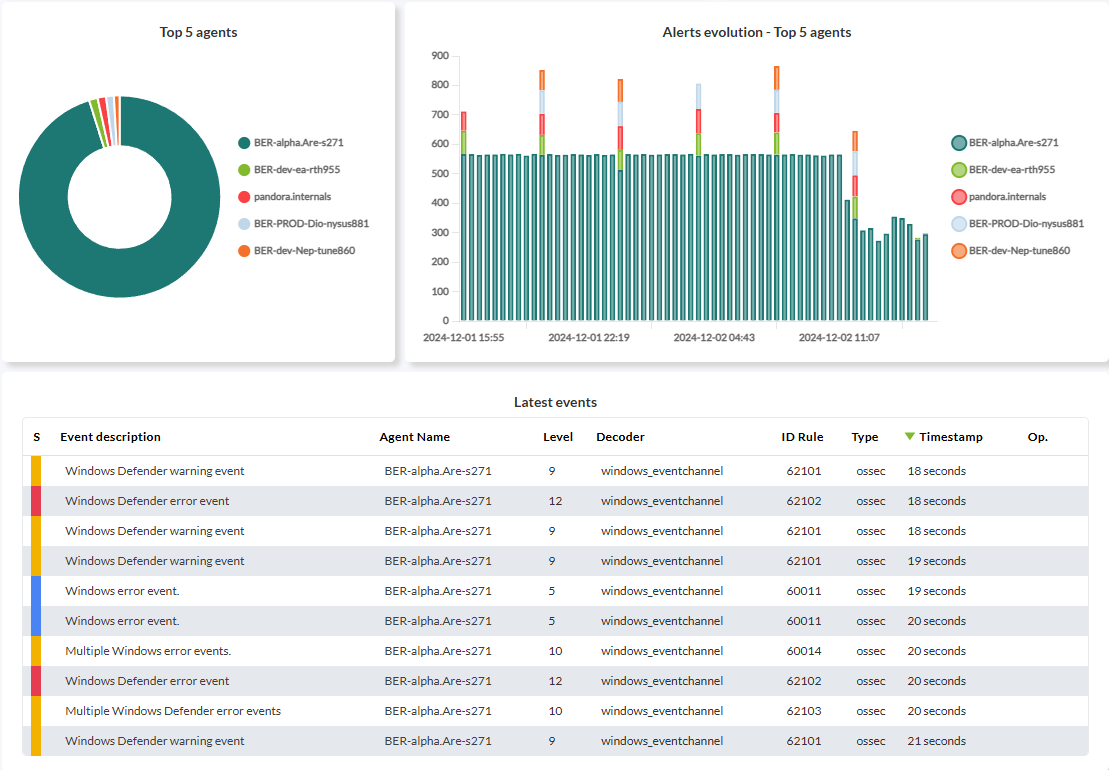
Real-time analysis and alerts
Generate combined reports and performance graphs for different Google Cloud elements, no matter in which region or zone they are located. Receive immediate and configurable alerts via email, SMS, Telegram or chat tools, making sure you react to any critical changes in your environment.
Centralized and adaptive control
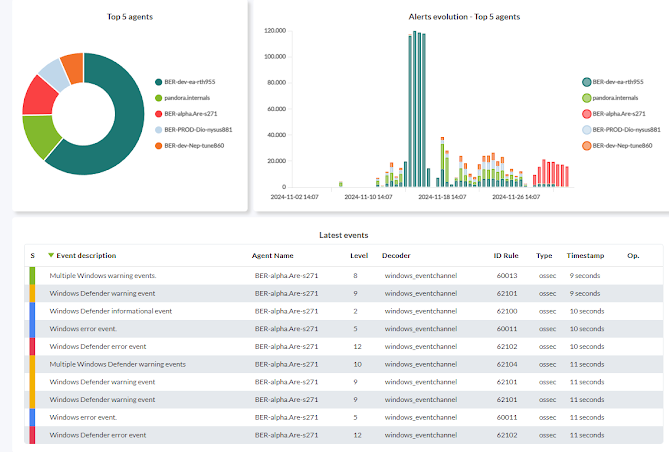
Centralize the monitoring of all your virtual machines and Google Cloud instances in a single intuitive interface. Pandora FMS allows you to combine data from other environments, such as Amazon Web Services, Microsoft Azure or local infrastructures, ensuring unified visibility for your entire IT operation.
Simple and efficient setup
Configuring Pandora FMS to monitor Google Cloud is quick and flexible. Follow these steps from the Discovery Server:
1. Select Google Cloud Compute Engine
Access the Discovery menu and choose the Google Cloud option to start the wizard.
2. Define basic parameters
Set a descriptive name for the task, assign a group for the generated agents and configure the monitoring interval to suit your needs.
3. Enter Google Cloud credentials
In this step, you will be prompted for the Google Cloud credentials configured in your environment, which are required to establish the connection. You will also be able to make additional settings:
-
Configure execution threads: Define the number of threads you want to assign to this task to optimize monitoring performance, especially in multi-instance environments.
-
Advanced options: Configure additional parameters, such as the use of a proxy for sending data or customizing the name of the agent that will store the statistics generated by the monitoring.
4. Configure specific areas and items
Browse a selection tree with two levels:
-
Dynamic areas: Automatically scans an whole area and monitor any resources added to it in the future.
-
Static elements: Selects specific resources within an area to perform fixed and specific monitoring.
This flexibility allows you to adjust monitoring based on the scope and expected changes in your infrastructure.
5. Customize metrics and queries
Select the predefined metrics you want to monitor or define custom queries to adjust the monitoring according to your specific objectives.
Review scheduled tasks
After completing the wizard, you will get a list of all scheduled Discovery tasks, where you will be able to check the status of each one. You will also have access to detailed execution summaries, with the possibility to perform manual updates in real time.

Monitoring your cloud environments is critical to maximize performance and ensure business continuity
Get metrics from your Google cloud environments remotely from a single point, without the need to deploy any components within the cloud itself. Ensure the performance and availability of your network with Pandora FMS.
Detailed results
Control every single part of your infrastructure
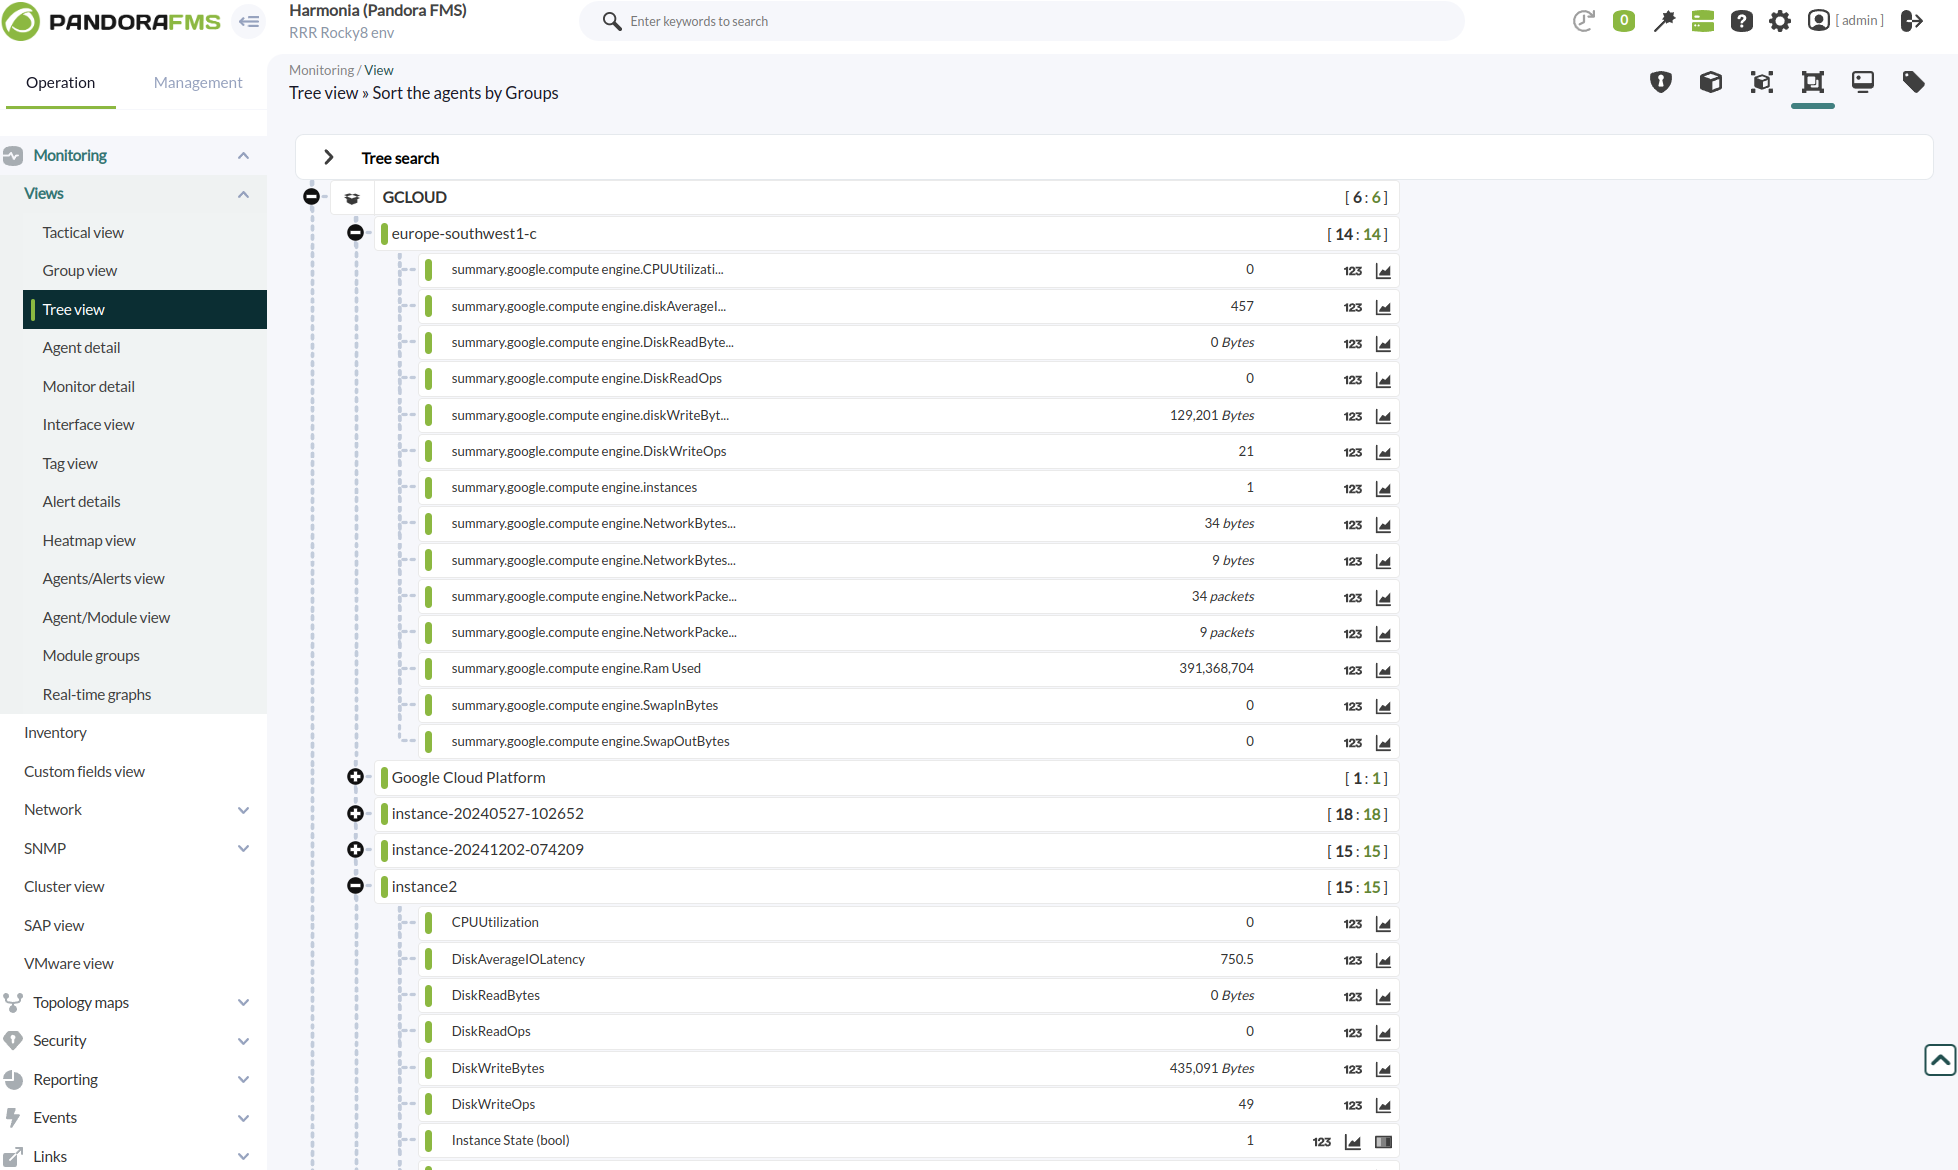
Pandora FMS generates specific agents and modules depending on the configuration chosen, allowing you to get a full and detailed view of all your services on Google Cloud.
Running this task will create different agents depending on your settings:
Metrics
Plugin execution will generate the following agents and modules:
Global agent
< Name used with the parameter “stats_agent_name” or failing that ” Google Cloud Platform “. >
Modules
| GCP CE Instances count |
Number of total instances monitored by the plugin |
An agent for each monitored area
< Area name >
Modules
|
summary.google.compute.engine.CPUUtilization |
Average CPU usage percentage of the instances in this area |
|
summary.google.compute engine.DiskReadBytes |
Summary of the number of bytes read from disk for each instance of this zone |
|
summary.google.compute engine.DiskReadOps |
Summary of the number of read operations performed on the disk of each instance in this zone. |
|
summary.google.compute engine.diskWriteBytes |
Summary of the number of bytes written to disk for each instance of this zone |
|
summary.google.compute engine.DiskWriteOps |
Summary of the number of write operations performed on the disk of each instance in this zone. |
|
summary.google.compute engine.instances |
Number of instances monitored in this zone |
|
summary.google.compute engine.NetworkPacketsIn |
Summary of the number of incoming network packets for each instance in this zone |
|
summary.google.compute engine.NetworkPacketsOut |
Summary of the number of outgoing network packets for each instance of this zone |
An agent for each monitored instance
< Instance ID >
Modules
|
State |
Machine status, in string format |
|
Instance State (bool) |
Machine status, 1 if running, 0 if not running |
|
CPUUtilization |
Percentage of CPU usage used |
|
DiskReadBytes |
Number of bytes read from disk |
|
DiskReadOps |
The number of read operations performed on the disk |
|
DiskWriteBytes |
Number of bytes written to disk |
|
DiskWriteOps |
Number of write operations performed on the disk |
|
NetworkPacketsIn |
The number of incoming network packets |
|
NetworkPacketsOut |
The number of outgoing network packets |
Global agent
< Name used with the parameter “stats_agent_name” or, failing that, “Google Cloud Platform”. >
Modules
| GCP CE Instances count Number of total instances monitored by plugin |
An agent for each monitored area
< Name of the area >
Modules
| summary.google.compute.engine.CPUUtilization Average CPU utilization percentage of instances in this zone |
| summary.google.compute.engine.DiskReadBytes Summary of the number of bytes read from disk for each instance of this zone. |
| summary.google.compute.engine.DiskReadOps Summary of the number of read operations performed on the disk of each instance of this zone. |
| summary.google.compute engine.diskWriteBytes Summary of the number of bytes written to disk for each instance of this zone. |
| summary.google.compute.engine.DiskWriteOps Summary of the number of write operations performed on the disk of each instance in this zone. |
| summary.google.compute engine.instances Number of instances monitored in this zone. |
| summary.google.compute engine.NetworkPacketsIn Summary of the number of incoming network packets for each instance in this zone. |
| summary.google.computeengine.NetworkPacketsOut Summary of the number of outgoing network packets for each instance in this zone. |
An agent for each monitored instance
< Instance ID >
Modules
| State Machine status, in string format |
| Instance State (bool) Instance State of the machine, 1 if running, 0 otherwise 0 |
| CPUUtilization Percentage of CPU utilization used |
| DiskReadBytes Number of bytes read from disk |
| DiskReadOps The number of read operations performed on the disk. |
| DiskWriteBytes Number of bytes written to disk |
| DiskWriteOps Number of write operations performed on the disk |
| NetworkPacketsIn The number of incoming network packets |
| NetworkPacketsOut The number of outgoing network packets |

pandora fms resources
Want to learn more? Explore more resources
Get full control over your instances and resources with Google Cloud
Pandora FMS not only facilitates Google Cloud integration and monitoring, but also offers advanced tools to manage your entire network infrastructure. Ensure optimal performance and efficient management of your devices with this powerful combination.


