Features map
Every user has unique needs and our goal is to offer you an efficient experience
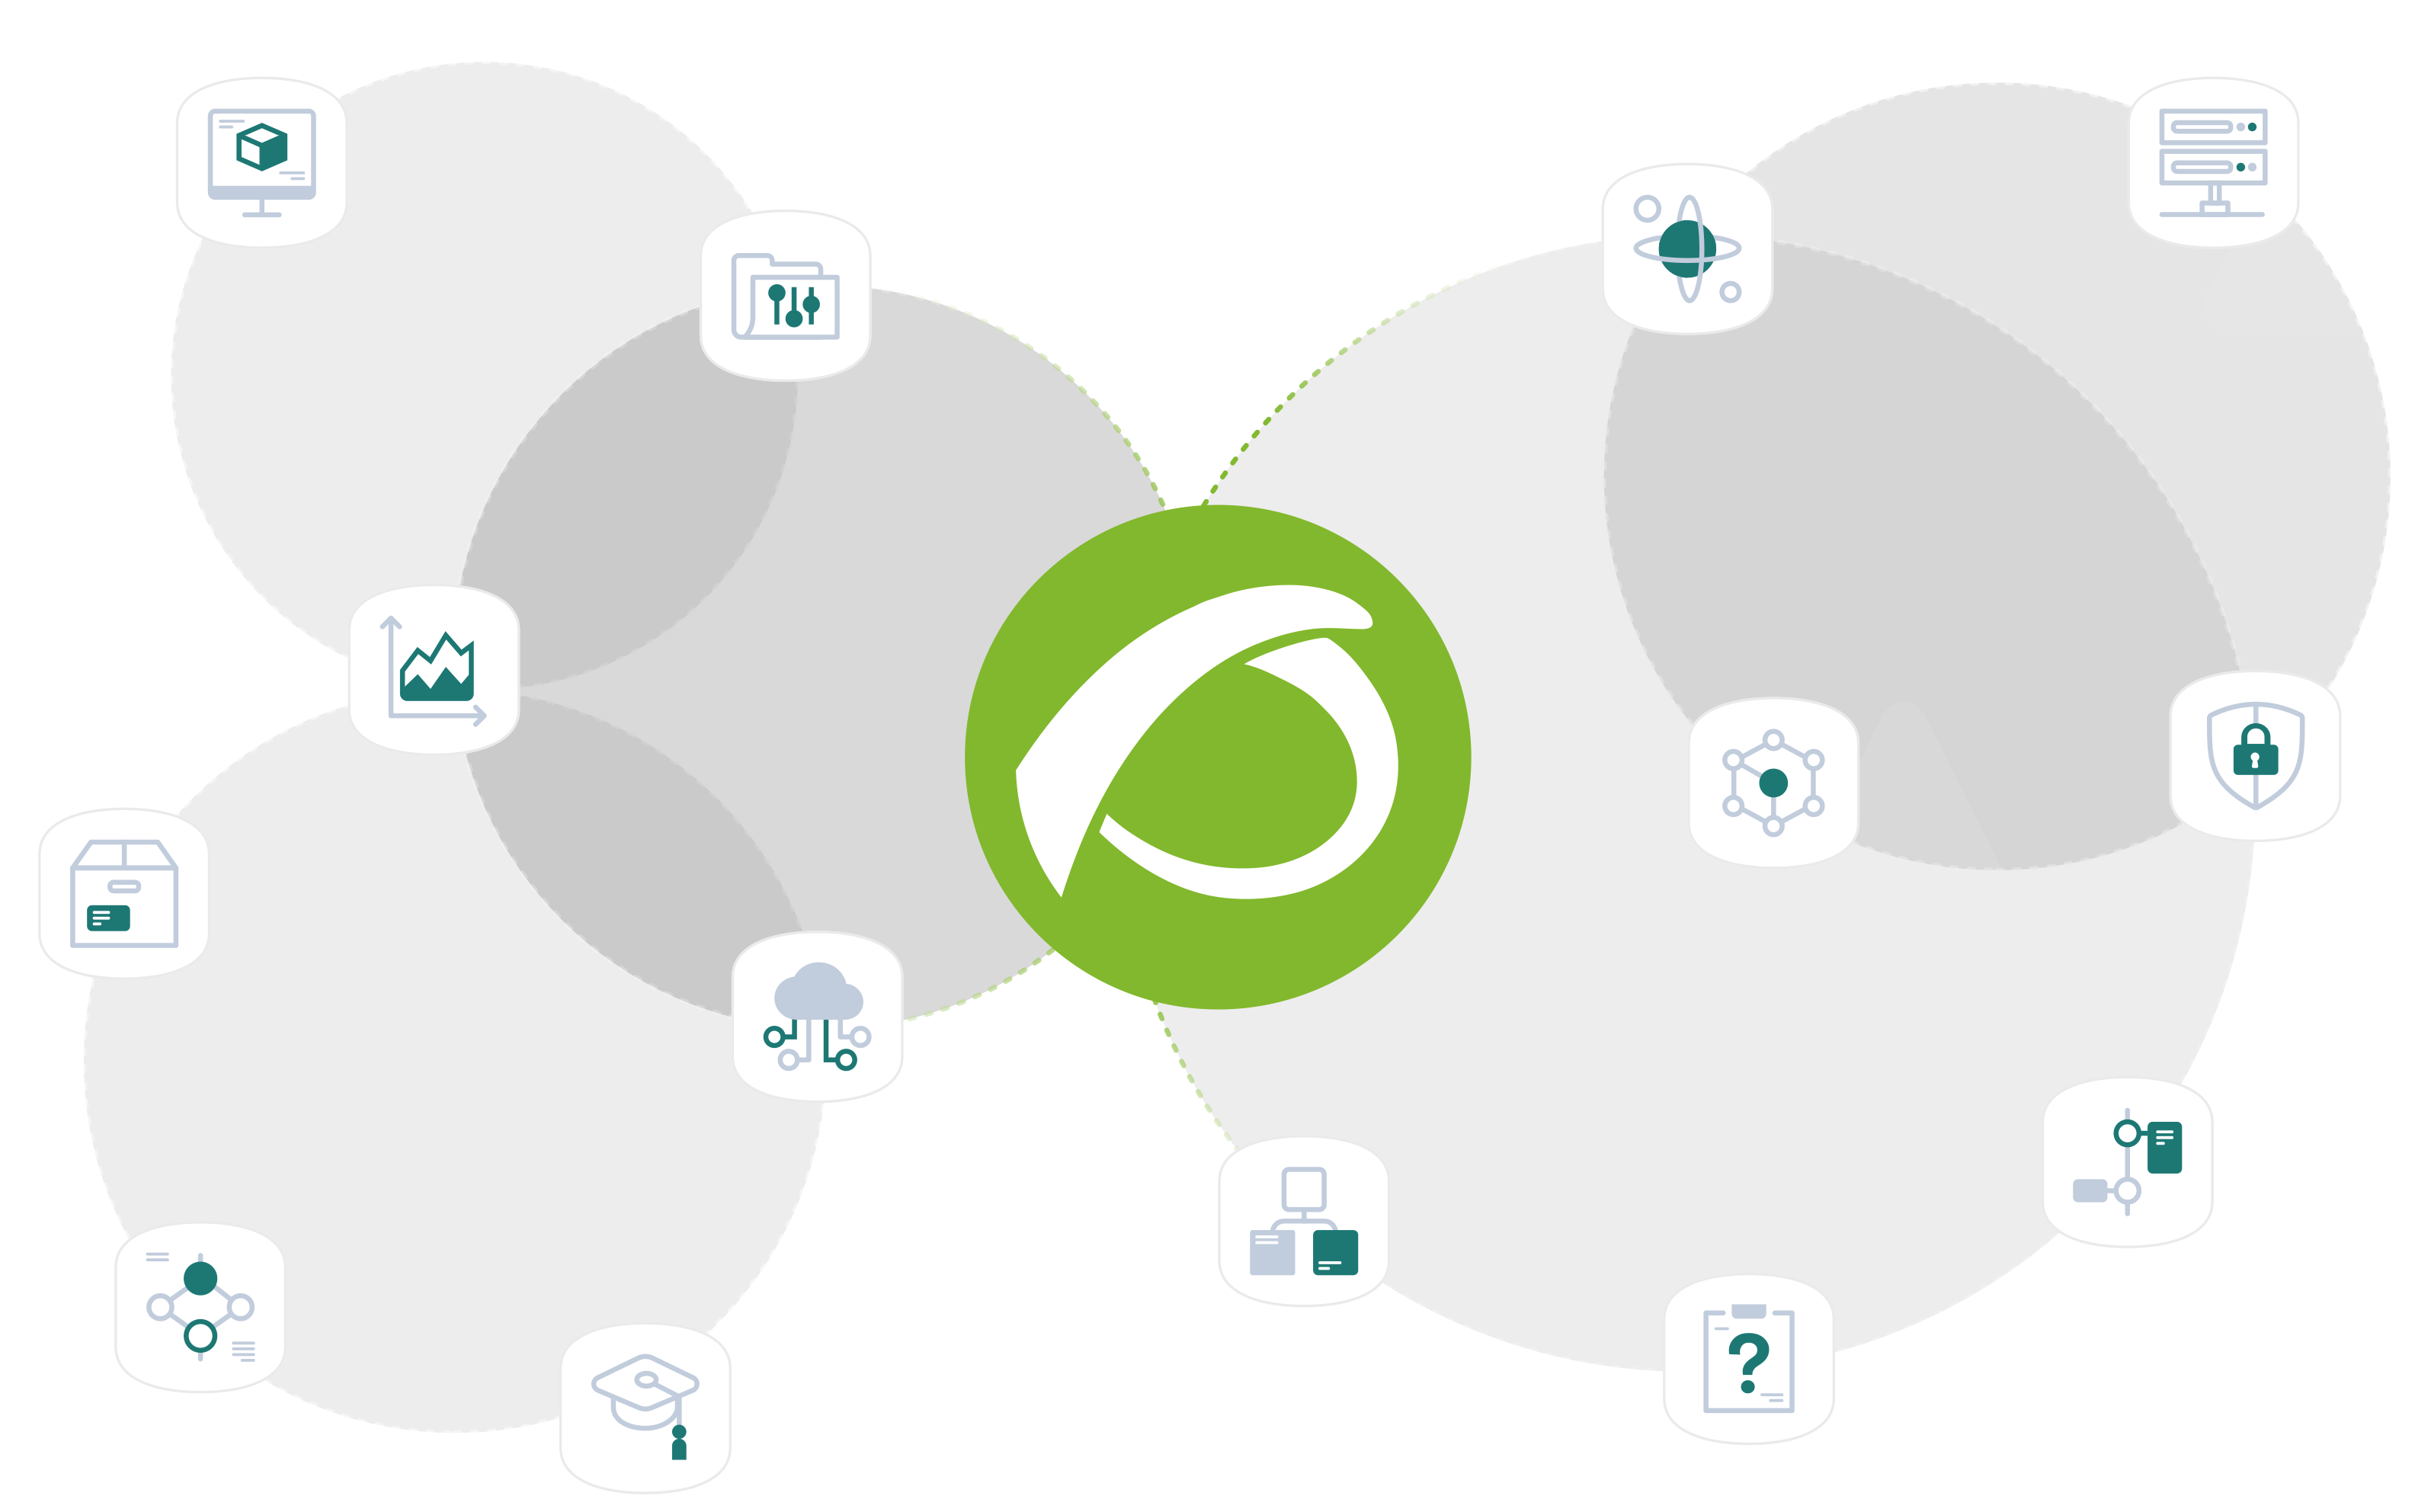
In this section, we invite you to explore the heart of our software through an interactive feature map. Here you can discover all the tools and features we have designed to facilitate your work and boost your productivity.
Network monitoring
Automation
Integrated reports
Event Console
Alert system
Transactional WEB monitoring
Database monitoring
Servers
Platforms monitored
Cloud monitoring
Environment monitoring
Inventory
IP addressing management
Remote control
Issue management
RMM
SIEM
APM
Security
User interface
Architecture
Training and support

Network monitoring
Traffic monitoring
Through sFlow, NetFlow or JFlow method.
Network and remote topology detection
Through network scans.
IPv4 and IPv6 compatibility
Supports IP versions IPv4 and IPv6.
Traffic information detail
The information shows a history with a minimum granularity of one minute and a history of several years. The graphics zoom in and keep the highest level of detail.
Communication link performance
Monitoring network interfaces, bandwidth, consumption, maximum occupancy, availability, errors, discards, packet losses, real speed, etc.
Map and network diagram creation
Presentations in active network diagrams. These network diagrams will be updated automatically with the new network nodes, identifying new elements.
Discovered equipment features
Brand, model and firmware are automatically specified.
Equipment usage
CPU, memory, disk and communication equipment buffer usage.
Compatibility with SNMP
Compatibility with the SNMP and ICMP standard for obtaining information from devices, for versions 1, 2, 2c and 3.
Use of physical and logical ports
Open and in-use physical and logical ports are shown for routers and switches.
Log and event collection
Log collection parallel to monitoring. No megabyte limit. Log collection via syslog (remote) and local agents (Linux and Windows).
Relationship between network devices at network and link level
If the information is available, Pandora FMS is able to show the relationships at network level and the link level between the different ports of the routers/switches and the connected equipment.
Detection of active devices to monitor
It scans and generates monitoring information of physical and virtual equipment, servers, workstations, routers, switches, firewalls, bandwidth administrators, load balancers, access point and printers.
Remote connection to network equipment
It allows remote connection to communications equipment centrally in the solution itself, through SSH or Telnet.
Distribution of intermediate probes for information collection
It allows the use of intermediate probes to be able to monitor the network in a distributed way.
Possibility of high frequency polling
It rates network monitoring times at intervals of minimum frequency up to five seconds.
Custom remote queries
It allows the tool administrator to define their own complex (multi-step) remote checks based on dialogue / response over a TCP port.
Self-increase of test retries in case of failure
It increases checking attempts intervals in case of failure.
Scheduled monitoring
It schedules check-ups on specific dates and times.
WMI remote queries
It checks Windows computers remotely, using a WMI interface to add your own WML statements.
SSH Remote Queries
It queries Linux and Unix computers remotely, using remote commands on SSH.
SNMP trap reception
Trap collecting and alert allocation to these values. It collects numerical and/or alphanumeric values too to enrich the alerts with data obtained from traps : critical system temperature, name of the down interface, filesystem alert, critical-state memory/CPU, etc.
Packet loss
It monitors network interface packet loss.
Real-time geographic maps (GIS)
They show the exact position of each device (GPS) and, if it is updated, that movement is shown on the map. A movement history of each element can be saved and seen on the map.
Remote execution queries in Windows
Running a command and getting the result, providing username/password.
Heat maps
To see Wi-Fi coverage areas, packet loss, or other numerical parameters.

Automation
Network equipment remote configuration
That allows to upload and download full or partial configurations of network equipment through SSH or Telnet. (NCM).
Firmware update for network equipment
By uploading firmwares through SFTP/FTP from network devices such as routers, switches, AP’s, firewalls, etc. (NCM).
Remote commands and script execution on servers and workstations
It allows to deploy script or custom command execution to servers and workstations, without direct communication from the console to the agents, which allows to execute scripts in remote stations, without direct connection (OmniShell).

Integrated reports
BAM monitoring (Tree Services)
It monitors business processes in real time in a single console (dashboard).
Data analysis console
Allows you to use the entire monitoring data set to perform multivariate analysis with real-time data. Useful for troubbleshooting or security issues.
Partage de rapports avec des tiers
Permet de partager des écrans de rapports en temps réel, tels que les consoles visuelles ou les tableaux de bord, avec des utilisateurs n’ayant pas accès au système, en leur communiquant une URL spéciale.
Sharing reports with third parties
Allows you to share real-time report screens such as Visual Consoles or Dashboard with users without access to the system by sharing a special URL.
Reports
Report scheduling allows filtering information in time periods, reporting equipment failures (failures), warnings as well as displaying descriptive problem statistics and simple or combined graphs (multiseries).
SLA Reports
Daily, weekly and monthly SLA reports, in addition to global reports (by time periods).
Availability reports
They indicate, in a given period, the total number of tests performed, the success and failure percentages in that time for each test performed.
Top-N type custom reports
The operator can define a set of data that the application shows according to the applied filters.
Planned stops and exclusion
It excludes from all types of reports the periods defined as maintenance windows.
Report templates
End users can easily create reports from templates defined by the administrator.
Sending scheduled reports
The administrator can define report scheduled sending by email (in PDF).
Graphic views
They allow the operator to create their own graphic panels where to include monitoring data: graphics, status icons and real-time values. These screens can relate to each other.
Real-time data
Graphs and reports show real-time data at all times, not pre-calculated data.
Information availability
Pandora FMS is managed in real time from a web application for modern standard browsers (Edge, Firefox, Safari, Chrome).
Information presentation – Visual consoles
Information is centralized in a single interface as a board, where you may add elements of a library and customize the look and contents, in addition to being clickable and working as custom operation screens.
Information presentation – Dashboard
Information is centralized in a single interface as a board, where you may add elements of a library and customize the look and contents, in addition to being clickable and working as custom operation screens.
SLA reporting accuracy
Up to 4 decimals.
Later result adjustment by scheduled downtime
Reports are recalculated if scheduled downtimes are added afterwards (for the impact of SLA reports, availability, etc.).
Report customization
Covers, footer and custom indexe creation.
Freeform reports
Possibility to define reports based on your own HTML format, including custom SQL queries in table and/or graph format.

Event Console
Event collection and visualization
Customized workflow
A set of logical rules (AND, OR, NOT) can be established to refine the events based on the collected events and generate new events or actions (notifications).
Event grouping and duplication
Allows to work with events in a grouped way, displaying repetitions, and validating all together.
Self-validation of events
The retrieved events will allow self-validation when the problem that triggered them is solved.
Audible event console
The system allows receiving audible warnings by an operator, based on filters by origin and criticality. This system is complementary to the others.
Multi-user event console
The management of events can be delegated to users, notes can be made for collaborative work, etc.

Alert system
Alarm generation and sending
Alarm generation and sending are available as on-screen alerts and allow immediate sending by text message to mobile phones or email.
Alarm filtering and scaling
It filters the alarm sending by maximum number of repetitions, minimum number of repetitions and consecutive failure concurrency.
Time-based scaling
It allows criticality scaling based on time spent in an intermediate state (warning towards critical).
Event auto-validation
Recovered events will allow auto-validation when the problem that triggered them is solved.
Manual corrective actions
It allows performing manual actions on the events using the information available to launch diagnostic tools, open incidents, add notes or leave the event in work mode.
Alarm correlation
Sets of logical rules (AND, OR, NOT) that allow to refine alarms based on the events collected in the monitored systems can be set.
Programmable alarm sending format
Alarm forwarding is definable by the user, so that it allows its integration with new platforms, such as Telegram,MSTeams, Slack, Mattermost, Discord, Google Chat…
Sound warning console
It allows audible messages to be received by an operator, based on filters by origin and severity. This system is complementary to the others.
Mobile application for receiving messages
It enables notice reception and their real-time checking for Android and iOS.
Special days calendar
Where exceptions to the execution of alerts can be defined.

Transactional WEB monitoring
Application and web server software
It scans and generates information on Java application (OAS-Oracle, JBoss-Redhat, WebLogic), IIS web servers and Apache monitoring.
Transactional monitoring and user experience
It verifies the proper operation of each step of an application from the user’s point of view, being able to replicate each one, measuring success and total time.
Access via authentication
It checks application availability through user login and password.
Application traceability
It checks the availability of a request in the application following a navigation flow (trace); each independent request is monitored individually, in addition to the entire transaction.
Application availability
It scans application services to evaluate operation by URL and IP.
Transaction time breakdown
It breaks down in time periods each of the key transaction steps (server connection time, first iteration response time, application downloading time, etc.).
Navigation with distributed probes
Remote web application monitoring is possible from different geographically distributed points, synchronized by a central manager.
Screenshots
It takes screenshots to use them as report in case of failure and thus to analyze the problem as it looks like for a real user.
Database monitoring
Commercial relational database engines supported
It supports Oracle, Sybase, Informix, DB2, Microsoft SQL Server, MySQL and PostgreSQL.
Commercial NoSQL database engines supported
Support for MongoDB, RavenDB, HBase and Cassandra engines.
Storage system monitoring
Physical storage on hard disk, disk groups, tablespace – datafiles -.
Availability
It reports availability by opening and closing a connection and services at operating system level.
Transactions
It reports database locks, number of open sessions, number of open cursors.
Relation of event logs and warning
It logs errors, warnings, user and session status, checks replication processes; updates data outside applications; generates and verifies backups.
CPU usage
It identifies the database usage percentage on the server that contains it.
Cache usage
It shows cache usage by the database.
Total number of connections and their status
It shows connection real-time movement.
Job failures
It reports any errors in job execution.
Fragmentation
It identifies fragmentation level in data stores.
Backup errors
It generates manual and scheduled backup failure alarms.
Custom SQL queries
It monitors the result of custom SQL queries (or equivalent).

Servers
Monitoring with agents
It has the local agents feature, so that equipment can be monitored in a very detailed way with minimal impact on the system.
PowerShell native monitoring
Allows to launch native powershell queries from the Windows agent.
Native WMI monitoring
Allows to launch native queries directly from the agent or remotely through the remote WMI server.
Version Management / Obsolescence Planning
The system allows managing different OS versions, assigning them an expiration date and displaying reports and search filters to identify those Enterpris systems.
Agentless monitoring
Through remote WMI queries, SSH or remote windows executions.
Remote agent installation
It allows distributing and installing agents in an unattended way from the administration console; Windows and Linux systems.
Automatic agent provision
Agents are configured when contacting for the first time the central server, and a configuration determined by a set of rules is applied.
Support to different platforms
In 32-bit and 64-bit architectures, information is obtained from Windows, Linux and Unix operating systems (Solaris, HP-UX, AIX), Mac OS X and BSD systems.
Server hardware operation
CPU, RAM, physical memory, virtual memory, cache and paging are monitored. Open processes, zombies, swap, access to the environment, etc.
Operation information
Fans and internal temperature.
Storage
Availability, available space per partition and building points.
New storage system hot detection
Monitoring new building points automatically.
Network card
Availability and charging by network card.
Operating System and general configuration
It describes operating systems and equipment configuration.
Conditional monitoring
It allows monitoring based on whether certain criteria are met, evaluating it in each execution.
Local corrective actions
They run on agents, based on a given condition.
Screen monitoring
It allows taking “screenshots” of the output of certain commands.
Service and Process Watchdog
It allows restarting in case of failure, and monitors it automatically (Windows).
Use of intermediate proxies to send information
If agents cannot contact the central server.
Local data collection in case of disconnection
Information will be stored locally if the network falls down, so that, when it can connect again with the central server, it sends the information for that period.
Execution of agents with users without privileges
So that they cannot access classified information.
Cluster monitoring
Valid for any manufacturer and any cluster model, A/P or A/A, and also for application or network clusters.
Remote agent configuration
Individually or collectively for configuration bulk changes.
Virtual environments
VMware, HyperV, HPVM, RHEL VM, Nutanix, OpenNebula, IBM, HMC, LPAR, KVM and XenServer monitoring.
Application server monitoring
It verifies OAS, JBoss, Tomcat, WebSphere, GlassFish services and equivalents.

Platforms monitored
Linux
Linux (all distributions, x86, x86_64, arm).
Windows
From Windows 2000 onwards.
Android
Versions since 2019.
IBM-i (as400)
IBM Supported Versions.
Unix
Solaris (8.x and above), AIX (5.x and above), HPUX (11.x and above) and multiple versions of NetBSD and FreeBSD.
Mainframe
IBM os/390 (zSeries).

Cloud monitoring
Google Cloud
Auto-discovery and monitoring.
Amazon AWS
Auto-discovery and monitoring.
Microsoft AZURE
Auto-discovery and monitoring.
SAP
Cloud or onPremise (SAP R3, R4, SAP HANA, etc.)

Environment monitoring
UPS
Compatibility with the main manufacturers.
IoT / MQTT
Able to subscribe to MQTT queues for IoT integration.
Air conditioning
History of use and air conditioning sensors, report and alarm generation.
Access control
Historical of access control to the computer center, reports and alarm generation.
IoT / Sensors
Possibility of integration with different IoT systems through direct connection (SNMP) or Rest API.

Inventory
Obtaining the inventory
Inventory is obtained both by remote network probes or agents.
Inventory systems
Network equipment (routers, switches), as well as Linux or Windows servers.
Network equipment remote configuration
It periodically collects remote configurations of network equipment and stores their different versions over time.
Detection of inventory changes
It allows the operator to be notified in case of detecting changes from one inventory review to another.
Display of equipment configuration differences
It visually displays configuration changes on remote computers from which your configuration is collected as part of the inventory.
Inventory alerts
Inventory alerts can be configured from the data received.
Custom fields
Monitored assets can be customized, to include details such as serial number, asset manager, physical location on a data center, etc.
CPU
It collects information about CPUs.
Video
It collects information about PC-installed video cards.
Hard drives
It collects information about computer-installed hard drives.
Partitions
It collects information about each of the partitions on each computer.
NIC
It collects information about installed network cards and drivers.
Patches
It collects information about computer-installed patches.
Software
It collects information about computer-installed software.
Processes
It collects information on computer-running processes.
RAM
It collects information about computer-installed memory modules.
Users
It collects the number of administrator users or guests on each computer.

IP addressing management
Automatic discovery
The tool has IP detection in a subnet, IP reponse checkout, resolving hostname and operating system.
IP Administration (IPAM)
The tool can configure, enable and disable each IP manually, add events in the IP, comments for each IP, reserve IPs and monitor dynamically the use of network IPs by network, subnet and supernet.
Customizing IP views
The tool can filter and view different IP groups.
Integrated IP with Microsoft DHCP Server management
The IPAM system can be integrated with Microsoft server through local real-time data collection to refresh and update IP status, including their reservation, lease and each IP lease time.
Subnet calculator compatible with IPv4 and IPV6
It allows the following data: network (address and bit mask), network mask, network wildcard, network address, broadcast address, first valid IP, last valid IP and network IP number.
VLAN management
It allows to manage network VLANs from the discovered networks.
CSV import and export
Networks and vlan can be imported by CSV as well as export in CSV information on the detected networks.

Remote control
Computer Remote Desktop
Integrated into the software, without calling a third tool. Integrated in the interface. Compatible with Windows, Linux and Mac systems.
OnPremise and SaaS
Internal servers can be installed OnPremise for complete privacy, with no data passing over the Internet.
Remote Shell
Integrated in the tool Interactive access by shell to Linux and Windows computers.
Copy of bidirectional files
Integrated in the tool’s main console, it allows the user to access the remote filesystem to download, delete and upload files from the PC.
Process and service control
It allows starting, stopping and restarting remote processes and services of the managed machine.

Issue management
Creating manual tickets from an event or alert
It allows the operator to create an issue associated with an event on an active problem to closely monitor the issue.
Change Management
Integrated change management tool, with customized workflow definition, third-party validation of each step.
Integrated Chat (with AI)
Integrates its own AI engine (onPremise) or allows to connect with ChatGPT via API.
Scheduled reports for PDF delivery
Different types of reports, customizable.
Multitenant / Multigroup / Multiuser
A single installation allows to serve as MSP.
Integrated SLA control
User configurable, integrated in all reports and elements.
OnPremise and SaaS
Internal servers can be installed OnPremise for complete privacy, with no data passing over the Internet.
Creation / Update of automatic tickets
It allows to create tickets as an automatic response to a problem detected by monitoring.
Custom Workflow
It allows to define a lifecycle for each ticket based on the creator, dates, criticality, work group, etc. This lifecycle incorporates flow change notifications by email, automatic scaling and issue closure validation through external users.
RMM
Patch management
Installation of patches and inventory of current ones.
Software installation/uninstallation
By remote execution of scripts (already defined).
User creation
By remote execution of scripts (already defined).
Execution of custom scripts
MBy remote execution of scripts (user defined).
Massive deployment operations
To work with large blocks of operations (massive installs/uninstalls, etc.).
Operations scheduling
To schedule certain actions on a periodic or deferred basis.

SIEM
Security event collection
Supports different sources: raw logs, remote or local syslog, windows events, third party events (CEF), and any plaintext log using custom decoders.
Default decodes and rules
More than 4000 rules already available.
Custom event filters
SIEM event correlation alerts
SIEM event specific reports
Customizable decodes and rules
Directly by the end user.
Real-time SIEM event dashboards

APM
Traceability at the execution point level in the code and/or library calls
Automatic instrumentation of applications: For example, in Java applications, OneAgent dynamically injects instrumentation at runtime using bytecode weaving techniques. This allows you to capture transactions, method response times, exceptions and distributed traces without the developer having to modify the code.
Native integrations and cloud APIs
Auto-discovery and mapping of application dependencies on the stack
Directly connects to cloud services (such as AWS, Azure, GCP) and other applications via APIs, allowing you to extract relevant metrics and events for monitoring.
Synthetic monitoring and real-user monitoring (RUM)
We call it WUX.

Security
Multitenant
With the same solution you may offer services to different clients or groups without them seeing each other.
Encryption of data and communications
On all components (optional).
System hardening monitoring
Use the agents to audit the system’s security level and give a grade, indicating any misconfigured items or items that need attention. Monitors the evolution of each machine through audits over time. Available for Linux and Windows environments.
Vulnerability auditing
Uses agents to audit known vulnerabilities in the system by comparing the installed software with different public vulnerability databases. This allows to quickly detect when an application is vulnerable on a system, identifying the risk and assessing it over time. It uses software inventory agents to collect this information, but also uses remote discovery to find vulnerable remote applications.
Profiling system according to groups and accesses
Different users from the same group can perform different functions.
Internal audit
It reflects what operations each user has performed and when, including failed access attempts.
Password Policy
It allows forcing a policy of password change, with minimum length passwords, special characters and history of old passwords.
Password Recovery System
A solution is provided so that users can recover forgotten passwords.
Centralized authentication with LDAP
It has its own system of users, profiles and roles, and supports Active Directory, LDAP and SAML.
Centralized authentication with AD
It has its own system of users, profiles and roles, and supports Active Directory, LDAP and SAML.
Centralized authentication with SAML
It has its own system of users, profiles and roles, and supports Active Directory, LDAP and SAML.
Authentication with fallback
Double AD/LDAP server in case the primary one does not respond.
Dual authentication system (2FA)
Through Google Auth or equivalent, it uses a mobile or external hardware device to perform double authentication to enter the system.
Credential store system
It allows you to reuse combinations of credentials (eg: username and password) in controls without really knowing their content (to delegate the configuration to users without permission to said passwords).

User interface
User-customized favorites system
Allows to customize screens to each user’s taste.
RBAC profile system
Integrated with AD / LDAP.
Multi-language
Allows to redefine terms in each language, for local customizations.
Multitenant (Multi-user)
Single instance can serve different clients (for MSP).
Extended ACL
Allows to customize in detail any section of the console, to individually limit access to menus and sections.
Rebranding / OEM
Allows a total rebranding of the product, hiding the manufacturer name, the product name and changing colors and icons by the administrator.
Internal messaging
Between users, for system notifications, etc.

Architecture
Problem scaling system and root cause analysis
It allows analizing the information based on the service as a whole, by grouping information. This makes the analysis of the problem root cause easier.
Automatic provisioning system
It distributes the load in case of new node registrations on the corresponding servers, or by load or custom rules.
Long-term data storage
It is able to keep all data history at full resolution for at least three years Data, events and SNMP traps.
Communication via standard ports
Communication between the different components of the architecture is done through official ports, listed by the IANA.
Isolated envirnoment monitoring
A system is provided by which an isolated network can be monitored through a component that does not have direct connectivity to the central monitoring infrastructure.
Integrated Backup
It includes an integrated backup system.
Policies / Templates
It can creates monitoring, correlation and inventory policies. These policies can be applied by specific groups or users, so that similar machine sets can be managed easily, quickly and evenly.
Single console in distributed environments (different instances)
A single console is available, regardless of the final scaling of the implementation The same user will work for all the tool features (network, applications, logs, reports) without logging in to different screens.
Horizontal scalability (involves distributed storage)
There is an unlimited chance of growth by adding new servers.
High Availability
HA is integrated into Pandora FMS. All system components support high availability without requiring external elements.
High Availability in different geographical locations
It allows to implement a fool-proof HA, in which each portion of the system can survive isolated, using IPs in different subnets and geographically distributed.
Distributed elements
It allows each architecture element to be in physical locations (different servers).
API/CLI
It offers a REST API and command line tools to manage the solution.
Open SQL Database
The data model of the entire platform is open and documented, in order to use external queries to retrieve data.
Rebranding / OEM
It allows full product rebranding, hiding the name of the manufacturer, the name of the product and changing colors and icons by the administrator.
Remote agent installation
It allows you to deploy monitoring agents remotely, automatically and centrally.
Licensing type
It is licensed based on the total number of devices, regardless of the total number of metrics collected on each device.
Integrated update system
No intervention in the system by means of shell, totally centralized in the console.

Training and support
Official training
Standard training for technicians on the basic knowledge indicated. Said training includes all usage levels and tool implementation.
Official certifications
Accreditation, by means of an official certification, of the knowledge of technicians.
Online training platform
To make training easier, it has an online eLearning platform to get the tool and certifications knowledge.
8/5 or 24/7 support
Unlimited ticketing support for Enterprise users (NON-LITE). 24/7 support possibility.
Parlez à l'équipe de vente, demandez un devis ou posez vos questions sur nos licences


