

 Home
Home

Reports
| Last modification: August 2026. | Version: 109 OUM |
Introduction
Pandora ITSM encompasses the types of reports from different areas in a single place and incorporates a report manager that allows creating templates for them quickly and an automated manager for sending them by email (if necessary).
It also offers a Dashboards manager to graphically create and summarize the most important information from different topics, and each user will even be able to choose a dashboard in a customized manner.
- People management and time reports.
- Incidence support management reports.
- Project management reports.
- If an immediate report from any of the previous areas is needed directly from the database, the SQL Reports can be used for this (some minimum technical knowledge is required, in case you need help please visit this link).
Dashboards
Menu  Reports → Dashboards → Manage Dashboard.
The Dashboards or control panels allow having the most important information at a glance when logging into Pandora ITSM. For this, they can be customized for each user, creating different dashboards for each of them.
In this list, you can filter by keyword in the text box and the Search button. For a new Dashboard, it presents the Create button.
Each listed Dashboard has two buttons in the Actions column to edit its name and group (Update option) and delete (Delete option) each corresponding dashboard.

By clicking on each Dashboard name, you can edit its content, essentially adding and/or removing widgets. When installing Pandora ITSM, a Default dashboard is included with each of the available widgets and serves as a demonstration of the useful PITSM features.
Creation
Menu Reports → Dashboards → Manage Dashboard → Create +.
A name must be specified (Name), this name must be unique in the system and without spaces before or after. After selecting a group (Group), press the Create button again.
The editing process of these two data of a Dashboard is similar to the creation process and is accessed by pressing the corresponding Update button in the dashboard list.
Editing
By clicking on the name of the dashboard to edit in the start list, you will be able to add widgets and configure each of them.
To start editing, activate the slider button, last on the right:

An icon with a plus sign (Add cell) will appear with which you can add a cell that will contain a widget. In each added widget (New widget), you can assign the desired widget type using the Add widget button.
Widgets
Each added widget can be configured by pressing the gear icon  , or it can be deleted with the trash can icon
  , both located in the upper right corner.

You can move (“drag and drop”) each widget on its window title using the mouse and modify its size by placing the pointer on the edges until it changes and shows one or two arrows, and then drag and drop that edge (or corner) until the desired size is achieved.
Customized links
It allows adding a fully functional link to open in the same window or in a new tab.
When adding the URL, it must start with http:// or https://, otherwise it will open as an internal link (PITSM web console). You must also choose an image, both fields are necessary for the widget to work.
To add an internal link to the ticket search and have it open in a new tab in the web browser:
- URL field:
changes/operation/changes/changes_list. - Open new tab option: Activated.
- Image element:
ticket.svg.
To quickly add other internal links, you can use the Predefined links widget.
The other elements are optional and offer adding text to the link, title, font, colors, etc.
Message board
It presents a complete rich text editor (tables, links, images, lists, etc.) to embed even entire documents in the Dashboard. For all this, it has an integrated menu where you can consult its help, including the predefined keyboard shortcuts in this object.
When adding web links, you can choose the underline format to highlight them.
By default, it presents a welcome message; when the text and/or images to be shown in the widget are added, this notice and its added image will be completely deleted.

Predefined links
When internal links (with labels and allusive icons) to the PITSM web console itself are needed, the Predefined links widget is used:
- KB: Link to the knowledge base.
- Downloads: support and downloads.
- Create ticket: Ticketing and support.
- Wiki: Pandora ITSM Wiki.
- Time tracker: Time management, activity log.
- My tickets: Link to filter and view the user's own tickets.
Search box
It allows adding a search box by keyword in the following areas, all optional (at least one must be selected):
- Wiki.
Support Activity Graph
Through previously saved filters, an indicative activity graph can be shown on one or more calendars:

Each user will only be able to choose from their own saved filters.
Support Evolution Graph
It presents a graph with the open and closed tickets choosing a previously saved filter and with a customizable data refresh rate.
Each user will only be able to choose from their own saved filters.
Support SLA
Choosing a saved filter allows viewing a pie chart with the percentage of successful and failed SLA.
Each user will only be able to choose from their own saved filters.
Support statistics
With a custom saved filter, the tickets are selected and grouped according to their priority:

They can also be grouped by ticket status, show general statistics, or group by ticket types.
- Each user will only be able to choose from their own saved filters.
- It is necessary to select an option from the Statistic drop-down list.
Ticket list
It shows a list of tickets with a default pagination of 5 elements, allowing the choice of fields to display and their order. To obtain the information, a saved filter is chosen with a time period to keep the information updated in real-time.
Each user will only be able to choose from their own saved filters.
Report manager
Menu Reports → Report manager.
With the report manager, you can create templates and schedule report generation so that they are stored in the system report library and that, in addition, they are notified or sent by email.
The system cron must be activated for the scheduled reports to be generated.
Report templates
Menu Reports → Report manager → Templates.
The templates consist of defining the report cover, page header, and footer, which uses some macros (cover and footer) to show the generation date and time and the type of report involved. They are used to generate PDF reports and for the report scheduler.

For the first page, there is an editor that allows adding images, links, formatting the text, and configuring the margins, and the following macros can be used:
_fullname_will replace the name of the user who generates the report, who requests it._date_will show the date the report is generated._time_will show the time the report is generated._reportname_to replace with the report name.
These macros are also applicable to the header, and in addition, the header logo can be customized. Each of these three elements—cover, header, and footer—can be disabled.
Report scheduler
Menu Reports → Report manager → Report schedule.
Optionally, it is recommended that the scheduled report belongs to a company so that the users belonging to that company can view and edit said scheduled report.
Depending on the chosen report type, the same filtering mechanisms of each report type will be presented, except for Custom SQL, which will only show the created SQL reports.
As many schedules as needed can be created.
The system cron must be activated for the scheduled reports to be generated.
Through the menu Reports → Report manager → Report library, the generated reports can be accessed and searched by report type and/or report name.
People management
Pandora ITSM includes a functionality that allows clocking in. Users can log the start of work activity, the breaks they take during their workday, specify whether they are remote or at the workplace, and vacation management can also be handled.
Reports on the previous aspects can be scheduled weekly or monthly through the Report manager.
Time tracking
Menu Reports → People management → Time tracking.
It allows viewing in detail (daily, weekly, or monthly) the activity registered by a user with the Time tracker. There are established time periods (this week, this month, or the last three months) and any custom period can be requested.
There must be at least one daily record for the report to be displayed; this way, the rest of the records will be shown empty.
| CSV | Full screen | |
|---|---|---|
| ✅ | ✅ | ✅ |
Detailed vacation report
Menu Reports → People management → Detailed vacation report.
The default vacation report option is presented, and when pressing the Search button, you will have a complete list with the users, total vacation days, days taken and to be taken, with the options to view full screen or export to PDF.
You can filter by user or group and include a specific time period (start and end) or with only a start date or an end date.
By default, the Show vacation report option is selected (drop-down list in Report). If the option to show the work unit report is used (Show work unit report option), you will obtain, in addition to vacations, a total of unjustified days and justified unworked days (illness).
| CSV | Full screen | |
|---|---|---|
| ❌ | ✅ | ✅ |
General vacation calendar
Menu Reports → People management → General vacation calendar.
It presents, by default, a monthly view of users with approved vacations. This monthly view can be changed to a weekly or even daily period (for the latter case, each user with approved vacations takes the full day for it).

You can only go forward or backward by month, having the option to go to the current date using the Today button.
This report can only be viewed on screen.
People report
Menu Reports → People management → People report.
By default, it selects the current user for the last three months in all projects with a ticket summary. If there is registered activity, it will reflect:
- Project activity and percentage.
- Graphical ticket report.
- Graphical ticket report by group.
- Graphical ticket report by creator group.
- Tabular ticket report (if Show only summary is disabled, that is the default value).
- Summary with the number of tickets and total time worked.
| CSV | Full screen | |
|---|---|---|
| ✅ | ✅ | ✅ |
Monthly WU
Menu Reports → People management → People monthly WU.
By default, it shows all users in the current month with a summary of total hours in the month and their average valuation. You can filter by users as well as select the previous or next month, as appropriate.

In the report column, for each user, it presents a button that, when pressed, leads to a dialog box where the work units performed by that user can be edited, one by one or massively.

Only the task work units (Work Unit Tasks) can be edited massively by selecting each of them and applying the options in Massive operations over selected items.
Each of the task work units, individually and according to the user privileges, can be deleted, edited, or even locked to prevent the described actions.

Detailed user report
Menu Reports → People management → Detailed user report.
The start and end dates are mandatory.
Options:
- Project
- Role and task
- Role and task (details)
You can select by user, and time period, the roles (Role) and tasks (Task) of the projects (Project), for each of them, with a corresponding summary of hours and costs. For this option, the tasks will be grouped by user and project.
On the contrary, the other two options will report for each user and task, keeping the columns for descriptions and total tickets, hours, and costs.
| CSV | Full screen | |
|---|---|---|
| ❌ | ❌ | ❌ |
Vacation report
Menu Reports → People management → Vacation report.
It presents all active users selected by default; you can select them one by one or filter by keyword in the username. It is necessary to select a start and end date to view the report with the View button.

Filtering by name will be done by pressing the View button.
Both on screen and with the Export button, the data will be presented in a spreadsheet format.
| CSV | Full screen | |
|---|---|---|
| ✅ | ❌ | ❌ |
Team performance
Menu Reports → People management → Team performance.
It allows easily viewing the weekly operation of the staff associated with a company, with the possibility of being filtered by group, date, and PITSM functionality (Projects, Support, Changes, Time tracking). If results are found, it will also present a summary of each of the selected PITSM functionalities.
It is a report that, with its default values established, will never return any data, therefore its way of working must be taken into account:
- The main filtering is by company.
- To access the filtering interface, press the key combination
Ctrl+f(lowercase letter f). - The start day of the week will be the one established in the General configuration (Monday by default).
| CSV | Full screen | MS Excel® | |
|---|---|---|---|
| ❌ | ✅ | ✅ | ✅ |
Support
Menu Reports → Support.
The types of reports included are based mainly on the registered ticketing to be able to evaluate the support quality from all possible angles: costs, quality, times, effort, staff profiles, customer profiles, among others.
Support report
Menu Reports → Support → Support report.
It allows creating detailed reports that show dozens of graphs, summaries, lists, and parameters in a single PDF report. For faster parameter selection, it is recommended to use a user's custom search as the report origin.

The report consists of two parts: statistical information with graphs, Show statistics, and tabular ticket information, Show list (one option, or both, must be selected to display results). For the tabular information, the necessary report fields can be selected in the Issue fields section without affecting the graphical part.
The report contains eight general pie charts with some groupings with the top values (Top-N): tickets with the highest activity, most active customers, by operator, open, closed, etc.

Lists and trend graphs:

| CSV | Full screen | |
|---|---|---|
| ❌ | ✅ | ✅ |
Detailed ticket report
Menu Reports → Support → Detailed ticket report.
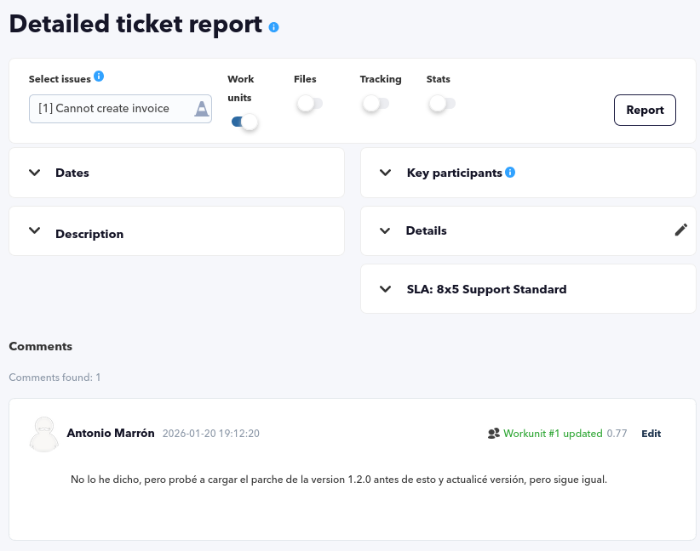
This report is specific to give all the possible details of a support ticket. From general data (dates, main participants, description, details, custom fields, and SLA information) as well as, optionally, the work units, attached files, tracking, and statistics of it.
Depending on the privileges of the user requesting the report, you will be able to see and/or edit less or more information and options.
An incident must be selected; to do this, you must type at least two letters in the Select issues field and press the Report button to get the basic data of the selected ticket.

Additionally, more information can be requested by activating one or more of the following options:
- Stats: It is the most important option because it allows obtaining general time statistics, time statistics of the Work units, graph with user activity, and statistics by status, group, owner user, and company.

- Tracking: Shows in detail the changes made to the selected ticket and with the possibility of filtering by the user requesting the report.

- Files: Lists the attached files of the selected incident.
- Work Units: Shows the Work Units with the option to edit the time used in each one.


| CSV | Full screen | |
|---|---|---|
| ❌ | ✅ | ✅ |
Resolution report
Menu Reports → Support → Resolution report.
It is a technical report showing a list of closed tickets aimed at knowing the impact it had in time, “dead breaks”, people involved, and its resolution (including customer feedback).

It allows being filtered by creation and closing date, ticket creator, and company.
| CSV | Full screen | |
|---|---|---|
| ❌ | ✅ | ✅ |
Ticket type report
Menu Reports → Support → Ticket type report.
It is a simple report in list format that groups the tickets by company (that creates the ticket), number of tickets by type in a given time interval.

It supports filtering by creator, company, and group.
| CSV | Full screen | |
|---|---|---|
| ✅ | ✅ | ✅ |
Operator report
Menu Reports → Support → Operator detailed report.
Specific report to control the quality of the support offered, showing metrics for each operator such as dedicated time, average ticket resolution time, customer feedback, and total tickets (filtered by company, user, status, and time slot).

| CSV | Full screen | |
|---|---|---|
| ✅ | ✅ | ✅ |
Customer tickets reports
Menu Reports → Support → Customer tickets.
This option allows viewing the number of incidents created, resolved, and in progress, grouped by user, year, and month, filtered by:
- Company: Company filter, it is mandatory.
- Users: Users, multiple option, allows selecting one or more users from the selected company. By default it selects them all after the Report button is pressed.
- Show section state: It will show a table of ticket statuses grouped monthly and for each of the selected users.
- Show section type tickets: It will show a table of ticket types grouped monthly and for each of the selected users.
- Show section total: To view the globalized total of incidents.
- Created from Pandora FMS (Created from Pandora FMS): This filter allows separating the report by incidents created from PFMS or from PITSM (it will only be useful for customers who have a PFMS associated with PITSM).

In case of selecting from Created from Pandora FMS, and having an associated Pandora FMS, the first point will differentiate between the tickets created by the user, by Pandora FMS, and together. That is, it will draw three graphs per user and in the total tickets it will only add those created by the user.
| CSV | Full screen | |
|---|---|---|
| ❌ | ✅ | ✅ |
Project management
Menu Reports → Project Management.
With the reports generated on the registered projects, it is possible to view the information in a summarized way to plan times (and costs) and also see the evolution of the projects over time with the allocation of hours of the people collaborating in those projects.
General project report
Menu Reports → Project Management → General project report.
It quickly presents a selected project with the basic Show project option enabled by default, with options to filter and/or add features such as showing tasks and their work units, even in tabular form.
When using this option, and by default, no project is selected, so it shows an error message at startup. This message is normal and this is how it works.
Once one of the active projects has been selected, you can filter by milestones and tasks and their work units, each of them or all (default option), as well as by start or end date, for all people involved or a specific one.
In the case of Related company, it is marked as any by default. In case of selecting a company, keep in mind that if the project or task has a related organization or contract, the project or task cannot be related to an organization or contract.
- Show project option:
It shows all the basic project information, the people involved with a summary of the work done by them, and a cost summary. It presents graphs of the task distribution percentage, workload graph, and project activity graph, as well as a summary of all project tasks. For this option, no filtering of elements is necessary.
- Show task activity option:
According to the tasks selected in the list (can also be filtered by start and end date and/or milestones), for each of them, it will show a summary of hours worked, costs and their estimates, as well as graphs with work distribution by people and task activity for all involved people.
- Show task work unit option:
According to the tasks selected in the Tasks list (can also be filtered by start and end date and/or milestones), for each of them, it will show the date, duration, involved person or people, and the description of each of the work units of each task.
- Show in table option:
It shows in tabular form, according to filtering by start date, end date, or milestone, of all the people involved (or a specific one).
This Show in table option shows all the requested tasks according to the date and/or milestone and/or involved person(s) filter. It is recommended to set specific dates to obtain complete results.
| CSV | Full screen | |
|---|---|---|
| ✅ | ✅ | ✅ |
All projects report
Menu Reports → Project Management → All projects.
Most used filtering options:
- Text string that will search for matches in the project name and description (text field in String to match in name or description of project).
- Project owner (text field in Owner project).
- Involved person(s) (text field in People involved).
- Date (text field in Date and placing start in From and end of period in To).
- Project group (list in Project group).
- Included archived project: View archived projects, by default no.

With the filters set, when pressing the Report button, a list with the following information will be displayed:
- Id: Project identifier number.
- Group: Project group.
- Name: Project name.
- Owner: Project owner (Manager).
- People involved: People involved in the project.
- Progress Task: Total of completed tasks and progress percentage.
| CSV | Full screen | |
|---|---|---|
| ✅ | ✅ | ✅ |
Project expense report
Menu Reports → Project Management → Project expense report.
By default, it presents all projects started in the last month. You can refine the search by setting a start and/or end date and completion percentage. When activating the Show task breakdown option, each of the tasks of each project will be broken down.
When selecting a particular project and pressing the view report button, the filtering options by milestones will be activated.
| CSV | Full screen | |
|---|---|---|
| ✅ | ✅ | ✅ |
Project bundle of hours report
Menu Reports → Project Management → Project bundle of hours report.
For a selected project, month by month, you will obtain a summary by task and tickets (if any) with a total of consumed hours and hours to be consumed in each task.
In the case of Related company, it is marked as any by default. In case of selecting any company, keep in mind that if the project or task has a related organization or contract, the project or task cannot be related to an organization or contract. Having selected a company, the list in Related contract/s will be updated with the corresponding contracts, and you can choose the necessary ones for the report.
| CSV | Full screen | |
|---|---|---|
| ❌ | ✅ | ✅ |
Custom SQL report
Menu Reports → Custom SQL report.
There is a way to create fully customized reports, which return a table that can be exported to a spreadsheet or PDF: the custom SQL reports.
Only a superadmin or a user with Report Manager (RM) permission in an assigned profile can create, modify, and delete custom SQL reports.
For other users to have access to view this type of report, they must have the Report Reader (RR) permission within an assigned profile, and, in addition, they must belong to the same group as the report.
A simple query is to list the registered companies in order according to their country of origin:
SELECT id, name, country FROM tcompany ORDER BY country;

Once created, other users with access to the reports (and to the group) will be able to view and/or export them.

When clicking on the corresponding icon of each element in the View column, the requested list will be displayed in full screen:

The field names can be customized:
SELECT
  id AS `Identification number`,
  name AS Name,
  country AS `Country origin`
  FROM tcompany ORDER BY country;

Although access to SQL reports is strictly limited to specific users, for security the use of the following commands has been excluded:
DELETE, DROP, ALTER, TRUNCATE, CREATE, UPDATE, INSERT INTO, EXEC, MERGE
| CSV | Full screen | |
|---|---|---|
| ✅ | ✅ | ✅ |
Tips for creating SQL reports
Basic tips:
- In report templates, an element can be created for each custom SQL report by substituting the
_reportname_macro (which will always indicate the legendCustom SQL report) with the real name of the report and inserting the appropriate custom images. - By default, when creating an SQL report, it is automatically assigned the
Nonegroup; it is always recommended to assign a specific group to each new report.
Advanced tips:
- To know and have at hand the real names of the tables and their respective fields, you can create separate reports with the names and queries:
SHOW TABLES;andDESCRIBE <table_name>;
This avoids direct access and the creation and maintenance of users in the database, that is, the ACL is handled through PITSM.



