Reports
The reports section brings together reports from different areas: time management, support and projects. It also incorporates a custom report creator through SQL queries and a report scheduler to be able to plan automatic report creation and forwarding once in a while.
People management
Time control
Menu Reports → People management → Time tracking.
It allows to display in detail (daily, weekly or monthly) the activity recorded by users with the Time tracker. There are set time periods (this week, this month or the last three months) and any custom period cmay be requested.
There must be at least one daily record to display the report, otherwise the rest of the records will be empty.
| CSV | Full screen | |
|---|---|---|
| ✅ | ✅ | ✅ |
Detailed vacation report
Menu Reports → People management → Detailed vacation report.
The default vacation report option is presented and by clicking Search you will be presented with a complete list of users, total vacation days, days taken and to be taken, with the options of viewing full screen or exporting to PDF.
You may filter by user or group and include a specific time period (start and end) or with only a start date or an end date. If you use the option to show work units report you will obtain, in addition to the vacations, a total of unjustified days and justified days not worked (sickness).
| CSV | Full screen | |
|---|---|---|
| ❌ | ✅ | ✅ |
General vacation calendar
Menu Reports → People management → General vacation calendar.
It presents, by default, a monthly view of users with approved vacations. This monthly view may be changed to weekly or even daily period (for the latter case, each user with approved vacation takes the whole day for it).
You may only go forward or backward by month, having the option to go to the current date by means of the Today button.
People report
Menu Reports → People management → People report.
By default, it selects the current user for the last three months for all projects with ticket summaries. If there is registered activity, it will show:
- Project activity and percentage.
- Ticket graphic report.
- Graphical ticket report by group.
- Graphical ticket report by creator group.
- Report the ticket in tabular form (if Show only summary is disabled, this is the default value).
- Summary with number of tickets and total time worked.
| CSV | Full \ screen | |
|---|---|---|
| ✅ | ✅ | ✅ |
Monthly WU
Menu Reports → People management → People monthly WU.
By default it shows all users in the current month with a summary of total hours in the month and their average rating. You may filter by users as well as select the previous or next month, as the case may be.
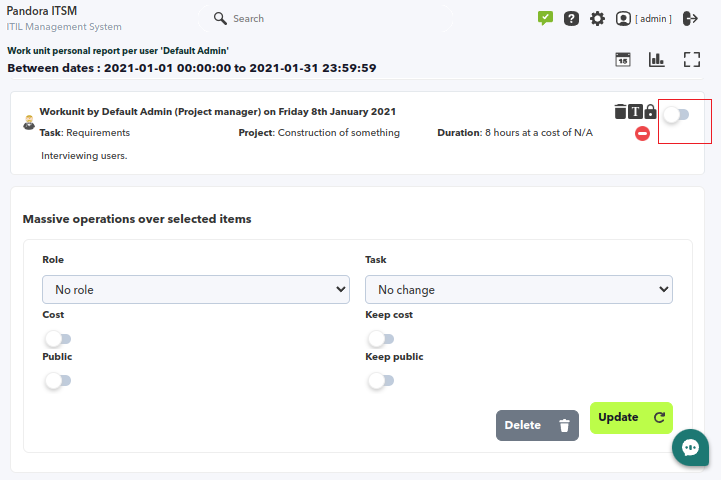
In the report column, for each user, there is a button that, when clicked, leads to a dialog box where you may edit, individually or massively, the work units performed by that user.
You may mass edit only the Work Unit Tasks, by selecting each of them and applying the options in Massive operations over selected items.
Each of the task work units, individually and according to user privileges, may be deleted, edited or even blocked to prevent the described actions.
Detailed user report
Menu Reports → People management → Detailed user report.
Options:
- Project
- Role and task
- Role and task (details)
You may select by user and time period project roles and tasks, for each of them, with a corresponding summary of hours and costs. For this option, tasks will be grouped by user and project.
On the contrary, the other two options will report for each user and task, keeping the columns of descriptions and totals of tickets, hours and costs.
| CSV | Full \ screen | |
|---|---|---|
| ❌ | ❌ | ❌ |
Export vacation report
Menu Reports → People management → Export vacation report.
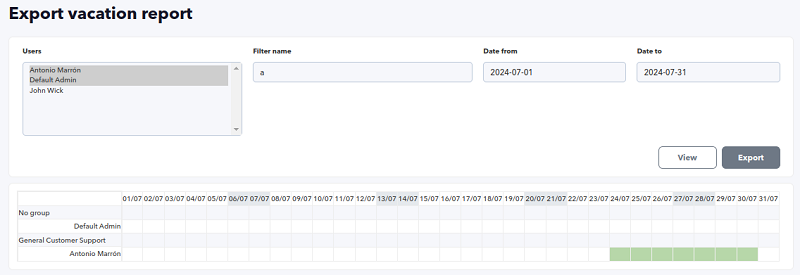
It presents all active users selected by default, you may select each one separately or filter by keyword in the user name. A start and end date must be selected in order to see the report through the View button.
Filtering by name will be performed by clicking the View button.
Both on the screen and with the Export button, data will be presented in spreadsheet format.
| CSV | Full \ screen | |
|---|---|---|
| ✅ | ❌ | ❌ |
Support
Support Report
Menu Reports → Support → Support report.
It allows you to create detailed reports that show dozens of graphs, summaries, lists and parameters in a single PDF report. For faster parameter selection, it is recommended to use a custom search as the report source.
It should always be kept in mind that after loading a custom filter, its values will not be reflected in the filter fields or in their title, and these fields will be locked. The two date fields, although they remain unlocked when loading a custom filter, are omitted in their values and the dates of the custom filter will always be displayed even if the title and fields indicate other values.
The report consists of two sections: statistical information with graphs, Show statistics, and tabular information on the tickets, Show list (one or both options must be selected to display the result). For the information via table, the necessary fields of the report may be selected in the Issue fields section without affecting the graphic part.
The report contains eight general pie charts with some groupings with the first values (Top-N): tickets with the highest activity, most active customers, by operator, open, closed, etc.
Lists and trend graphs:
| CSV | Full screen | |
|---|---|---|
| ❌ | ✅ | ✅ |
Detailed ticket report
Menu Reports → Support → Detailed ticket report.
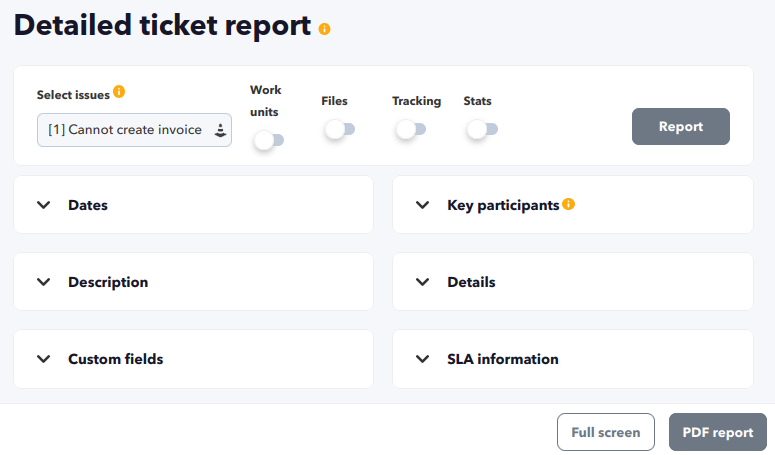
This report is specific to give all possible details of a support ticket. From general data (dates, main participants, description, details, custom fields and SLA information) as well as, optionally, work units, files, tracking and statistics.
As seen on the screen, the report will be exported to PDF (except for the Tracking option) when requested:
When requesting the Work units option, clicking on the paging selector will exit the report and enter the requested ticket edit:
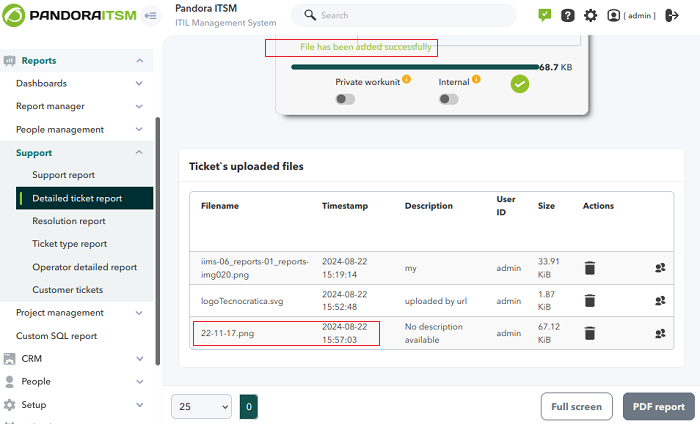
When selecting the Files option with Tracking and/or Stats, the dialog box to add more files to the ticket will appear, however when generating in PDF this dialog box will not be exported. After uploading any files through this option they will be immediately displayed in the attachment list:
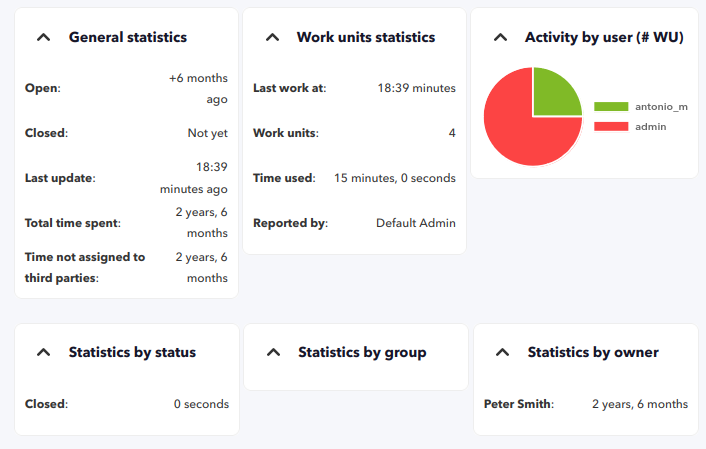
When requesting the Stats option, the statistics per group will be omitted since all the information displayed is only for a single ticket:
| CSV | Full \ screen | |
|---|---|---|
| ❌ | ✅ | ✅ |
Resolution report
Menu Reports → Support → Resolution report.
It is a technical report that shows a list of closed tickets oriented to find out the impact it had on time, “dead pauses”, people involved and resolution (including customer feedback).
It can be filtered by creation and closing date, ticket creator and company.
| CSV | Full \ screen | |
|---|---|---|
| ❌ | ✅ | ✅ |
Ticket type report
Menu Reports → Support → Ticket type report.
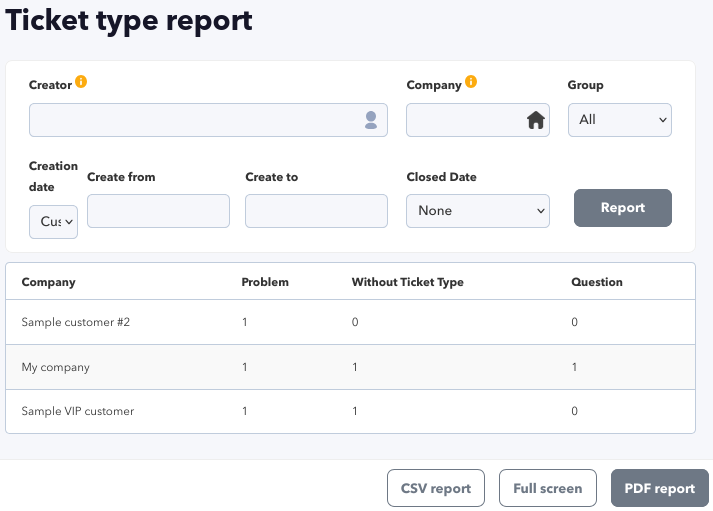
It is a simple report in list format that groups tickets by company (which creates the ticket), number of tickets by type in a given time interval.
It supports filtering by creator, company and group.
| CSV | Full \ screen | |
|---|---|---|
| ✅ | ✅ | ✅ |
Operator's report
Menu Reports → Support → Operator detailed report.
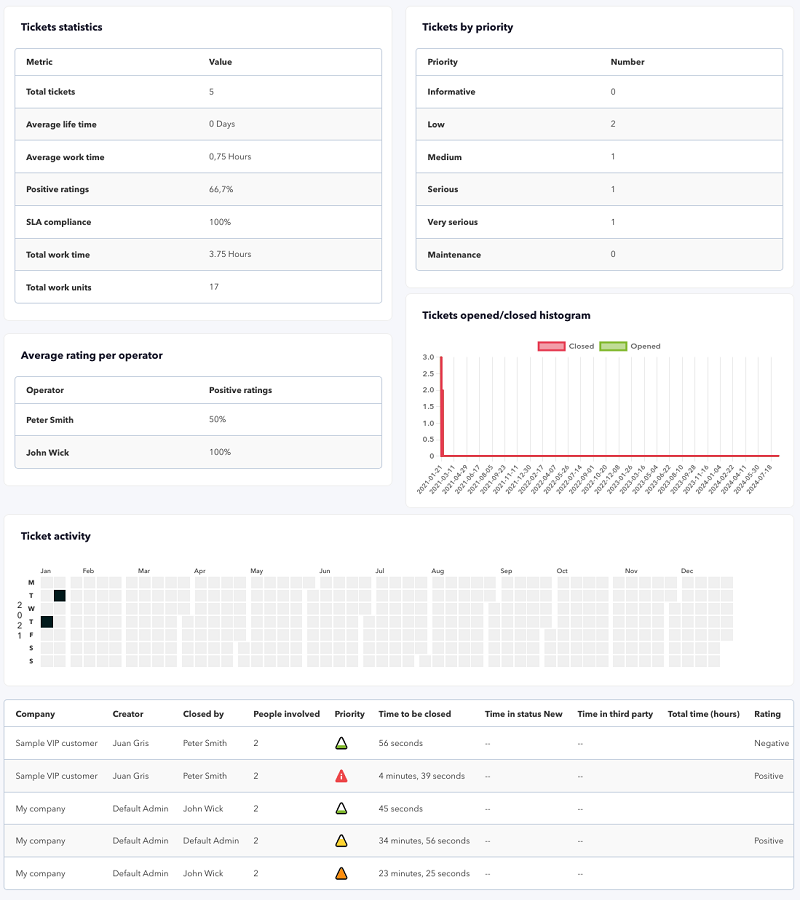
A specific report to control the quality of the support offered, showing metrics for each operator such as time spent, average ticket resolution time, customer feedback and total tickets (filtered by company, user, status and time frame).
| CSV | Full \ screen | |
|---|---|---|
| ✅ | ✅ | ✅ |
Customer incident reports
Menu Reports → Support → Customer tickets.
This option allows you to view the number of incidents created, solved and in progress, grouped by user, year and month, filtered by:
- Company: Filter company, it is mandatory.
- Users: Users, multiple choice, it allows you to select one or several users from a selected company.
- Show section state: It will display a table of ticket statuses grouped on a monthly basis and for each of the selected users.
- Show section type tickets: It will display a table of ticket types grouped on a monthly basis and for each of the selected users.
- Show section total: To display the global amount of incidents.
- Created From pandora (Created from Pandora FMS): This filter allows to separate the report by incidents created from PFMS or from PITSM (it will only be useful for customers who have PFMS associated to PITSM).
In the case of selecting from Created From pandora, and having Pandora FMS associated, the first point will differentiate between tickets created by users, by Pandora FMS and together. That is to say, it will draw three graphs per user and in the ticket total it will only add the ones created by the user.
| CSV | Full \ screen | |
|---|---|---|
| ❌ | ✅ | ✅ |
Project management
Menu Reports → Project Management.
General Project Report
Menu Reports → Project Management → General project report.
It quickly displays a selected project with the basic Show project option enabled by default, with options for filtering and/or adding features such as displaying tasks and their work units, even in tabular form.
When using this option and by default no project is selected, so it shows an error message at startup. This message is normal and this is how it works.
Once you select one of the active projects, you may filter by milestones and tasks and their work units, each of them or all of them (default option) as well as by start or end date, for all the people involved or one in particular.
Option Show project:
It displays all basic information on the project, the people involved with a summary of the work performed by them and a summary of the cost. It presents graphs of the percentage distribution of tasks, workload graph and project activity graph as well as a summary of all project tasks. No element filtering is required for this option.
Option Show task activity:
According to the tasks selected in the list (you may also filter by start and end date and/or milestones), for each of them, it will show a summary of hours worked, costs and their estimates, as well as graphs with work distribution by people and task activity for all people involved.
Option Show task work unit:
According to the tasks selected in the Tasks list (you may also filter by start and end date and/or milestones), for each of them, it will show the date, duration, person or people involved and the description of each of the work units of each task.
Option Show in table:
It displays in tabular form, filtered by start date, end date or milestone, all people involved (or one in particular).
This Show in table option shows all requested tasks according to date filter and/or milestone and/or person/people involved. It is recommended to set specific dates to obtain complete results.
| CSV | Full \ screen | |
|---|---|---|
| ✅ | ✅ | ✅ |
Report of all projects
Menu Reports → Project Management → All projects.
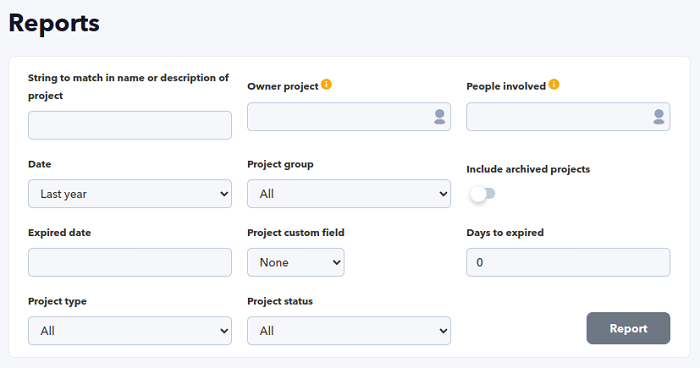
Most commonly used filtering options:
- Text string that will search for matches in name and description of the project (text field in String to match in title or description of project).
- Project owner.
- People involved.
- Date (text field in Date and setting start in From and end of period in To).
- Project group.
- Included archived project: Display archived projects, by default no.
With the filters set, clicking on the Report button will display a list with the following information:
- Id: Project identification number.
- Group.
- Name.
- Owner: Project owner (Manager).
- People involved.
- Progress Task.
| CSV | Full \ screen | |
|---|---|---|
| ✅ | ✅ | ✅ |
Project expenditure report
Menu Reports → Project Management → Project expense report.
By default, all projects started in the last month are displayed. You may refine the search by setting start and/or end dates and the completion percentage. By enabling the Show task breakdown option, each project task will be broken down.
Selecting a particular project and clicking on the view report button will activate the milestone filtering options.
When using the full screen option, zoom out to see the whole report.
| CSV | Full \ screen | |
|---|---|---|
| ✅ | ✅ | ✅ |
Project hours report
Menu Reports → Project Management → Project bundle of hours report.
For a selected project, month by month, a summary will be obtained by task and tickets (if any) with a totalization of hours used and hours to be used in each task.
| CSV | Full \ screen | |
|---|---|---|
| ❌ | ✅ | ✅ |
GitLab reports
By enabling and configuring the connection to a GitLab instance, and having executed or scheduled the daily query with that instance, you will be able to obtain several types of reports.
GitLab activity summary
Menu Reports → Project Management → GitLab Activity Summary:
It has a filter that allows you to choose person and date range. It displays a table with the following information:
- Person.
- Total time spent by that person.
- ID# of tickets with time spent, separated by commas and link to the URL of the configured GitLab instance.
GitLab detailed activity
Menu Reports → Project Management → GitLab Detailed Activity:
It features a filter that allows you to choose person and date range to find out the detailed activity of incidents in GitLab.
GitLab weekly
Menu Reports → Project Management → GitLab Weekly:
It allows filtering by date range and person, on a weekly basis, with the additional option of displaying all incident metrics or filtered by:
- Reopened.
- Percentage of reopenings.
- Tickets by hour.
- Estimated time.
- Total time.
- Total tickets.
Custom SQL report
Menu Reports → Custom SQL report.
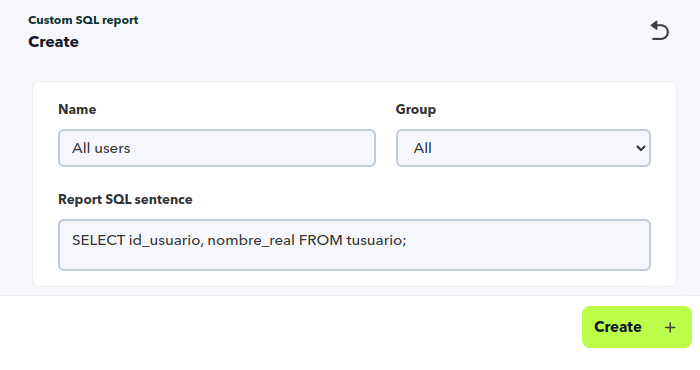
There is a way to create fully custom reports that return a table that can be exported to a spreadsheet or PDF: custom SQL reports.
Only a superadmin or a user with a Database management (DM) profile may create them and needs to know SQL and the internal structure of the DB.
Once created, other users with access to the reports (and the group) will be able to see and/or export them.
| CSV | Full \ screen | |
|---|---|---|
| ✅ | ✅ | ✅ |
Report manager
Menu Reports → Report manager.
With the report manager you may create templates and a report generation schedule to be stored in the system's report library and to be notified or sent by e-mail.
Report templates
Menu Reports → Report manager → Templates.
Templates consist of defining the report cover page, page header and footer, which uses some macros (cover and footer) to show the date and time of generation and the type of report in question. They are used to generate PDF reports and for the report scheduler.
For the first page there is an editor that allows you to add images, links, format the text and set the margins and you may use the following macros:
_fullname_will replace the name of the report creator._date_will show the date on which the report is generated._time_will show the time at which the report is generated._reportname_to replace with the name of the report.
These macros are also applicable to the header and, in addition, the header logo may be customized. Each of these three elements, cover, header and footer, may be disabled.
Report scheduler
A report may be scheduled to run only once, every week or every month, to be generated according to a template and stored in the system library. In addition to storage, it allows a notification, or even the report itself, to be sent by e-mail.
Optionally, it is recommended for the scheduled report to belong to a company so that users belonging to that company may view and edit the scheduled report.
Depending on the report type chosen, the same filtering mechanisms will be presented for each report type, except for Custom SQL, which will only show the SQL reports created.
You may create as many schedules as you need.
cron must be activated in the system for reports to be generated.
Through the menu Reports → Report manager → Report library, the generated reports may be accessed and searched by report type and/or report name.
Dashboards
Dashboards allow to have at a glance the information considered most important when logging into Pandora ITSM. For that purpose, they may be customized for each user, creating different dashboards for each of them.
Menu Reports → Dashboards → Manage Dashboard
In this listing, it will be possible to filter by keyword in the text box and Search button, for a new Dashboard presents the Create button. Each Dashboard listed has two buttons in the Actions column to edit your data(Update) and delete(Delete) each corresponding item.
Clicking on each Dashboard name will allow you to edit its content, essentially adding and/or removing widgets.
Creation
Menu Reports → Dashboards → Manage Dashboard → Create.
A Name must be specified, this name must be unique in the system. After selecting a Group click Create again.
The process of editing these two Dashboard data is similar to the creation process and is accessed by clicking on the corresponding Update button in the dashboard list.
Editing
By clicking on the name of the dashboard to be edited in the home list you may add widgets and configure each of them.
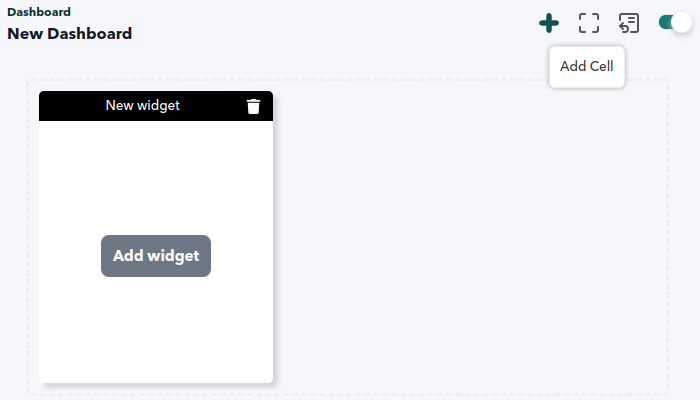
To start editing, click on the slider button, last on the right:
A plus sign icon(Add cell) will appear, with which a cell containing a widget may be added. In each widget added (New widget) you may assign the type of widget desired by means of the Add widget button.
Widgets
Each added widget may be configured by clicking on the gear icon , or may be deleted with the trash can icon
, both located in the upper right corner.
You may move (“drag and drop”) each widget in its window title with the mouse and modify its size by placing the pointer on the borders until it changes and shows one or two arrows and then dragging and dropping the border (or corner) until the desired size is achieved.
Custom links
It allows you to add a fully functional link that opens in the same window or in a new tab. When adding the URL, it must begin with http:// or https:// and an image must be chosen, both of which are necessary for the widget to work. The other elements are optional and offer to add a text to the link, title, font, colors, and so on.
Message board
It features a complete rich text editor (tables, links, images, lists, etc.) to embed even complete documents into the Dashboard. For that, it has an integrated menu in which you may check out its help, including the keyboard shortcuts predefined in this object.
Predefined links
When you need internal links (with label and allusive icons) to the PITSM Web Console itself, use the widget Predefined links:
- KB: Link to the knowledge base.
- Downloads: Support and downloads.
- Create ticket: Ticketing and support.
- Wiki: Pandora ITSM Wiki.
- Time tracker: Time management, activity log.
- My tickets: Link to filter and view tickets.
Search box
It allows you to add a keyword search box in the following areas, all of which are optional (at least one must be selected):
- Knowledge base.
- Wiki.
- Tickets.
- Projects.
- Persons.
- Contacts.
- Contracts.
- Companies.
- Invoices.
- Leads.
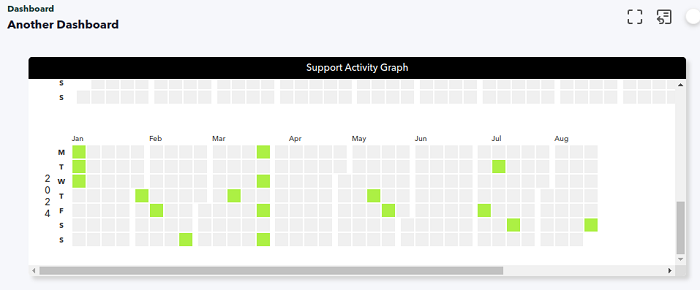
Support Activity Graph
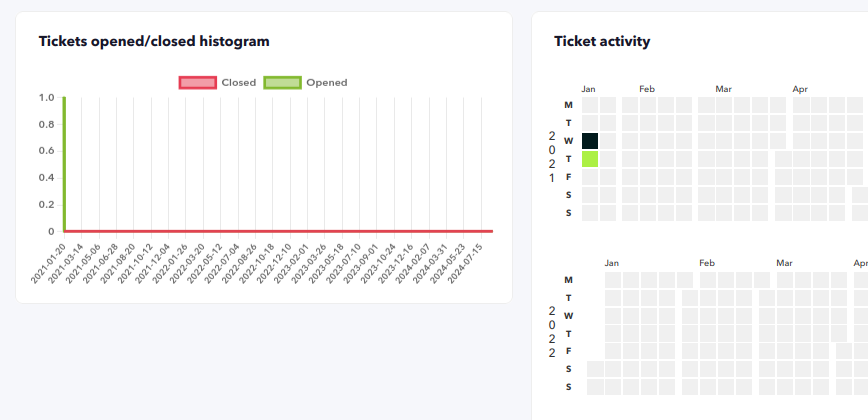
By means of previously saved filters you may display a graph indicating activity in one or several calendars:
Support Evolution Graph
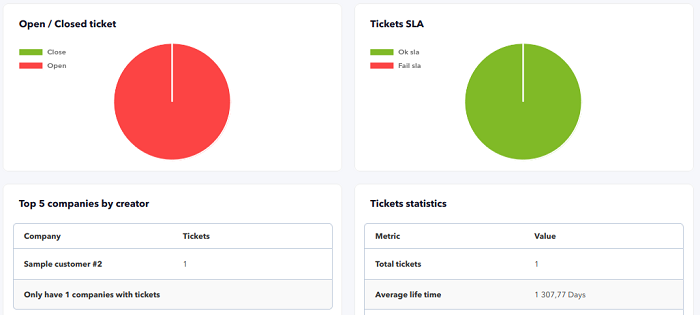
It presents a graph with open and closed tickets by choosing a previously saved filter and with a customizable data refresh rate.
Support SLA
Choosing a saved filter allows you to display a pie chart with the percentage of successful and failed SLAs.
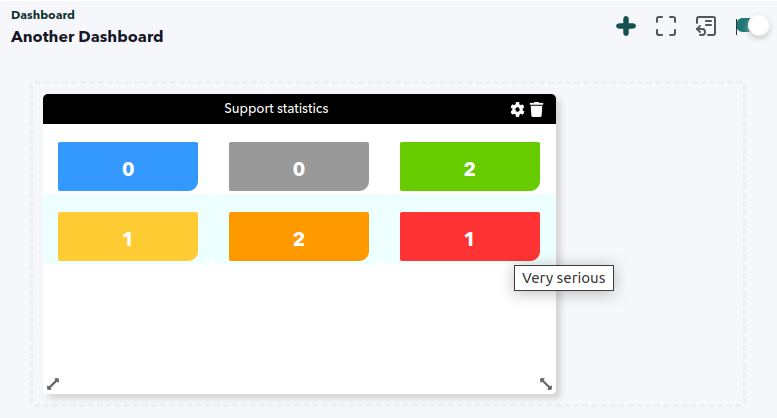
Support statistics
With a saved custom filter, tickets are selected and grouped according to their priority:
You may also group by ticket status, display general statistics or group by ticket type.
Ticket list
It displays a list of tickets with a default pagination of 5 elements, allowing the choice of the fields to be displayed and their order. To obtain the information a saved filter is chosen with a time period to keep the information updated in real time.


 Home
Home

