Network traffic monitoring with NetFlow and sFlow
Introduction to real time network analysis
Pandora FMS uses a tool to analyse the network in real time: Netflow. It uses the principle of “listening” over Ethernet in a continuous way and analyzes the traffic to generate statistics. The idea is to “intercept” the network traffic to send it to a probe that will analyse it and send those results to Pandora FMS.
To intercept network traffic and be able to analyse it, it is necessary to have physical access to that network or at least understand its topology, since the network capture point must be the most appropriate. It is not the same, for example, to capture the network traffic of a local router or AP, as that of all the server network traffic just before reaching the outgoing router.
To capture such data, traffic must be redirected from one port of the switch to another port using a “port-mirror”. Not all network devices allow this (only mid/high range). A port-mirror can also be made on some commercial firewalls. This is the easiest way to intercept traffic and requires no additional hardware. By sending all traffic to a port, that port is connected directly to the network analyzer (netflow probe).
These high-end switches and/or firewalls make monitoring easier. This is due to the fact that these devices send the network flow statistical information directly to Pandora FMS's Netflow collector without the need of using a separate probe. You should consult the characteristics of the hardware to know if you can enable Netflow and send the flows to an independent Netflow collector (in this case, the Pandora FMS Netflow collector).
NetFlow network monitoring
Introduction to NetFlow
Pandora FMS version 5 and above are designed to monitor IP traffic by using the NetFlow protocol. This protocol allows to review the traffic's most useful patterns and general data.
NetFlow is a network protocol, developed by Cisco Systems to collect IP traffic information. It has become an industrial standard for network traffic monitoring and is currently supported by several platforms besides Cisco IOS and NXOS like Juniper devices, Enterasys Switches and operating systems like Linux, FreeBSD, NetBSD and OpenBSD.
NetFlow protocol
NetFlow-enabled devices generate “NetFlow records”, which consist of small pieces of information which are sent to a central device (NetFlow server or collector), which receives device information (Netflow probes), stores and processes it.
Data is transmitted using the NetFlow protocol based on UDP or SCTP protocols. A NetFlow record is a small packet that contains only statistical information about a connection, not the whole raw data. That means it does not send the traffic payload that goes through the collector, only statistical data.
There are several NetFlow implementations that may differ from the original specification and include additional information, but most of them provide at least the following information. Although Netflow has been described in many ways, Cisco's traditional definition is using a 7-element key, where the flow is defined as one-way sequence of packets that share the following 7 values:
- The source IP address.
- The target IP address.
- The source UDP or TCP port.
- The target UDP or TCP port.
- The IP protocol.
- An interface (SNMP ifIndex)
- The type of service.
In time, some manufacturers have designed similar protocols with different names but for the same purpose:
- Juniper Networks Jflow or cflowd
- 3Com/H3C/HP NetStream
- Huawei NetStream
- Alcatel Lucent Cflowd
- Ericsson Rflow
- AppFlow
- sFlow
NetFlow Collector
A NetFlow collector is a device (a PC or a Server), embedded in a network to gather all NetFlow information which is sent by routers and switches.
NetFlow generates and collects that information, but if needs a software that allows to store and analyze said traffic. Pandora FMS uses an specific server for this purpose, that will be started and shut down when Pandora FMS starts. That server's name is nfcapd and it is necessary to install it to be able to use Netflow monitoring.
NetFlow Probe
Probes are usually NetFlow-enabled routers, configured to send information to NetFlow collector (in this case Pandora FMS server with nfcapd daemon running).
There is an step-by-step technical article in our blog about how to create a Netflow probe using a 60€ RaspBerry Pi hardware, take a look at https://pandorafms.com/blog/netflow-probe-using-raspberry/
Installation and requirements
Pandora FMS uses an open-source tool called nfcapd (that belongs to the nfdump package) to process all NetFlow traffic. This daemon is automatically started by the Pandora FMS Server. This system stores data in binary files at a specific location. You must install nfcapd on your system before working with NetFlow in Pandora FMS.
Daemon nfcapd listens on port 9995/UDP by default, so keep it in mind if you have firewalls to open this port and when configuring NetFlow probes.
nfcapd installation
Install nfcapd manually, because Pandora FMS will not install it by default. For more information on how to install it, visit the Official NFCAPD Project Page.
Pandora FMS uses the directory '/var/spool/pandora/data_in/netflow' by default to process information, so when it is started 'nfcapd' will use that directory. Do not modify it unless you know exactly what you are doing.
Install nfdump version 1.6.8p1 to use it with Pandora FMS
In order to test whether 'nfcapd' is properly installed, execute this command to start the process.
nfcapd -l /var/spool/pandora/data_in/netflow -D
If everything works, you should see an output similar to this one:
 Add extension: 2 byte input/output interface index
 Add extension: 4 byte input/output interface index
 Add extension: 2 byte src/dst AS number
 Add extension: 4 byte src/dst AS number
 Add extension: 4 byte output bytes
 Add extension: 8 byte output bytes
 Add extension: NSEL Common block
 Add extension: NSEL xlate ports
 Add extension: NSEL xlate IPv4 addr
 Add extension: NSEL xlate IPv6 addr
 Add extension: NSEL ACL ingress/egress acl ID
 Add extension: NSEL username
 Add extension: NSEL max username
 Add extension: NEL Common block
 Bound to IPv4 host/IP: any, Port: 9995
 Startup.
 Init IPFIX: Max number of IPFIX tags: 62
Keep in mind that Pandora FMS Console (and more specifically the web server that runs it) must have access to those data. In this example they are located at /var/spool/pandora/data_in/netflow.
Probe Installation
If a NetFlow-enabled router is not available, but you use a Linux server to route your traffic, you may install a NetFlow software to work as a probe and sends all NetFlow-related information to the collector.
Installing fprobe
fprobe captures traffic and sends it to a NetFlow Server. You may generate NetFlow traffic with it, among all the traffic that goes through its interfaces.
CentOS 7:
To download the rpm package you may use the following command and then install it:
 wget http://repo.iotti.biz/CentOS/7/x86_64/fprobe-1.1-2.el7.lux.x86_64.rpm
 yum install fprobe-1.1-2.el7.lux.x86_64.rpm
For instance, executing this command, all eth0 interface traffic will be sent to the NetFlow collector listening on port 9995 of the IP address 192.168.70.185:
/usr/sbin/fprobe -i eth0 -fip 192.168.70.185:9995
Once the traffic has been generated, you may see its statistics in the NetFlow collector by entering this command:
nfdump -R /home/netflow_data/
It should display similar information to the one shown below.
 Aggregated flows 1286
 Top 10 flows ordered by packets:
 Date flow start          Duration Proto      Src IP Addr:Port          Dst IP Addr:Port   Packets    Bytes Flows
 2011-12-22 20:41:35.697   901.035 TCP     192.168.60.181:50935 ->     192.168.50.2:22        2105   167388     4
 2011-12-22 20:41:35.702   900.874 TCP       192.168.50.2:22    ->   192.168.60.181:50935     1275   202984     4
 2011-12-22 20:48:15.057     1.347 TCP       157.88.36.34:80    ->    192.168.50.15:40044      496   737160     1
 2011-12-22 20:48:14.742     1.790 TCP     91.121.124.139:80    ->    192.168.50.15:60101      409   607356     1
 2011-12-22 20:46:02.791    76.616 TCP      192.168.50.15:80    ->   192.168.60.181:40500      370   477945     1
 2011-12-22 20:48:15.015     1.389 TCP      192.168.50.15:40044 ->     157.88.36.34:80         363    22496     1
 2011-12-22 20:46:02.791    76.616 TCP     192.168.60.181:40500 ->    192.168.50.15:80         303    24309     1
 2011-12-22 20:48:14.689     1.843 TCP      192.168.50.15:60101 ->   91.121.124.139:80         255    13083     1
 2011-12-22 20:48:14.665     1.249 TCP     178.32.239.141:80    ->    192.168.50.15:38476      227   335812     1
 2011-12-22 20:48:21.350     0.713 TCP     137.205.124.72:80    ->    192.168.50.15:47551      224   330191     1

 Top 10 flows ordered by bytes:
 Date flow start          Duration Proto      Src IP Addr:Port          Dst IP Addr:Port   Packets    Bytes Flows
 2011-12-22 20:48:15.057     1.347 TCP       157.88.36.34:80    ->    192.168.50.15:40044      496   737160     1
 2011-12-22 20:48:14.742     1.790 TCP     91.121.124.139:80    ->    192.168.50.15:60101      409   607356     1
 2011-12-22 20:46:02.791    76.616 TCP      192.168.50.15:80    ->   192.168.60.181:40500      370   477945     1
 2011-12-22 20:48:14.665     1.249 TCP     178.32.239.141:80    ->    192.168.50.15:38476      227   335812     1
 2011-12-22 20:48:21.350     0.713 TCP     137.205.124.72:80    ->    192.168.50.15:47551      224   330191     1
 2011-12-22 20:48:15.313     1.603 TCP       89.102.0.150:80    ->    192.168.50.15:52019      212   313432     1
 2011-12-22 20:48:14.996     1.433 TCP     212.219.56.138:80    ->    192.168.50.15:36940      191   281104     1
 2011-12-22 20:51:12.325    46.928 TCP      192.168.50.15:80    ->   192.168.60.181:40512      201   245118     1
 2011-12-22 20:52:05.935    34.781 TCP      192.168.50.15:80    ->   192.168.60.181:40524      167   211608     1
 2011-12-22 20:41:35.702   900.874 TCP       192.168.50.2:22    ->   192.168.60.181:50935     1275   202984     4

 Summary: total flows: 1458, total bytes: 5.9 M, total packets: 15421, avg bps: 49574, avg pps: 15, avg bpp: 399
 Time window: 2011-12-22 20:40:46 - 2011-12-22 20:57:21
 Total flows processed: 1458, Records skipped: 0, Bytes read: 75864
 Sys: 0.006s flows/second: 208345.2   Wall: 0.006s flows/second: 221177.2
If your system works properly, the following step is configuring Pandora FMS in order to use this particular configuration.
Installing pmacct
Experimental.
Among many features of the pmacct probe there is the ability to work with NetFlow v1/v5/v7/v8/v9, sFlow v2/v4/v5 over IPv4 and IPv6.
The source code is hosted at:
Rocky Linux 8
Install dependencies with administrator rights:
dnf config-manager --set-enabled powertools
dnf groupinstall 'Development Tools'
dnf install libpcap libpcap-devel
Download pmacct source code (you may use curl instead of wget) and build it:
cd /tmp
wget -O pmacct-1.7.7.tar.gz "https://github.com/pmacct/pmacct/releases/download/v1.7.7/pmacct-1.7.7.tar.gz"
tar xvzf pmacct-1.7.7.tar.gz
cd pmacct-1.7.7
./autogen.sh
./configure
make && make install
Start pmacct as a NetFlow probe in daemon mode:
- Create pmacct config.
For instance, all eth0 interface traffic will be sent to the NetFlow collector listening on port 9995 of the IP address 192.168.70.185:
cat> pmacctd_probe.conf <<EOF
daemonize: true
pcap_interface: eth0
aggregate: src_host, dst_host, src_port, dst_port, proto, tos
plugins: nfprobe
nfprobe_receiver: 192.168.70.185:9995
nfprobe_version: 9
EOF
- Start pmacctd:
# pmacctd -f pmacctd_probe.conf
Working with NetFlow under Pandora FMS
Pandora FMS works along with Netflow as an auxiliary system, that means it does not store NetFlow data in its database. Pandora FMS shows that information as reports on demand.
Pandora FMS works with NetFlow data by using filters, which are sets of rules that match certain traffic patterns. A rule can be as simple as 'all the traffic from 192.168.70.0/24 network' or a complex pcap filter expression.
Once filters are created, define reports that determine how the information matched by those filters will be displayed (e.g. charts and tables) and the time frame. When defining filters and reports, set that information so that it can be accessed on demand similar to Pandora FMS reports.
Netflow reports appear as “report type” in Pandora FMS custom report section, to be able to add them to Pandora FMS “normal” reports
There is also a real-time console view to analyze the traffic, creating rules on the spot. It can be very useful to investigate problems or temporarily display charts that do not match a specific filter.
Configuration
Access speed to the hard drive where NetFlow data are stored is usually the key factor for performance limits.
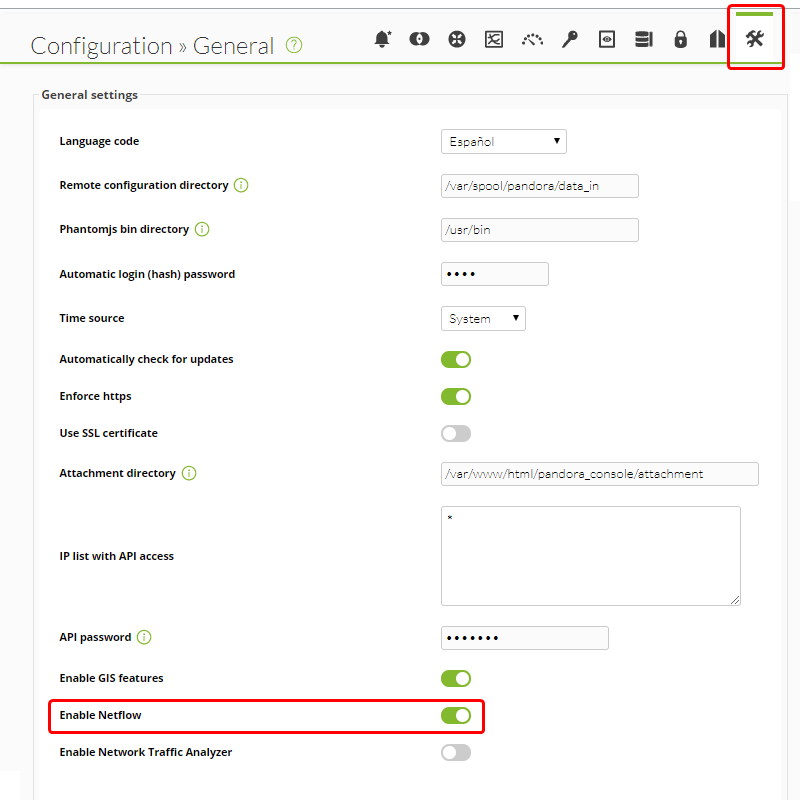
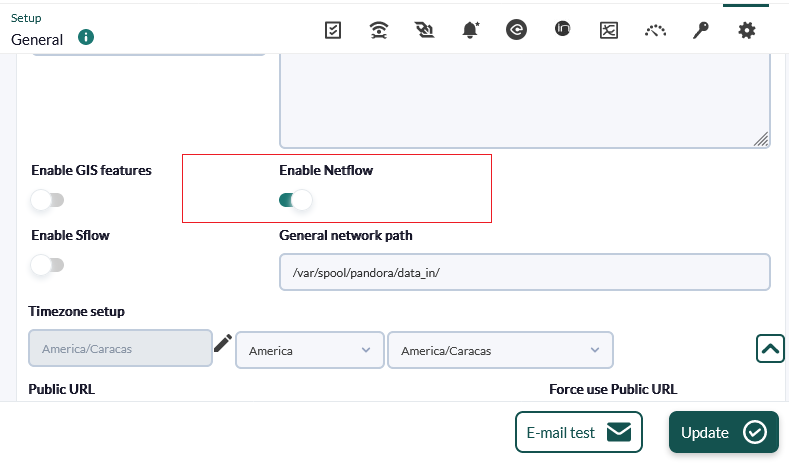
First of all, enable NetFlow so that it becomes accessible from the Operation and Administration menus. In the Configuration section (Management menu) there is an option for globally enabling or disabling NetFlow.
For version 769 and earlier:
For version 770 and later:
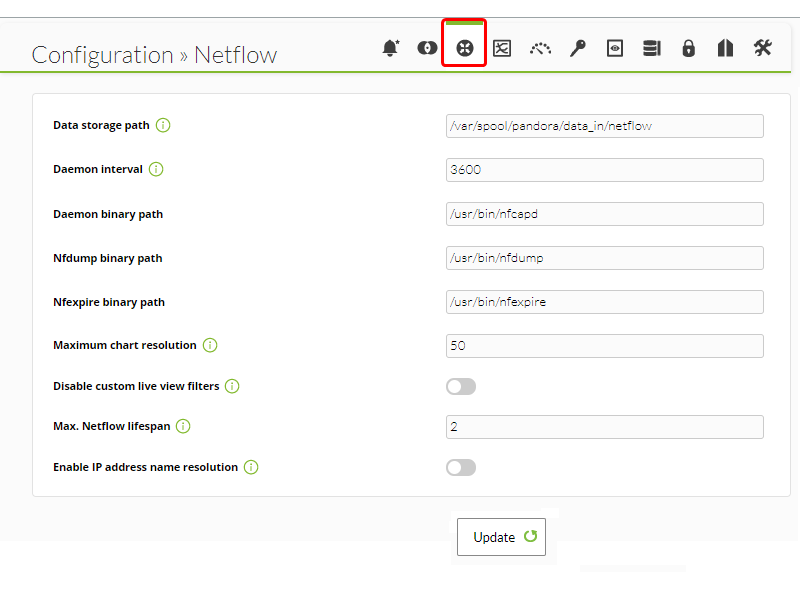
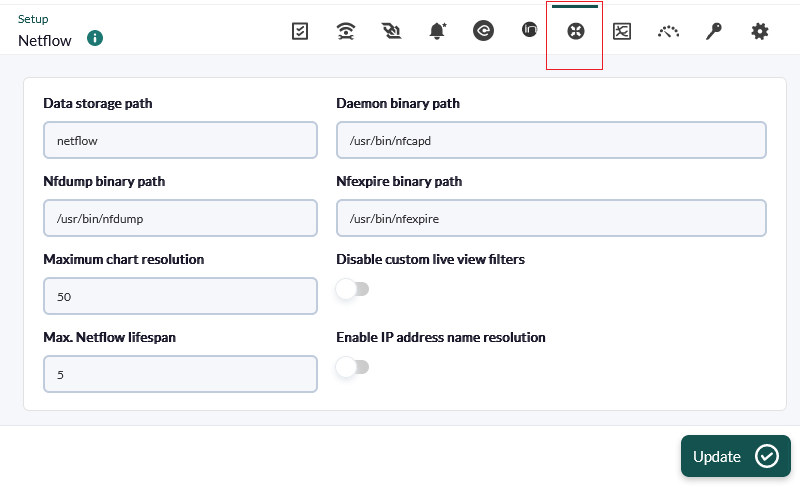
Once activated, a new NetFlow configuration option will appear in the setup section.
For version 769 and earlier:
For version 770 and later:
This section must be correctly configured so that the nfcapd daemon may be started together with Pandora FMS server:
- Data storage path: The directory where NetFlow data files are stored.
- For version 769 and earlier enter the full path.
- For version 770 and later only the directory name, by default
netflow(see General Setup).
- Daemon binary path: The path to the nfcapd binary.
- Nfdump binary path: The path to the nfdump binary.
- Nfexpire binary path: The path to the nfexpire binary.
- Maximum chart resolution: The maximum number of points displayed by a NetFlow area chart. The higher the resolution, the lower the performance. Values between '50' and '100' are recommended here.
- Disable custom live view filters: It disables defining custom filters from the NetFlow view (only for previously created filters).
- NetFlow max. lifespan: Maximum number of days NetFlow data will be stored before being deleted.
- Enable IP address name resolution: Il allows IP resolution to try to retrieve the hostnames from NetFlow devices.
- Daemon interval: (NG 769 version or earlier) Time interval in seconds for data rotation. The recommended value is '3600'. A wider interval means potentially bigger files, which means less I/O overhead, but it also renders accessing data for a specific time interval slower.
Version 770 or later:
In case you need to change the default value of the Daemon interval you should perform the following:
- Through a command line session or through the DB Interface modify the value in seconds of the
netflow_intervaltoken, for example to change it to 300 seconds:UPDATE tconfig SET value = '300' where token = 'netflow_interval'; - Open a terminal window and delete the data generated with the above interval with
rm -i /var/spool/pandora/data_in/netflow. - Start PFMS server.
Once NetFlow is configured in the console, restart Pandora FMS Server so that it starts the nfcapd server. This server must be properly installed before trying to run it. Check server logs in case of doubt.
Version 769 and earlier: The NetFlow server will not appear as a server in Pandora FMS servers view, since it is not a Pandora FMS server. From version 770 onwards it does appear in the list.
If you decide to store the NetFlow data on a device other than PFMS server (see nfcapd installation procedure and the distributed configuration) copy the binary file /usr/bin/nfexpire to that device and add the following entry in /etc/crontab:
0 * * * * root yes 2>/dev/null | /usr/bin/nfexpire -e "/var/spool/pandora/data_in/netflow" -t X_days d
Where x_days is the maximum number of days old of NetFlow data to be retained on that device (in this particular case PFMS Console configuration will have no effect for that field).
Filters
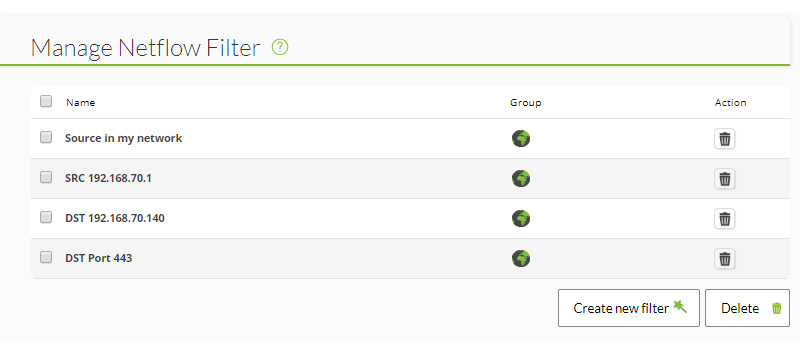
You may access the creation and edition of filters by clicking on Resources → Netflow filters.
This section contains a list of already created filters which can be modified or deleted.
You may also create a filter directly from the “Netflow live view”, saving the active filter as a new one. Netflow filters can be “basic” or “advanced”. The difference is that the former have fixed filtering fields (source IP, target IP, source port, target port) and the advanced ones are defined by the expression pcap (standard in filtering expressions for network traffic) and use all kinds of tools.
Filter creation
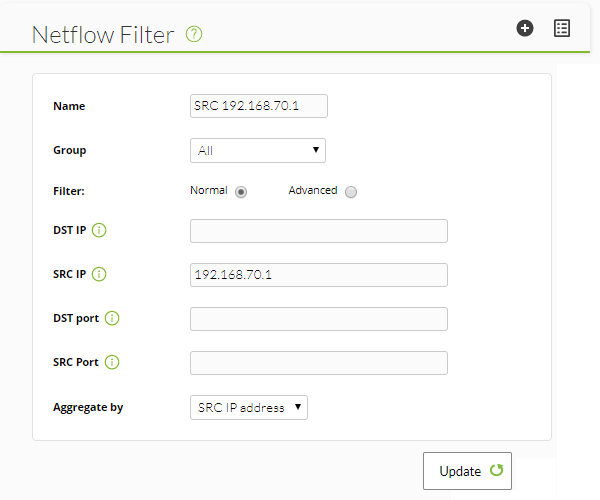
This would be a basic editing view of a Netflow filter:
- Name: It is recommended for the filter's name to be quite descriptive.
- Group: A user can only create a filter or edit the filter of a group it has access to.
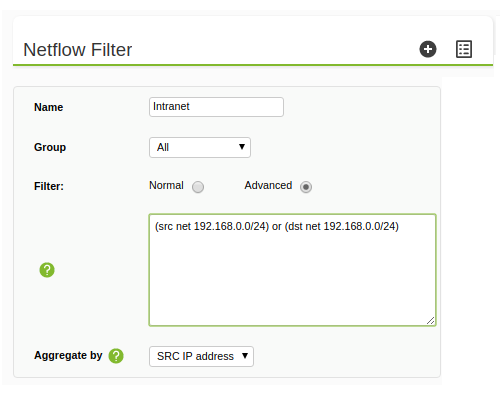
- Filter: There are two types of filters: Basic and advanced. Advanced filters allow using advanced expressions in the same format as 'nfdump'. Basic filters can filter traffic by source and target IP and source or target port. Lists of comma-separated IPs or ports are also accepted here.
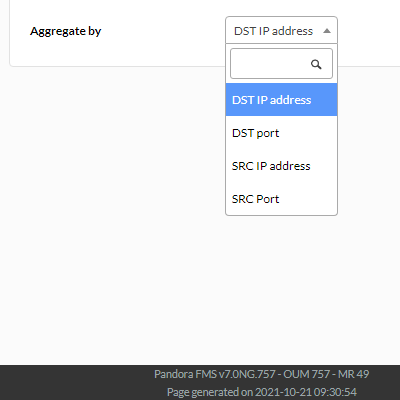
- Aggregate by: All traffic data can be grouped by one of the following criteria:
- DST IP address: Group traffic of each IP from a different source.
- DST port: Group traffic of each IP with a different target.
- SRC IP address: Group traffic of each port from a different source.
- SRC Port: Group traffic of each port with a different target.
Examples
Basic web traffic filter example:
Advanced intranet traffic filter example:
Here are other examples of advanced filters:
- Capture traffic to or from 192.168.0.1:
host 192.168.0.1
- Capture traffic to 192.168.0.1:
dst host 192.168.0.1
- Capture traffic from 192.168.0.0/24:
src net 192.168.0.0/24
- Capture HTTP and HTTPS traffic:
(port 80) or (port 443)
- Capture all traffic except for DNS:
port not 53
- Capture SSH traffic to 192.168.0.1 of the SSH protocol:
(port 22) and (dst host 192.168.0.1)
Reports
Netflow reports are integrated with Pandora FMS reports.
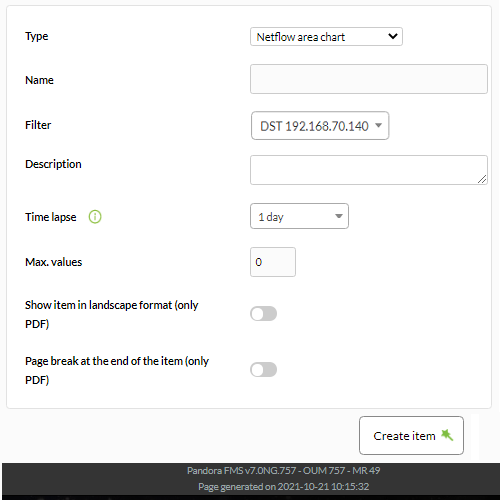
To create a report item, choose one of the available netflow report items.
And configure it. The following options are available:
- Type: Item types will be explained below.
- Filter: Netflow filter to use.
- Description: Item description.
- Period: Length of the interval of data to display.
- Resolution: Some reports require samples to be collected every certain period. This parameter is used to define the number of samples. The resolution may be low (6 samples), medium (12 samples), high (24 samples) or ultra-high (30 samples). There are two special values (hourly and daily) so that a fixed value of samples is not collected but one every certain period.
- Max. values: Maximum number of elements for aggregates. For example, if a chart of HTTP traffic is drawn aggregated by source IP address and Max. values is set to 5, only 5 IP addresses will be shown.
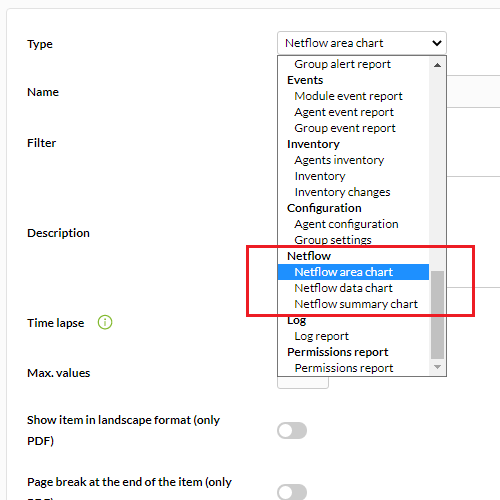
There are three types of netflow report items:
- Netflow area chart: An area chart, either aggregated or unaggregated.
- Netflow data chart: A text representation of the area chart.
- Netflow summary chart: Summary of traffic for the given period. There are three elements: a table with global information, a pie chart with the most relevant IPs or ports and a table with the same information as the broken down pie chart.
NetFlow real time view
This view is used to check captured data history based on different search filters. You may use filters and different ways of information display. It is necessary to define the way to group the displayed information, as well as the way to obtain this information in order to start seeing data.
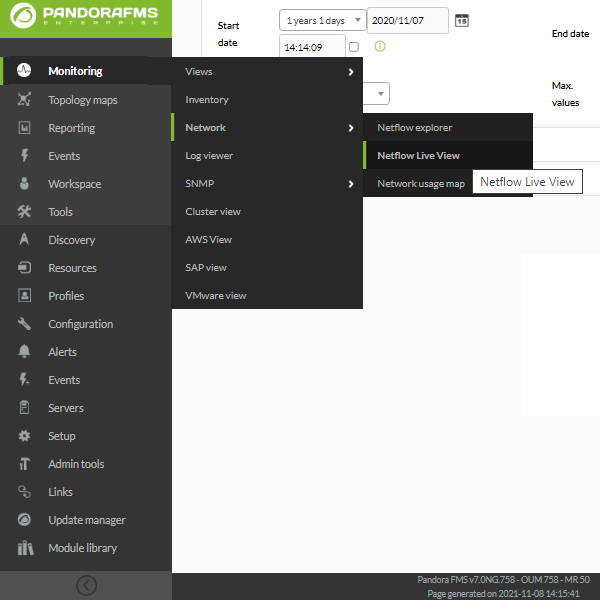
Filters can be seen in real time from Monitoring → Network → Netflow Live View. This tool allows you to see the changes that are made to a filter and save it once the desired result is obtained. It is also possible to load and modify existing filters.
See Reports and Filters to learn how to configure live view options.
The way to get the information can be by: source IP, target IP, source port or target port. If you choose, for example, to show the target IP information, the information ordered by the IP traffic to the target will be shown. The same would apply to finding out network consumption by protocol, choosing by destination port.
The possible display options are the following:
- Area graphs (stacked): They show over time (from source date to target date) data evolution. The precision level of the graph must be chosen in the “Resolution” token.
- Summary: It displays a summary table, a pie chart and a table with data for the entire period.
- Detailed: It shows a map of portions that represents IP traffic.
- Data table: It displays a data table with each IP and a number of rows that depends on the chosen resolution.
- Circle graph: It displays an interactive pie chart representing connection pairs between IP and traffic volume.
Network traffic maps
This is a new feature added in OUM 733 and will be improved in the future. It creates dynamic network maps, based on the traffic between nodes. It shows the relationship (connections) between different addresses, showing the top N connections (by size of data transferred between them).
Distributed configuration
It is possible to locate the Pandora FMS node that collects Netflow data on a host independent from the console. In environments with a lot of Netflow data it is more than recommended to place it on a server with fast disks and a fast CPU of at least two cores. In order for Pandora FMs console to retrieve Netflow data, it will be necessary to modify the default system configuration, following the steps described below:
- Configure automatic SSH authentication between the user who owns the web daemon and the user with the ability to run nfdump on the collector node.
For its configuration, follow these steps:
Enable the apache user login. In order to do this, modify the line of the apache user in the file /etc/passwd with this configuration :
apache:x:48:48:Apache:/var/www:/bin/bash
Create the .ssh directory inside the /var/www directory and give it the correct permissions:
 #mkdir /var/www/.ssh
 #chown apache:apache /var/www/.ssh
Create ssh keys from the apache user and copy them to the server where the Netflow traffic is hosted.
#su apache
bash-4.2$ssh-keygen
Generating public/private rsa key pair.
Enter file in which to save the key (/var/www/.ssh/id_rsa):
Enter passphrase (empty for no passphrase):
Enter same passphrase again:
Your identification has been saved in /var/www/.ssh/id_rsa.
Your public key has been saved in /var/www/.ssh/id_rsa.pub.
The key fingerprint is:
SHA256:vYvl5V00E4faa14zN08ARzGUQ9IfAQJnMzkaqLAGRHI apache@<server>
The key's randomart image is:
+---[RSA 2048]----+
|+oE     ...*o=B+.|
|.o .   . .oo+o++ |
|  . o .   o o o+o|
|   o .   o   =  +|
|  .     S . . oo.|
|           .   +o|
|          o . o+=|
|         + + + +*|
|        . o . o .|
+----[SHA256]-----+
bash-4.2$ ssh-copy-id root@<netflow_server>
Once shared, it must be verified that it is possible to access the server through the apache user without entering a password:
bash-4.2$ ssh usuario@<netflow_server>
- Create a script in Pandora FMS console that replaces /usr/bin/nfdump with one similar to the following
#!/bin/bash
NFDUMP_PARAMS=$(sed 's/(\(.*\))/\"\(\1\)\"/' <<<"$@");

ssh usuario@<netflow_server> "/usr/bin/nfdump $NFDUMP_PARAMS"
Give the script execution permissions:
chmod 755 /usr/bin/nfdump
Try executing the script like this:
/usr/bin/nfdump -V
It should return something similar to:
nfdump: Version: 1.6.13
Network monitoring with sFlow
NG 770 version or later.
From Pandora FMS version 770 onwards, support for sFlow, a network protocol which is an industry standard in hardware manufacturing for data network traffic, is included.
The operation of sFlow in PFMS is similar to the one established with NetFlow. In case both protocols are active, the data will be grouped together; in any case they will always be displayed by accessing the Operation menu in the left sidebar, and then clicking on Network.
sFlow configuration
NG 775 version or later.
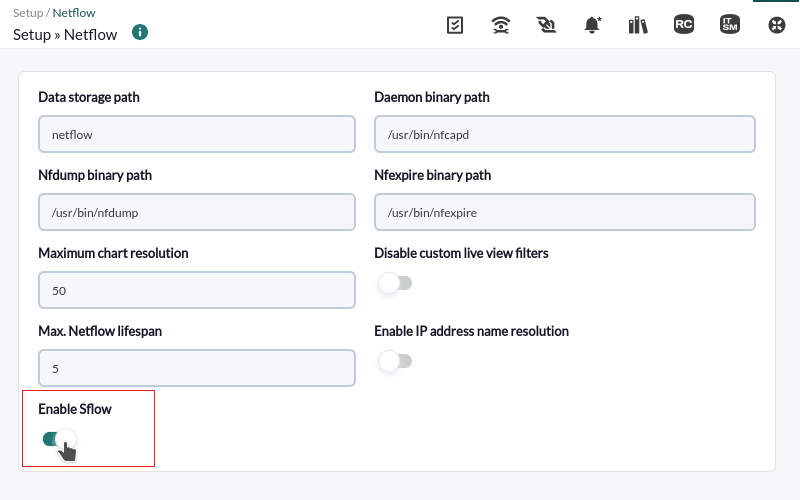
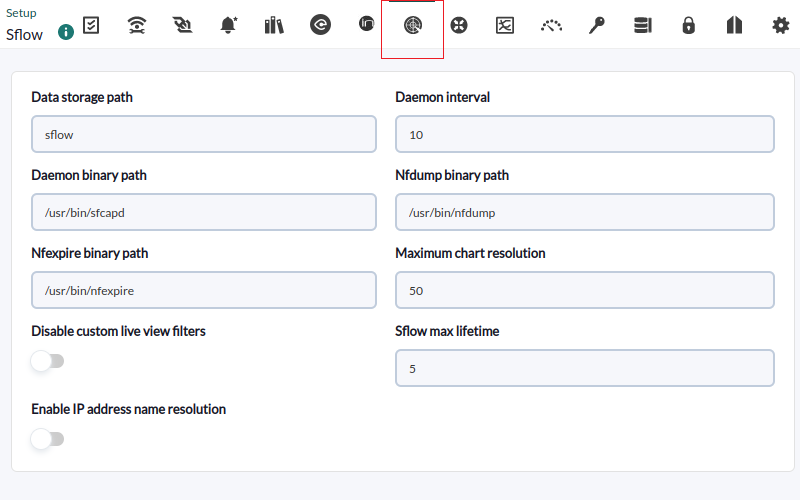
Enable sFlow to be accessible from the Operation and Management menus. Under the NetFlow configuration section, there is an option to enable or disable sFlow globally.
A new tab will be enabled specifically for sFlow:
- Data storage path: Directory where the sFlow data files are to be stored (see General Setup).
- Daemon binary path: Path to the nfcapd binary.
- Nfdump binary path: Path to the nfdump binary.
- Nfexpire binary path: Path to the nfexpire binary.
- Maximum chart resolution: Maximum number of points an sFlow area graph will display. The higher the resolution, the worse the performance. Values between 50 and 100 are recommended.
- Disable custom live view filters: It disables custom filter definition from the sFlow view (filters that are already created can still be used).
- sFlow max lifetime: It indicates the maximum time in days of sFlow data to be stored.
- Enable IP address name resolution: It enables IP address resolution to try to obtain the hostnames of sFlow devices.


 Home
Home


