Moniting Microsoft Azure
Full control and optimization of your Microsoft Azure environments with Pandora FMS
From a single interface, Pandora FMS allows you to efficiently manage critical services in Microsoft Azure, such as virtual machines and networks, in real time, without the need to deploy components in the cloud.
Why is Pandora FMS the best choice for monitoring Microsoft Azure?
Analytics, Real-Time Alerts,
and Proactive Monitoring
Generate combined performance reports and graphs for different Microsoft Azure elements, no matter what region they are in. Receive immediate and precise alerts by email, SMS, Telegram or chat tools, ensuring that you are always aware of any changes in your environment.
Hybrid Environments
In addition to Microsoft Azure, Pandora FMS allows you to add Amazon Web Services, Google Cloud, and of course all your local infrastructure or third-party virtual machines to monitoring.
Efficient management of multiple Azure environments (multi-tenant and multi-client)
With Pandora FMS you may manage several Azure environments from different customers simultaneously. The platform also gives you segmented visibility, allowing you to assign different access levels to groups or customers, for more flexible and efficient management.
Predefined and custom metrics: access to a wide and flexible range
Select from a wide range of predefined metrics for each Microsoft Azure service, such as CPU usage, memory, network traffic, disk operations, and other key metrics that ensure detailed resource monitoring. Customize metrics to your needs to get the information you need in a clear and specific way, allowing you to monitor performance, availability, and costs of all your components deployed in Azure at any time.
Full control from a single platform with multi-cloud support and integration with hybrid environments
Monitor, explore, and alert your Azure VMs from a single and intuitive interface. Centralize all information to make infrastructure management easier, including Azure, Amazon Web Services and all your local or on-premise infrastructure or your own virtualization environments (Xen, VMware, Proxmox, etc.), ensuring complete and unified visibility.
Simple and Quick Setup
Configuring a monitoring task for Microsoft Azure in Pandora FMS is very simple. Follow these steps:
1. Select the Azure service
From the Discovery menu, select “Cloud” and click on the Microsoft Azure component you wish to monitor. In this example, we are working with virtual machines, although the steps are similar for other Azure components.
2. Define the monitoring task
In the form below, define a descriptive name for the task, provide a brief description, select a group for the generated agents, and set the monitoring interval that best fits your needs.
3. Enter the credentials and configure the advanced options
Sign in with the Microsoft Azure credentials you defined in your environment. Here you may also configure the number of threads for the task and adjust advanced options, such as using a proxy or renaming the default agent that will handle the stats.
4. Choose between dynamic or static resource selection
Here you will see a tree with two selection levels. Select a zone to dynamically scan all new items added in the future, or manually select specific items for static monitoring.
5. Select the Metrics
Select the metrics you wish to get from each component. You may customize which metrics you wish to track, from CPU usage to disk read/write operations, based on the needs of your environment.
6. Check out the scheduled Discovery tasks
At the end of the wizard, you will see a list of all scheduled Discovery tasks, along with the current status of each one, including the newly one added for Microsoft Azure.
7. Check the execution summary or force manual execution when you need it
From that list, you may access the detailed summary of the execution or, if you prefer so, manually force the execution of any of the tasks.
Detailed Outputs: Created Agents and Modules
Pandora FMS generates different agents and modules depending on the configuration chosen to provide a detailed view of each aspect of your services in Azure:
01
Agent by Region
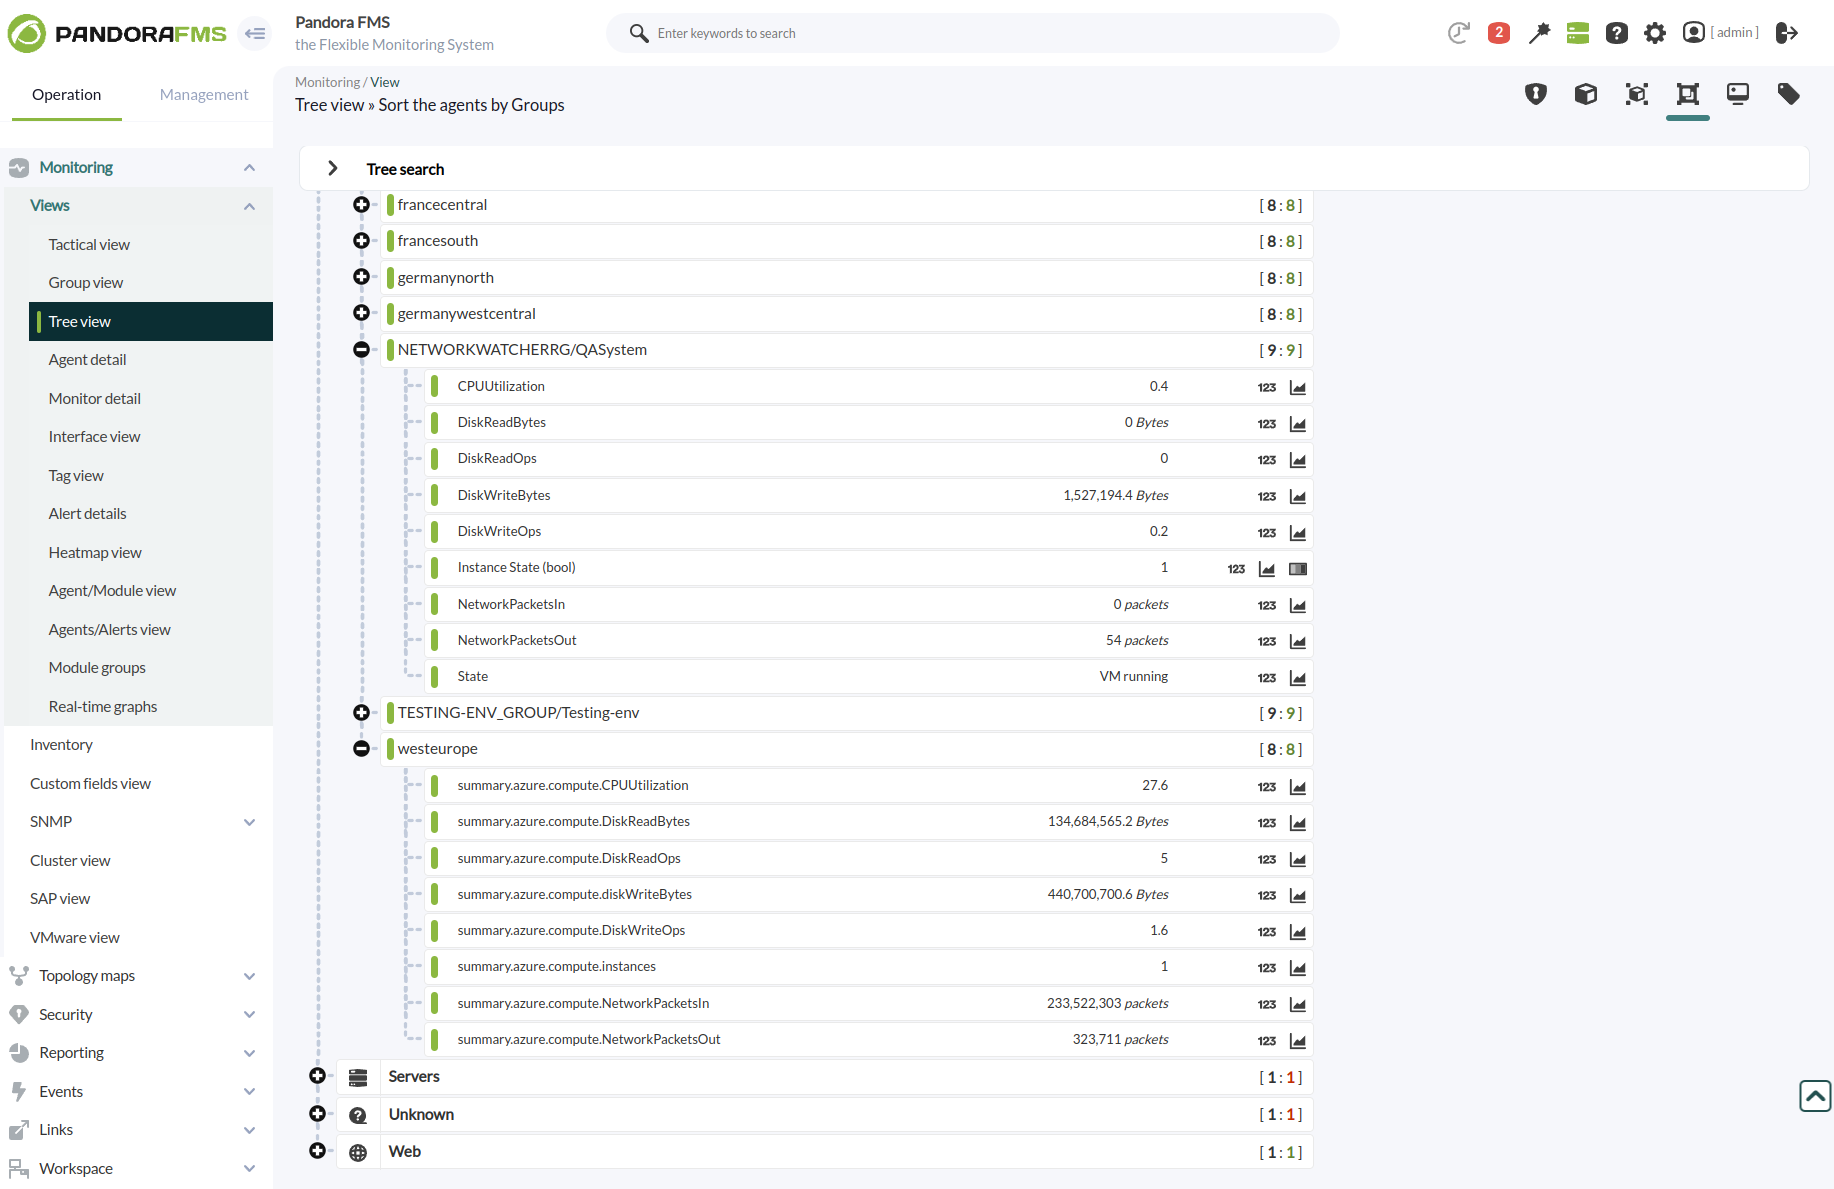
A specific agent is generated for each Azure region monitored, including modules such as ‘CPU Utilization’, ‘Bytes Read/Written to Disk’, ‘Network Packets Incoming/Outgoing’, and ‘Number of Instances Monitored’.
02
Global Agent
Create a global agent that collects general information about the monitored services, with modules such as ‘Azure MC Instances count’, which shows the total number of monitored instances.
03
Agent per Instance
For each monitored instance, an agent is created that includes detailed modules such as ‘Machine Status’, ‘CPU Usage’, ‘Disk Read/Write Operations’, and ‘Network Traffic’.
![]()
That way, Pandora FMS offers you an exhaustive and specific view of all the components of your infrastructure, ensuring efficient and real-time control of your services in Azure.
Detailed Outputs: Created Agents and Modules
Pandora FMS generates different agents and modules depending on the configuration chosen to provide a detailed view of each aspect of your services in Azure:
01
Agent by Region
A specific agent is generated for each Azure region monitored, including modules such as ‘CPU Utilization’, ‘Bytes Read/Written to Disk’, ‘Network Packets Incoming/Outgoing’, and ‘Number of Instances Monitored’.
02
Global Agent
Create a global agent that collects general information about the monitored services, with modules such as ‘Azure MC Instances count’, which shows the total number of monitored instances.
03
Agent per Instance
For each monitored instance, an agent is created that includes detailed modules such as ‘Machine Status’, ‘CPU Usage’, ‘Disk Read/Write Operations’, and ‘Network Traffic’.
That way, Pandora FMS offers you an exhaustive and specific view of all the components of your infrastructure, ensuring efficient and real-time control of your services in Azure.
Azure Metrics
Running the plugin will create the following agents and modules to provide detailed monitoring of every aspect of your services in Azure:
Global Agent
Modules
| Azure MC Instances count |
Total number of instances monitored by the plugin. |
An agent for each monitored area
Modules
|
summary.azure.compute.CPUUtilization |
Average CPU used percentage of instances in this area. |
|
summary.azure.compute.DiskReadBytes |
Summary of the number of bytes read from the disk of each instance of this area. |
|
summary.azure.compute.DiskReadOps |
Total number of read operations performed on the disk of each instance of this area. |
|
summary.azure.compute.diskWriteBytes |
Summary of the number of bytes written from the disk of each instance of this zone. |
|
summary.azure.compute.DiskWriteOps |
Total number of writing operations performed on the disk of each instance of this area. |
|
summary.azure.compute.instances |
Number of instances monitored in this area. |
|
summary.azure.compute.NetworkPacketsIn |
Total number of incoming network packets from each instance in this area. |
|
summary.azure.compute.NetworkPacketsOut |
Total number of outgoing network packets from each instance in this area. |
An agent for each monitored instance
Modules
|
State |
Machine status, in string format. |
|
Instance State (bool) |
Machine status, 1 if running, 0 if not. |
|
CPUUtilization |
Usage percentage of CPU used. |
|
DiskReadBytes |
Number of bytes read from the disk. |
|
DiskReadOps |
Number of read operations performed on the disk. |
|
DiskWriteBytes |
Number of bytes written to disk. |
|
DiskWriteOps |
The number of writing operations performed on the disk. |
|
NetworkPacketsIn |
The number of incoming network packets. |
|
NetworkPacketsOut |
The number of outgoing network packets. |
Global Agent
Modules
| Azure MC Instances count Total number of instances monitored by the plugin. |
An agent for each monitored area
Name: Name of the area (e.g., “East US”).
Modules
| summary.azure.compute.CPUUtilization Average CPU used percentage of instances in this area. |
| summary.azure.compute.DiskReadBytes Summary of the number of bytes read from the disk of each instance of this area. |
| summary.azure.compute.DiskReadOps Total number of read operations performed on the disk of each instance of this area. |
| summary.azure.compute.diskWriteBytes Summary of the number of bytes written from the disk of each instance of this zone. |
| summary.azure.compute.DiskWriteOps Total number of writing operations performed on the disk of each instance of this area. |
| summary.azure.compute.instances Number of instances monitored in this area. |
| summary.azure.compute.NetworkPacketsIn Total number of incoming network packets from each instance in this area. |
| summary.azure.compute.NetworkPacketsOut Total number of outgoing network packets from each instance in this area. |
An agent for each monitored instance
Name: / (e.g., “Production/WebServer01”).
Modules
| State Machine status, in string format. |
| Instance State (bool) Machine status, 1 if running, 0 if not. |
| CPUUtilization Usage percentage of CPU used. |
| DiskReadBytes Number of bytes read from the disk. |
| DiskReadOps Number of read operations performed on the disk. |
| DiskWriteBytes Number of bytes written to disk. |
| DiskWriteOps The number of writing operations performed on the disk. |
| NetworkPacketsIn The number of incoming network packets. |
| NetworkPacketsOut The number of outgoing network packets. |

the all-in-one software
Control every part of your infrastructure with Pandora FMS and improve the efficiency of your operations with a unified platform
Get a comprehensive and detailed view of all your components deployed in Azure, and ensure that every service is monitored efficiently and in real time.
Try it for FREE! →

FAQ
Null
Do I need to install any components in Azure to monitor with Pandora FMS?
No need to install additional components in the cloud. Pandora FMS gets Azure metrics remotely.
Can I monitor multiple Azure environments from different customers?
Yes, Pandora FMS allows you to manage multiple environments and offers segmented visibility for each customer or group.
Is it possible to integrate Azure monitoring with other cloud services?
Absolutely. Pandora FMS supports monitoring of AWS, Google Cloud, and other services, as well as on-premise environments.
How do I receive alerts in case of any issues?
You may set up alerts through email, SMS, Telegram or integrate them with your favorite chat tools.
Does Pandora FMS support hybrid and virtualization environments?
Yes, it supports hybrid environments and virtualization technologies such as Xen, VMware, and Proxmox.
pandora fms resources
Want to learn more? Explore more resources
Expand your monitoring with Pandora FMS
With Pandora FMS, you not only monitor your resources in Azure, but you integrate your whole infrastructure into a single platform. Improve efficiency, reduce costs and make decisions based on real data.


