
 Home
Home
Pandora FMS Engineering
Pandora FMS Database Design
The first versions of Pandora FMS, from 0.83 to 1.1, were based on a very simple idea: one piece of data, one database insertion. This allowed the software to perform easy searches, insertions and other operations quickly.
Apart from all the advantages this development offered, there was one drawback: Scalability (rapid growth with little or no impact on work operations and routines). This system had a defined limit on the maximum number of modules it could support, and with a certain amount of data (more than 5 million elements), performance was affected.
MySQL cluster solutions, on the other hand, are difficult: Although they allow managing a higher load, they add some extra problems and difficulties, and they do not offer a long-term solution to the performance problem with a large amount of data either.
Currently Pandora FMS implements data compaction in real-time for each insertion, in addition to performing data compression based on interpolation. On the other hand, the maintenance task allows automatically deleting data that exceeds a certain age.
The Pandora FMS processing system stores only “new” data: If a duplicate value enters the system, it will not be stored in the database. This is very useful for keeping the database small and works for all Pandora FMS module types (numeric, incremental, boolean and text string).
These modifications involve major changes when reading and interpreting data. In the latest versions of Pandora FMS, the graphics engine has been redesigned from scratch to be able to represent data quickly with the new data storage model.
Compaction mechanisms also have certain implications when reading and interpreting data graphically: Currently there is a graphic configuration menu that allows adding percentiles, real-time data, when events and/or alerts occurred, as well as other options.
Additionally, Pandora FMS allows the total breakdown of components, so the processing load of data files and execution of network modules can be balanced across different servers.
Other DB technical aspects
Throughout the software updates, improvements in the relational model of the Pandora FMS database have been implemented. One of the changes introduced has been information indexing based on different types of modules. This way, Pandora FMS can access information much faster, since it is distributed in different tables.
It is possible to perform table partitioning (by timestamps) to further improve the performance of accessing historical data.
In addition, factors such as the numerical representation of timestamps (_timestamp_ UNIX format), speed up date range searches, date comparisons, etc. This work has allowed a considerable improvement in search times and insertions.
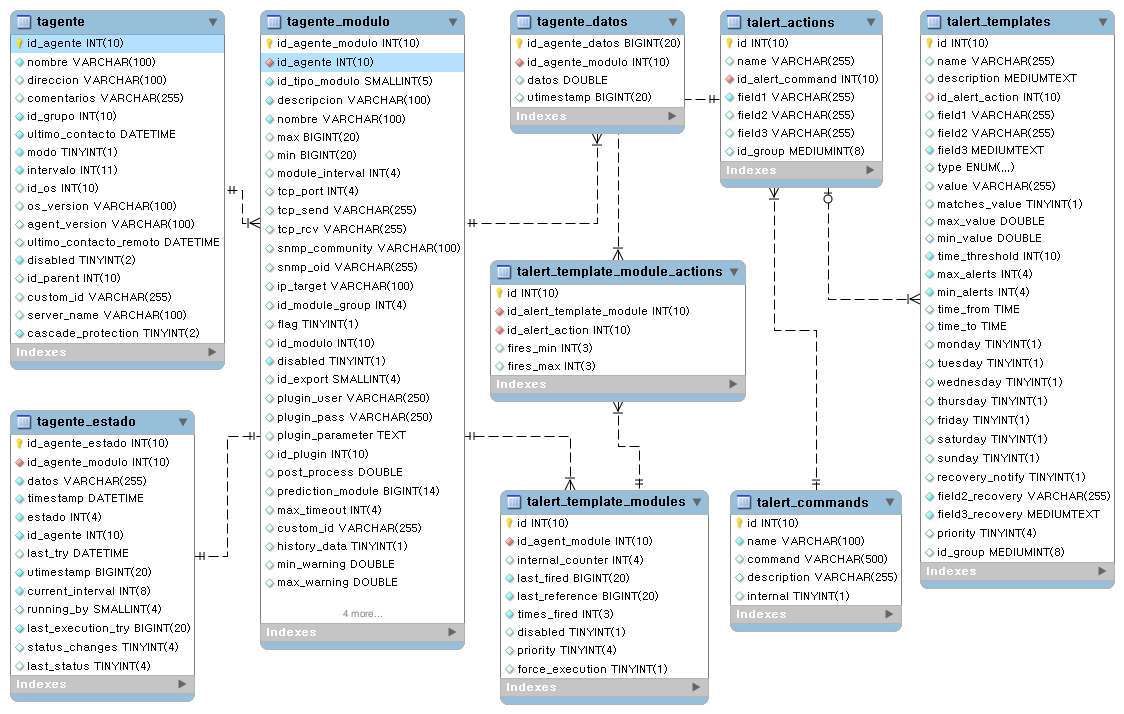
Main database tables
Real-time data compression
To avoid overloading the database, the PFMS Server performs simple compression at insertion time. Data is not saved in the database unless it is different from the previous one or there is a difference of more than 24 hours between them.
For example, assuming an approximate interval of 1 hour, the sequence 0,1,0,0,0,0,0,0,1,1,0,0 is stored in the database as 0,1,0,1,0. Another consecutive 0 will not be saved unless twenty-four hours have passed.
Compression greatly affects data processing algorithms, both metrics and graphs, and it is important to keep in mind that the “gaps” caused by compression must be filled.
Taking into account all of the above, to perform calculations with the data of a given module for an interval and an initial date, these steps must be followed:
- Search for the previous data, outside the given interval and date. If it exists, it must be brought to the beginning of the interval. If it did not exist previously, there would be no data.
- Search for the next data, outside the given interval and date up to a maximum equal to the module interval. If it exists, it must be brought to the end of the interval. If it did not exist, the last available value would have to be extended until the end of the interval.
- All data is gone through, keeping in mind that a piece of data is valid until a different piece of data is received.
Data compaction
Pandora FMS has included a system to compact the database information. This system is oriented to small and medium-sized scenarios (from 250 to 500 agents and with less than 100,000 modules) that wish to have an extensive historical record of information but losing details.
The Pandora FMS database maintenance that is executed every hour and among other cleaning tasks allows performing compaction of old data. This compaction uses a simple and linear interpolation; since it is an interpolation, it causes detail to be lost in this information, but it will still be sufficiently informative for the generation of monthly, yearly reports and graphs, etc.
In large databases, this behavior can be quite expensive in terms of performance and would have to be deactivated; instead, it is recommended to opt for the historical database model.
Historical database
The historical database is a feature used to store all past information that is not used in recent days' views, such as data older than one month. This data is migrated, automatically, to a different database, which must be on a different server with different storage from the main database.
When a graph or a report with old data is shown, Pandora FMS will look for the first days in the main database, and when it reaches the point where they are migrated to the historical database, it will look in it. Thanks to this, performance is maximized even when accumulating a large amount of information in the system.
Advanced configuration
The default Pandora FMS configuration does not transfer text string type data (string) to the historical database, however if this configuration has been modified and the historical database is receiving this type of information, it is essential that its purging is configured, otherwise it will end up occupying too much space, causing major problems and having a negative impact on performance.
To configure this parameter, a query must be executed directly in the database to determine the days after which this information will be purged. The table in question is tconfig and the field string_purge. To set 30 days for the purging of this type of information, the following query would be executed directly on the historical database:
UPDATE tconfig SET VALUE = 30 WHERE token = "string_purge";
The database is maintained by a script called pandora_db.pl. To check that database maintenance is being performed correctly, the maintenance script can be executed manually:
/usr/share/pandora_server/util/pandora_db.pl /etc/pandora/pandora_server.conf
It should not report any errors.
If another instance is using the database, the -f option can be used to force execution; with the -p parameter, it does not perform data compaction. This is especially useful in High Availability (HA) environments with a historical database, since the script ensures that the necessary steps for these components are performed in the correct order and mode.
Module statuses in Pandora FMS
When is each status established?
- On the one hand, each module has Warning (
WARNING) and Critical (CRITICAL) thresholds in its configuration:
- These thresholds define the values of its data for which these statuses will be activated.
- If the module provides data outside these thresholds, it is considered to be in Normal (
NORMAL) status.
- Each module also has a time interval that will establish the frequency with which it will obtain data:
- That interval will be taken into account by the console to collect data.
- If the module goes twice its interval without collecting data, it is considered that the module is in Unknown (
UNKNOWN) status.
- Finally, if the module has alerts configured and any of them has been triggered and has not been validated, the module will have the corresponding Fired alert status.
Propagation and priority
Within the Pandora FMS organization, certain elements depend on others, such as an agent's modules or a group's agents. This can also be applied to the case of Pandora FMS monitoring policies, which have certain agents and certain modules associated with each agent.
This structure is especially useful for evaluating module statuses at a glance. This is achieved by propagating statuses upwards in this organization, thus granting status to agents, groups and policies.
Which status will an agent have?
An agent will be shown with the most critical status among its modules' statuses. In turn, a group will have the most critical status among the statuses of the agents that belong to it, and the same for monitoring policies which will have the most critical status of their assigned agents.
In this way, by seeing a group with critical status, it will be known that at least one of its agents has that same status. To locate it, one must go down another level, to the agents, to narrow the search and find the module or modules causing that critical status to propagate.
What is the status priority?
Since the most critical status of the statuses is propagated, it must be clear which statuses have priority over the others:
- Fired alerts.
- Critical status.
- Warning status.
- Unknown status.
- Normal status.
When a module has fired alerts, its status takes priority over all others and the agent to which it belongs will have that status and the group to which that agent belongs, in turn, as well.
On the other hand, for a group, for example, to have a normal status, all its agents must have that status; which means that in turn all the modules of those groups will have a normal status.
Color code
 Fired Alerts status.
 Critical status.
 Warning status.
 Unknown status.
 Normal status.
Pandora FMS graphs
Graphs are one of the most complex implementations of Pandora FMS, they extract data in real-time from the database and no external system is used (RRDtool or similar).
There are several graph behaviors depending on the type of source data:
- Asynchronous modules. It is assumed that there is no data compaction. The data in the database are all real samples of the data, there is no compaction. It produces much more “exact” graphs and without the possibility of misinterpretation.
- Text string type modules. They show graphs with the data rate over time.
- Numeric data modules. Most modules report this type of data.
- Boolean data modules. They correspond to numeric data in monitors,
PROCsuch as Ping checks, interface status, etc. The value0corresponds to the Critical status, and the value1to the Normal status.

