Raspberry Pi monitoring
- Network connection and device configuration guide.
- Pandora FMS agent and satellite installation on a Raspberry device.
- Automatic creation Pandora FMS user, securing the ssh protocol.
Hardware Components
Raspberry
A Raspberry device is a reduced-plate computer, single-plate computer or low-cost single-plate computer (SBC). Its official operating system is an open source version adapted from Debian, called Raspbian.
Software
Pandora FMS image for Raspberry
The distributed image is based on the Raspbian operating system. It contains the agent, the satellite, the eHorus client, the packages to install a NetFlow probe and all their dependencies.
Installation
Flash image onto an SD card
Download Pandora FMS official image for Raspberry
The initial step for installing it is to download the official Pandora FMS image for raspberry from the official download page:
Once the .img file is downloaded, flash it onto your SD card of at least 4gb.
Download Etcher
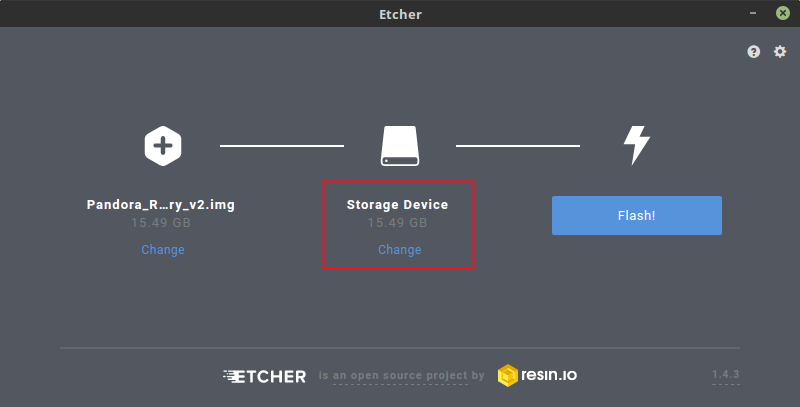
To flash the image, use the Etcher software that can be downloaded at
It works similarly on both Windows® and Linux®.
Process for flashing the image on the SD card
Insert the SD card into your computer which should have a special port for those kinds of devices. Execute Etcher.
Click Select image. This will open the file explorer to select the previously downloaded Pandora FMS image.
Select the SD card inserted in the computer. If the SD card is the one that appears by default, leave it as it is and if not, click Change and select the desired SD card.
Click Flash! to mount the image on the card.
Then, remove the card securely according to your OS instructions.
Hardware connection
Thorough this step, all the components will be connected to power up the Raspberry:
- Insert the SD card into the slot at the bottom of the box.
- Connect the keyboard to any USB port
- Connect the HDMI wire to the Raspberry monitor and HDMI port.
- Connect the device to the power supply.
Network configuration
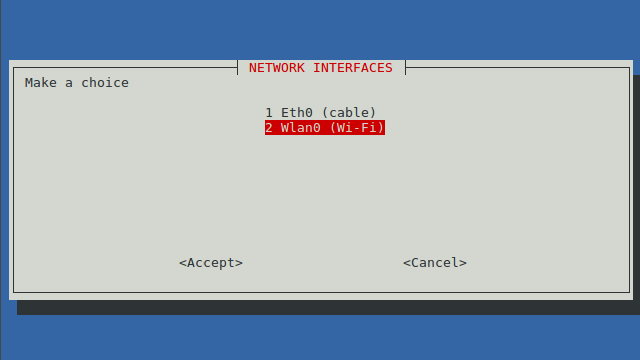
The monitor will display how the device starts and an installer where you can select which interface you wish to configure.
DHCP
Select Eth0 to configure the wired network interface:
It will ask whether you want to change the Eth0 interface settings. Click Yes
Select DHCP if there is a DHCP server in the network
Then, a message will appear saying that the wired network has been correctly configured.
Static
Select IP STATIC if you wish to configure the wired interface manually.
Enter the Raspberry's static IP.
Enter the network's Gateway.
Enter the network mask.
Enter the public DNS.
You will get a message that the configuration has been successfully completed.
Wireless DHCP
Select Wlan0 to configure the wireless network interface
It will ask whether you wish to change the Wlan0 interface configuration. Click Yes.
Select DHCP if there is a DHCP server in the network.
Choose the name of the access point from the provided list. Enter the password of the access point.
You will get a message that the configuration was successful.
Wireless Static
- Select WIFI STATIC if you wish to configure the wired interface manually.
- Choose the name of the access point from the provided list. Enter the password of the access point.
- Enter the device static IP address.
- Enter the network mask.
- Enter the access point Gateway.
- You will receive a message saying the configuration was successful.
Agent/Satellite Configuration
Agent
- To install the agent, select AGENT from the menu.
- It will ask for the IP address of the Pandora FMS server the agent must point to.
- Enter the existing group in the Pandora FMS server you wish to add the agent to.
Satellite
- To install the satellite, select SATELLITE from the menu.
- Enter the IP address of Pandora FMS server the agent must point to.
- Enter the network range you wish to monitor along with its mask.
- Enter the community or list of SNMP communities of the devices in your network.
- Enter the user or list of users to make WMI queries to the computers on your network.
Postinstallation
eHorus client Configuration
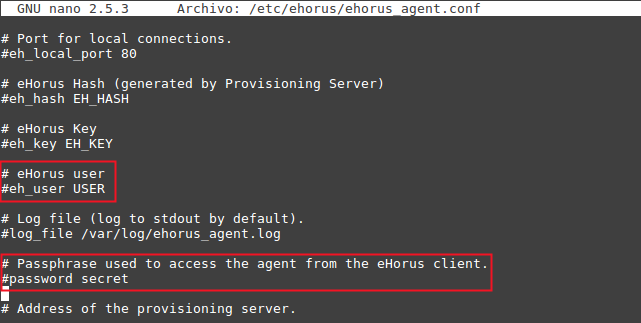
Edit the file with the nano text editor:
/etc/ehorus/ehorus.conf
Replace the eh_user token with your eHorus user. In line #password secret delete the number that indicates the biginning of the comment (uncomment the line) and replace the word “secret” by a password to access your agent from eHorus.
To see the graphical environment, install the x11vnc dependency:
apt-get install x11vnc
Start the service with:
/etc/init.d/ehorus_agent_daemon start
NetFlow Probe
Its operation is based on the use of several components:
- A device with NetFlow compatibility, usually a switch or router type network hardware that generates information packets, or a NetFlow probe.
- A NetFlow collector, which receives the packets generated by the previous device, storing and processing them. It is usually a tool or server with these features.
Pandora FMS uses an OpenSource tool called nfcapd to process all NetFlow traffic. This daemon is automatically launched by Pandora FMS server. This system stores data in binary files, in a certain location. Install nfcapd on your system before working with NetFlow in Pandora FMS. The default nfcapd daemon listens on port 9995/UDP by default, so keep this in mind if you have firewalls to open this port and when configuring NetFlow probes.
NetFlow Probe by software
If you do not have a NetFlow router, but your traffic “goes” through a Linux system, you can install a software that works as a probe and sends NetFlow traffic information to the collector. In Linux, there is a program called fprobe that captures traffic and forwards it to a NetFlow server. With that you can generate NetFlow traffic, from all network traffic going through your interfaces.
First, install fprobe:
apt-get install fprobe
It will ask which interface must be monitored and to which ip:port the information must be sent to. In case it does not ask, run the following command:
/usr/sbin/fprobe -i <interface_moniteur> -fip <ip_collector>><port>
In the following example, all traffic from the eth0 interface will be sent to the NetFlow collector listening on port 9995 of IP 192.168.70.185:
/usr/sbin/fprobe -i eth0 -fip 192.168.70.185:9995
Once traffic is generated, you can see the statistics of this traffic on the NetFlow collector with this command:
nfdump -R /var/spool/pandora/data_in/netflow
NetFlow must be enabled to be accessible from the Operation and Administration menus: Enable NetFlow
Once NetFlow is configured, restart Pandora FMS server to boot the nfcapd server. It must be properly installed before attempting to start it. Check the server logs for any questions.
Netflow Probe with Port Mirroring
Explained in section: Netflow Port Mirroring


 Home
Home


