User Experience monitoring (UX and WUX)
Introduction
User experience monitoring consists of making recordings of automated tasks of both web browsing (PWR/WUX) and interaction with the desktop and Windows system applications (PDR). These recordings can range from a mouse click on a web browser, typing text or performing a web search, to opening an application on the desktop. This allows functions to be configured and automatically recorded for later execution in search of results.
Differences between UX and WUX monitoring
Both monitoring systems are used to execute automated web browsing tasks using Pandora Web Robot Daemon (PWRD) system.
The UX system performs these monitoring tasks using the software agent installed on a machine, while WUX monitoring is based on a server integrated within Pandora FMS.
Pandora Web Robot Daemon (PWRD) is a service that provides the necessary tools to automate web browsing sessions. To do it, it uses a file that contains a list of the actions necessary to navigate the user's web portal.
Additionally, UX monitoring enables the execution of the automated tasks that interact with MS Windows® desktop and system applications. These types of tasks cannot be performed with WUX.
Pandora FMS UX is a system that executes automated tasks, giving Pandora FMS a report with the execution results, time spent and screenshots with the errors that may be found.
If you have a task automation system, Pandora FMS UX also allows you to execute the scripts you already have and monitor their execution.
It is important to specify the use of this type of monitoring. Both methods are based on monitoring execution by means of a plugin in the software agents installed in the corresponding machines.
For the execution of web transactions Pandora FMS uses Selenium Engine:
- Selenium version 2.
- Selenium version 3.
PWR UX monitoring
Taking into account the differences between UX and WUX monitoring, UX monitoring must follow a series of prerequisites related to the environment to be monitored, with the following previous steps:
- Install Java®.
- Configure a profile in Mozilla Firefox®.
- Install a Selenium® service.
- Distribute PWR on the system.
- Install the Selenium® IDE for Mozilla Firefox®.
- Save a PWR session.
For the standard execution of pre-recorded sessions use the Pandora UX Plugin in its latest version 28-04-2022.
Web User Experience (WUX) with Selenium 3
For Selenium deployment on WUX servers, a container-based stack will be used for fast deployment and easy scaling.
Previous settings
Docker and Docker Compose must be previously installed and we recommend using CentOS as the base operating system.
For this installation, we recommend following the Docker documentation at:
The official Selenium images will be used for the installation and deployment of the stack. You may find them at:
Different images with browsers are available in the Selenium repository. For Pandora FMS, we recommend Firefox® and Chrome® containers.
Selenium Stack Deployment
To deploy the Selenium stack, it will be necessary to first create a YAML file with the necessary configuration:
# To execute this docker-compose yml file use `docker-compose -f  up`
# Add the `-d` flag at the end for detached execution
version: "3"
services:
  selenium-hub:
    image: pandorafms/pandorafms-selenium-hub
    mem_limit: 2G
    container_name: selenium-hub-v3
    logging:
        driver: "json-file"
        options:
            max-file: "5"
            max-size: "4m"
            mode: "non-blocking"
    environment:
      - TZ=Europe/Amsterdam
    ports:
      - "4444:4444"

  chrome:
    image: pandorafms/pandorafms-selenium-node-chrome
    mem_limit: 2G
    volumes:
      - /dev/shm:/dev/shm
    depends_on:
      - selenium-hub
    logging:
        driver: "json-file"
        options:
            max-file: "5"
            max-size: "4m"
            mode: "non-blocking"
    environment:
      - TZ=Europe/Amsterdam
      - HUB_HOST=selenium-hub
      - HUB_PORT=4444

  firefox:
    image: pandorafms/pandorafms-selenium-node-firefox
    mem_limit: 2G
    volumes:
      - /dev/shm:/dev/shm
    depends_on:
      - selenium-hub
    logging:
        driver: "json-file"
        options:
            max-file: "5"
            max-size: "4m"
            mode: "non-blocking"
    environment:
      - TZ=Europe/Amsterdam
      - HUB_HOST=selenium-hub
      - HUB_PORT=4444
In the previous example, make the necessary modifications for each case, such as memory limit, time zone, number of nodes, etc.
It can be saved as docker-compose.yml to make identifying it easier.
To activate the container with the defined settings, just run the following command (replace <compose-file> with the name you chose for the file):
docker-compose -f <compose-file> up -d
To check the services running in the container, use the following command:
docker-compose -f <compose-file> ps
To see the status and logs of Selenium services, use the following command:
docker-compose -f <compose-file> logs
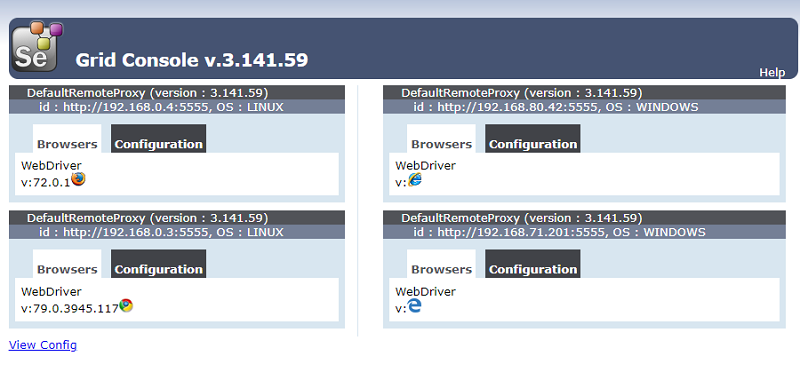
Once the appropriate checks have been made, to verify the grid works properly and the workers have signed up as you defined in the configuration file, go to the following URL:
http://<ip_selenium_server>:4444/grid/console
If you need to increase the number of workers, just run the following command:
docker-compose -f <compose-file> scale chrome=X firefox=Y
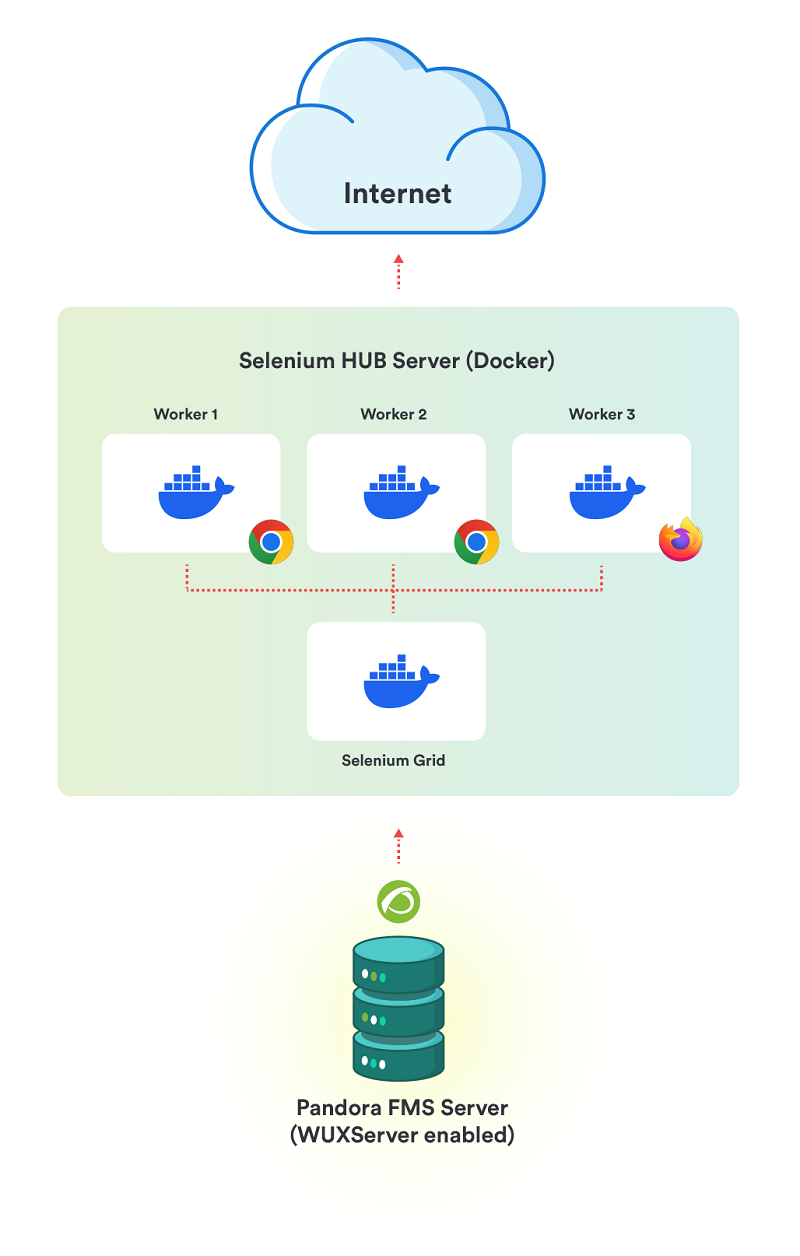
Selenium service infrastructure
Selenium works as a hub where a container, that works as a grid where to deploy the necessary worker containers, is enabled.
Pandora FMS Configuration
To use the centralized mode (WUX) it will be necessary to apply the following configuration to the Pandora FMS server.
Regardless of the chosen mode, once started you may start assigning executions from your browsing sessions, adding the WUX Server configuration parameters to the configuration file of your Pandora FMS server.
Add the following configuration ath the end of the file /etc/pandora/pandora_server.conf (replace <ip_wux_host> by the server's IP address, if it is the same server where Pandora FMS use server runs 127.0.0.1):
 wuxserver 1
 wux_host <ip_wux_host>
 wux_port 4444
The configuration file of Pandora FMS server has a new token to clean queued navigation sessions.
clean_wux_sessions 1 #(default)
Pandora FMS Threads Management
- The
wuxserverthreads management is done automatically when starting thepandora_serverservice. - It is done taking into account the number of nodes of a MINOR browser that is in the Selenium hub. For example:
- If in the hub there are configured 2 Firefox and 2 Chrome nodes, the number of
wuxserverthreads will be 2. - If 1 Firefox node and 4 Chrome nodes are configured in the hub, the number of threads will be 1.
- If 6 Firefox nodes are configured in the hub, the number of threads will be 6.
Note that each thread indicates the sessions that can be sent simultaneously from the wuxserver to the Selenium hub.
Appendix: Add workers for Internet Explorer and Microsoft Edge
If it is necessary to launch web transactions against Microsoft® browsers, it will be necessary to configure a machine (physical or virtual) with the desired Windows® version and configure the driver following the official documentation.
Internet Explorer® driver installation documentation:
github.com/SeleniumHQ/selenium/wiki/InternetExplorerDriver
We recommend using driver 3.141 version 32bit to avoid performance 64bit version problems.
Microsoft Edge® driver installation documentation:
https://developer.microsoft.com/en-us/microsoft-edge/tools/webdriver/
To run Selenium, Java® must be installed on the Windows® device.
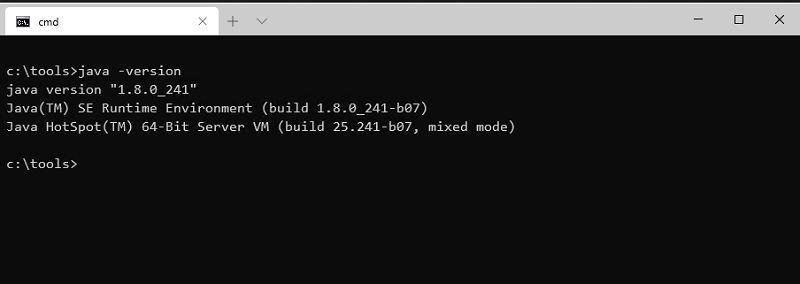
To check whether Java® is installed, run this command:
java -version
You should get an output like the following:
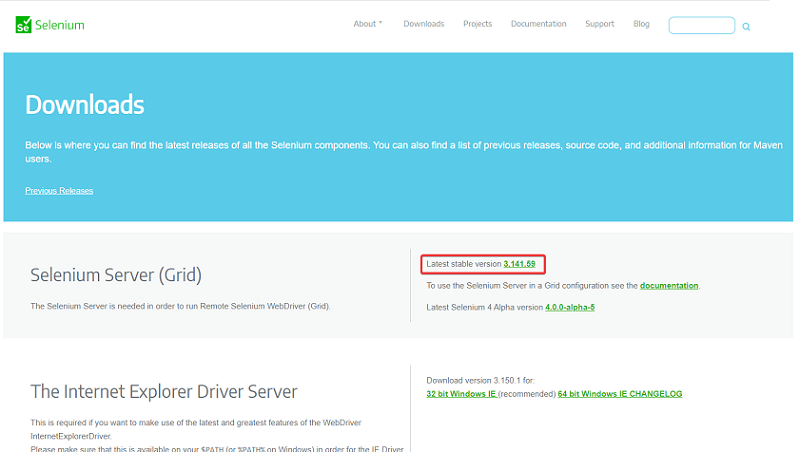
The Selenium JAR file will also be required to run the server locally and register it on your grid.
It can be obtained at:
https://www.selenium.dev/downloads/
To activate the Microsoft Edge® server, the following must be run in a terminal in the directory where you have the JAR file:
java -jar selenium-server-standalone-<VER>.jar -port 5555 -role node -hub
http://<ip_selenium_server>:4444/grid/register -browser "browserName=MicrosoftEdge, platform=WINDOWS, maxInstances=1"
The command is similar to activate the Internet Explorer® server, but the path of the downloaded driver must be specified:
java -Dwebdriver.ie.driver=<PATH>IEDriverServer.exe -jar selenium-server-standalone<VER>.jar -port 5555 -role node -hub
http://ip_selenium_server:4444/grid/register -browser "browserName=internet explorer, platform=WINDOWS, maxInstances=1"
The Windows Firewall must be configured to allow traffic on the ports specified in the run command. In the case of examples 5555 and 4444.
Recording
It should be taken into account that the recordings made in Selenium 2 may not work properly.
For Selenium version 3, both old and new recordings will be supported.
In order to record a new session, the Selenium IDE extension must be installed in the desired browser.
Firefox
https://addons.mozilla.org/es/firefox/addon/selenium-ide/
Chrome
https://chrome.google.com/webstore/detail/selenium-ide/mooikfkahbdckldjjndioackbalphokd
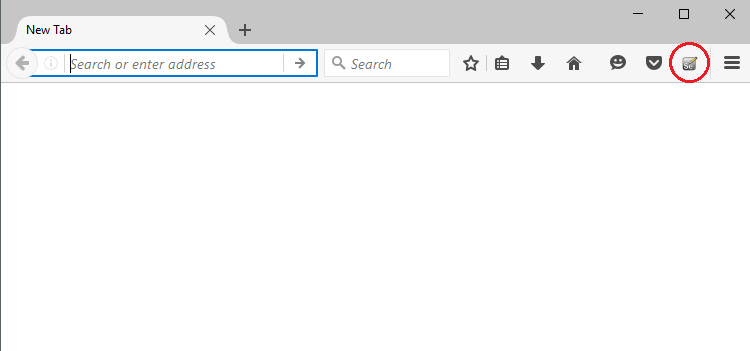
The next icon will be the one that allows to start the recording environment once the extension is installed.
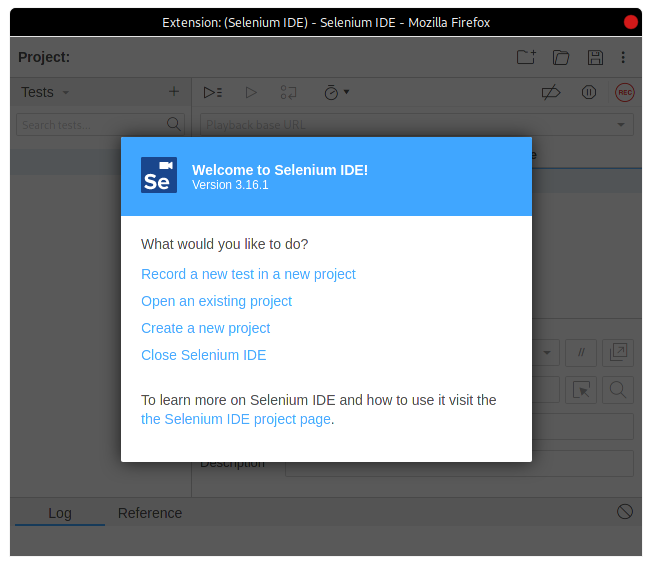
A menu that will allow to start new recording projects will open.
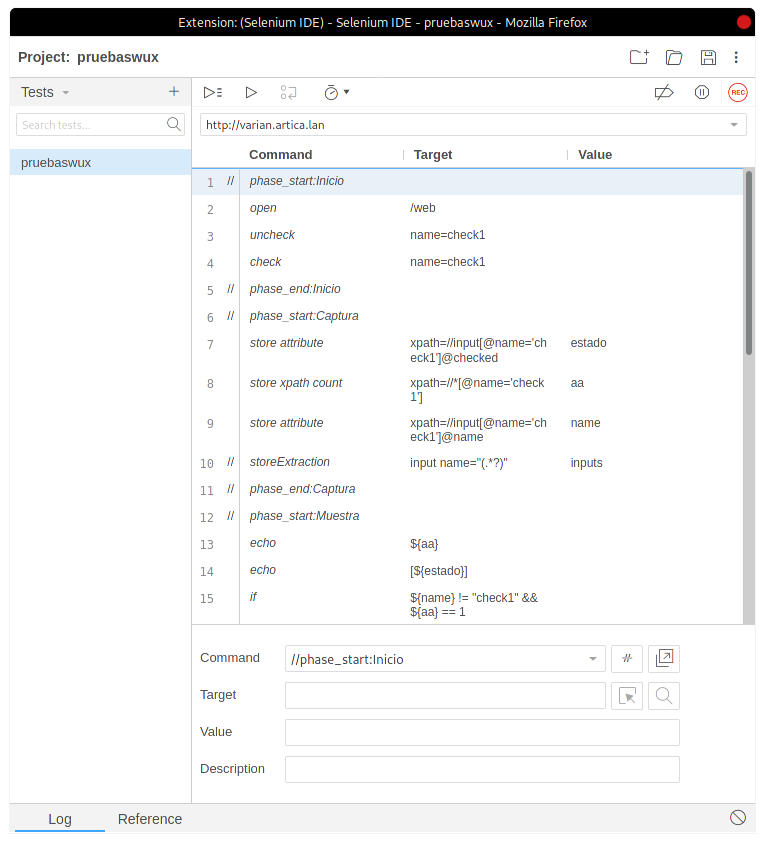
Once the recording is made, it will result in something like the following:
Apart from the feature provided by Selenium, Pandora FMS has custom commands to retrieve information from the target to be monitored.
Commands
The list of compatible commands available can be found here.
Recommendations and suggestions when making the recordings
Next, we detail a series of recommendations and advices to make the recording of the transactions with Selenium IDE as well as to integrate the most complex commands with Pandora FMS:
- Divide the transaction in phases whenever it is possible. In this way, the modules created of state, times and screenshots will be segmented and they will be easier to locate when the transaction has failed.
- Use the selenium command
set speedandwait forto avoid false negatives. When executing a transaction, the selenium commands don't have any default delay from the end of one until the next one is executed, and some of them don't have timeout either. This makes the transaction run in the shortest time possible, but by doing it so quickly, if the web is somewhat slow or takes an extra second to load it is possible that the check will end in failure. For instance, after executing aclickcommand and go to other page, if we then have a command that interacts with an element on the new page and the loading of this is delayed by one second, it will not find the element on the new page and the check will end in failure. To avoid these situations, there is the commandset speed, which adds a delay of the amount of milliseconds that we indicate in the Target field between each command. We recommend to set it at the beginning of the transaction. There are also for cases where we know that the loading of a page or the appearance of an element can take a few seconds, the commandswait for element present,wait for visibleandwait for textin which we can set the time in milliseconds that will wait for the element to appear on the page before marking the transaction as a failure. It is important to emphasize that the use of these commands, although they increase very much the reliability of the check, they will also increase the time that it takes to execute the transaction. - Checking the existing elements. For this we will use commands like
assertandverify, in their different aspects. Finishing a transaction with a click, for example, does not guarantee that the new page that should open the element you clicked on will open, only guarantee that it is possible to click on the element. If after the click we introduce averify textto a text that we know will only be loaded after the click, it would be a way to check that the page that the click sends us is available. - Use
store window handlein transactions where you are going to navigate between windows or tabs. The change of window (with aselect window) can give failure if you have not previously stored an identifier to the initial window. - Use xpath when the Target by CSS identifier fails or when we want to search content in the page. By default, the Selenium IDE recorder load in the Target of the element the CSS locator, but it also loads the locator by xpath, it is possible to see all the locators that it saves if we click on the Target box in the recorder:
 In addition, when using
 xpath, it is possible to search texts inside the tags of the pages to make more dynamic recordings. In the previous capture we see that it is possible to use an xpath that looks for the text “Monitoring Innovators” in all the span tags of the page, not in a specific locator. - Correct use of the
execute scriptcommand. This command executes a snippet of JavaScript in the context of the currently selected frame or window. We recommend to read this guide to learn about its use and the different options that it offers: https://ui.vision/rpa/docs/selenium-ide/executescript However, the use of the variables previously stored (by astore textcommand for example) should go between double quotes so that the Pandora FMS webdriver interprets them correctly. Here is an example of a variable stored withstore textand its later use inexecute scriptso that the Pandora FMS server interprets it correctly. Note that this use of the variable between quotes will fail to execute the script in the Selenium IDE recorder:
Web User Experience (WUX) with Selenium 2
Selenium 2 is now obsolete, the current version is Selenium 3.
Previous settings
Selenium
Pandora Web Robot Daemon (PWRD) deployment
Pandora FMS Web Robot Daemon is a service that provides the necessary tools to automate web browsing sessions, using a file that contains a list of the actions necessary to navigate the user's web portal.
It comes integrated with the Pandora FMS server and can be found in the /usr/share/pandora_server/util/pwrd folder when installing the PFMS server (GNU/Linux®) or in the module library (Windows®).
To download it, go to the following link: https://pandorafms.com/library/pandora-ux-and-wux-pwr-recorder/
It contains:
- Firefox® browser binary version 47.
- Pre-built profile for executing web browsing sessions.
- Session automation server (Selenium server).
Selenium server deployment on Windows systems
Prerequisites:
- Install Java® 1.8 on the machine that will provide the service.
- Install Firefox® 47.0.1 (downloadable at https://ftp.mozilla.org/pub/firefox/releases/47.0.1/).
- Make a Firefox® profile to be used to test automated sessions (optional): http://toolsqa.com/selenium-webdriver/custom-firefox-profile/
- Create the following directories:
C:\PWR.
To download the PWR_Server.zip, go to the following link: https://pandorafms.com/library/pwr-server-for-ux-monitoring/
Do the following file distribution:
- Unzip the PWR_Server.zip file to
C:\PWR\ - Export Firefox® profile to
C:\PWR\profile
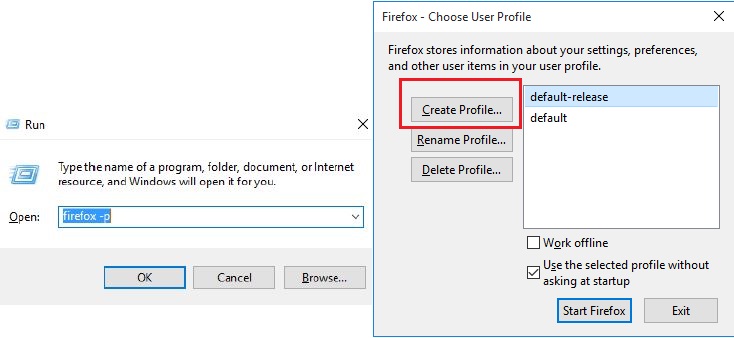
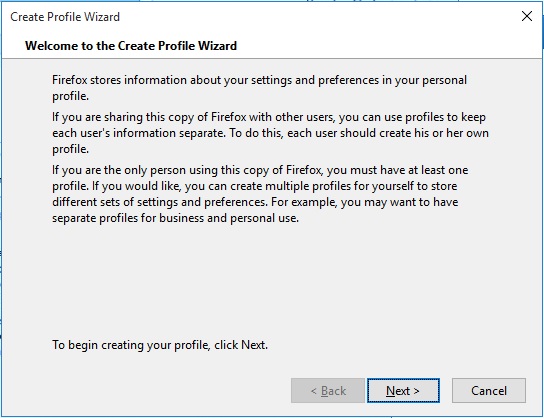
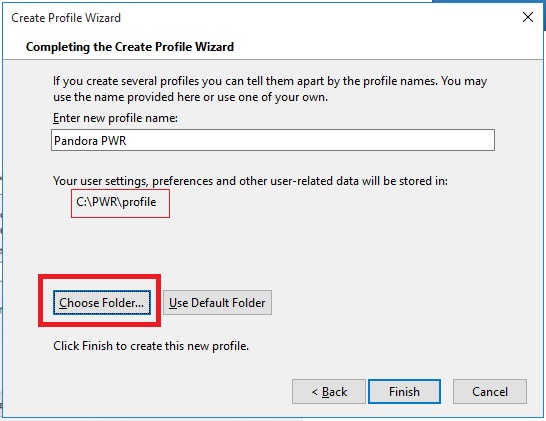
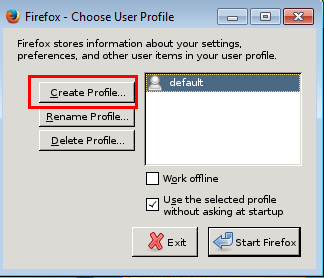
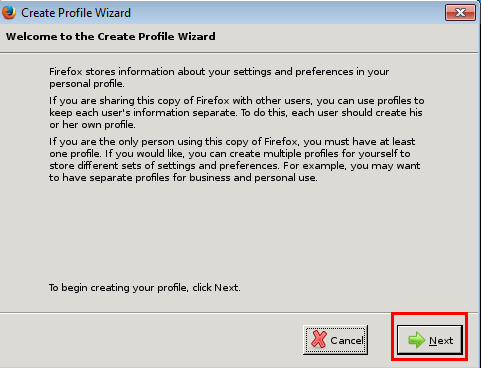
The use of a profile to carry out checks is not mandatory, however it is recommended particularly when using a proxy or wanting to use password autocompletion. To create a Firefox profile, follow the steps from the following screenshots:
Choose the destination directory:
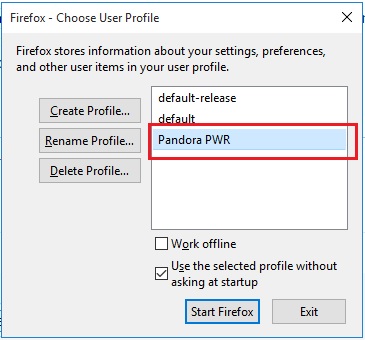
Start Firefox® with the new profile to customize options such as proxy, popup display, etc.:
Next, install the service by executing the provided BAT file service_installer.bat. For the service_installer.bat to work properly, modify the content, typing in the paths that exist in the file as they are installed on your machine. For example, Java® can only work if you have correctly configured its PATH. Otherwise, you will have to provide the full PATH inside the file. Finally, start the service:
net start PWRSRV
From this point, the Selenium server is running on your machine. However, you may execute it manually (stopping the service previously) in case you wish to perform debugging tasks, using the following command:
java -jar C:\PWR\server\selenium-server-standalone-2.53.0.jar -firefoxProfileTemplate C:\PWR\profile -port 4444 -v
Selenium server deployment on Linux systems
Prerequisites:
- Install Java 1.8 on the machine that will provide the service.
- Install Firefox 47.0.1 (downloadable at https://ftp.mozilla.org/pub/firefox/releases/47.0.1/).
- Prepare a Firefox profile to be used to test automated sessions (optional): http://toolsqa.com/selenium-webdriver/custom-firefox-profile/
- Install xorg-x11-server-xvfb
- Install java
The Selenium component of the PWRD daemon requires Java to work, so it needs to be installed:
yum install java
For PWRD to be able to launch Firefox on your Linux server, it will be necessary to install xorg-x11-server-Xvfb, gtk2 and gtk3 in order to virtualize a graphical environment:
yum install xorg-x11-server-Xvfb gtk2 gtk3
If it is not available in your repositories, you may find the rpm files in the following links:
To manually install the rpm packages:
 yum install xorg-x11-server-Xvfb-1.15.0-22.el6.centos.x86_64.rpm
 yum install gtk2-2.24.31-1.el7.x86_64.rpm
Once the prerequisites are installed, continue with the installation of install_pwrd.sh. This installer is found by default in the folder /usr/share/pandora_server/util/pwrd/install_pwrd.sh and it is executed as follows:
 cd /usr/share/pandora_server/util/pwrd/
 ./install_pwrd.sh --install
Once installed, start the service:
/etc/init.d/pwrd start
Use the following script to start the Selenium server:
#!/bin/sh
# Monitoring selenium process
if [[ "`ps aux |grep selenium ]]; then
   exit
else
   if [[ "`ps aux |grep Xvfb ]]; then
      Xvfb :99 -ac &
      export DISPLAY=:99
   fi
   export DISPLAY=:99
   java -jar /usr/share/pandora_server/util/pwrd/selenium-server-standalone-2.53.1.jar &
fi
Or manually with the following commands:
$ Xvfb :99 -ac &
-> Press Enter to continue
$ export DISPLAY=:99
$ java -jar  /usr/share/pandora_server/util/pwrd/selenium-server-standalone-2.53.1.jar -port 4444 &
In version 730 and later, the possibility of performing the custom installation with a user and a directory different from those of the default installation has been added.
PWRD operating modes
PWRD provides several operating modes:
- Standalone: This standard mode will launch a single PWRD instance. Each of these instances will be associated with a Pandora FMS server.
- HUB: Hub mode. In this mode, the PWRD service will not evaluate the browsing sessions directly, but “nodes” must be registered to execute the tasks. It is the cluster mode of the PWRD service. Each HUB will be assigned to a Pandora FMS server.
PWRD in standalone mode
PWRD in standalone mode will start the daemon and get it ready to execute the actions indicated by the user through WUX Server.
Start:
/etc/init.d/pwrd start
See the status
/etc/init.d/pwrd status
Stop:
/etc/init.d/pwrd stop
PWRD in "HUB" mode
The hub mode will start the daemon as a load balancer. In this work mode, the system will balance the load among all the nodes that are registered on it, assigning browsing session execution to the nodes according to their workload.
You can see the HUB status at any time by accessing the HUB administration console:
http://<ip_addr_HUB>:4444/grid/console
Start:
/etc/init.d/pwrd start-hub
See the status:
/etc/init.d/pwrd status-hub
Stop:
/etc/init.d/pwrd stop-hub
Add PWRD nodes to HUB
To add a new PWRD node, you will need:
- A hub (PWRD in HUB mode).
- PWRD files, on the same or on different machines.
- TCP / 4444 connectivity from the computer hosting the node to the computer hosting the HUB.
In this working mode, the service will process all those requests queued from the hub (HUB) , giving back the results of the executions. It will be the HUB who will speak exclusively with the WUX Server, for which the one who executes the user's actions is visible.
Start and sign up in the HUB, replace “hub” with the IP of the PWRD HUB server:
/etc/init.d/pwrd start-node http://hub:4444/grid/register
See the status:
/etc/init.d/pwrd status-node
Stop:
/etc/init.d/pwrd stop-node
Uploading certificates for Firefox
It is possible that some of the configured checks are executed against web pages that use self-signed certificates or signed by a CA not included in those accepted by default in Firefox, so in those cases it will be necessary to load the certificate itself in the Firefox profile that is being used.
The easiest way to do it is to start the browser in a graphical environment, access the URL and add the SSL certificate. Next, we will explain how to do it both in Windows and Linux:
With PWRD deployed on Windows systems
In this case, since you have a graphical environment, just start the Firefox browser with the profile used for the checks:
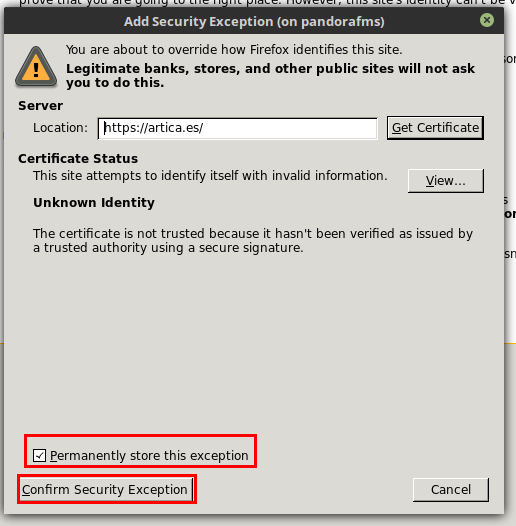
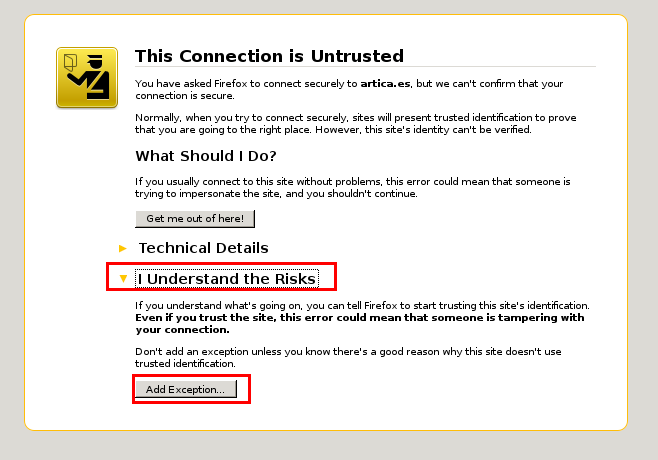
Once started, access the URL with the certificate you want to load and add it as an exception for the browser:
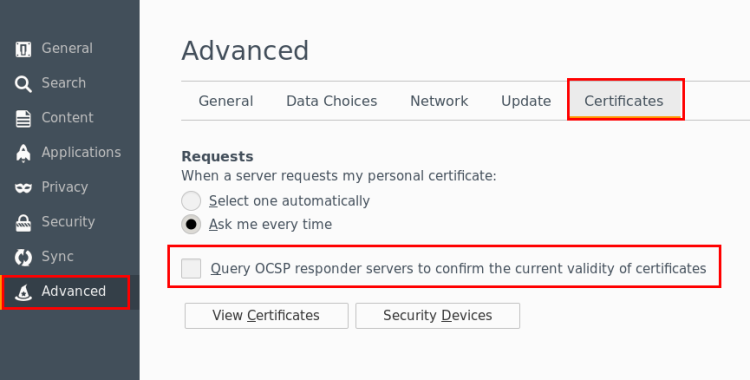
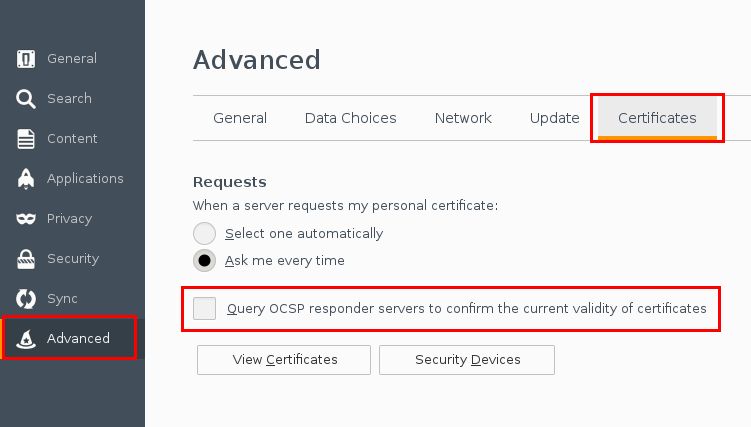
Another possibility, if you want to accept any SSL certificate, would be to go to Firefox options, go to “Privacy & Security” and uncheck the field “Check responding OCSP servers to guarantee the current validity of the certificates”:
With PWRD deployed on Linux systems
In general, when a Linux server is installed, it is not included in a graphical desktop environment, so in order to follow the same steps as in the previous case, redirect the graphical Xs to a computer where you do have a graphical desktop environment. This is done differently if we redirect the Xs to a graphical desktop in Linux or Windows.
Redirecting X11 to a Linux desktop
Doing it is very simple, since it will be enough to set an SSH connection to the PWRD server with the parameter “-X”:
ssh -X user@pwrd_ip_address
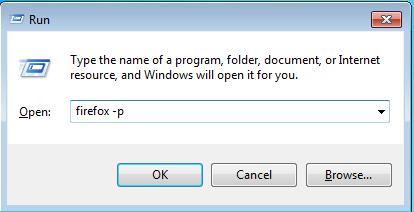
Once this is done, if you launch the Firefox browser, it will be shown on your desktop:
firefox -p
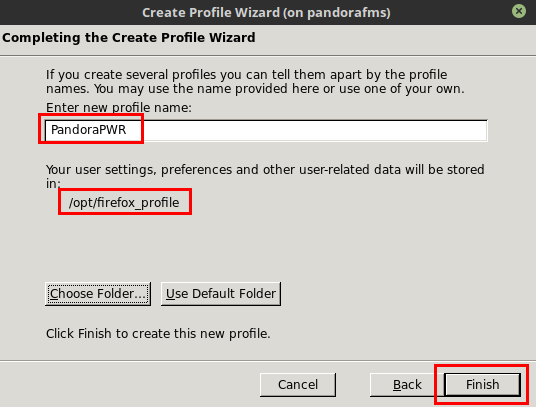
In a default installation, you will only see the “default” profile, so it would be advisable to do as in the installation in Windows and create a new profile to use:
In case of saving the profile in a path other than /opt/firefox_profile, it will be necessary to edit the PWRD starting script /etc/init.d/pwrd to indicate the path to the new profile:
PWROPTS=" -firefoxProfileTemplate /path/to/profile/folder"
With the created profile, you can start the browser:
Once started, access the URL with the certificate you want to load and add it as an exception for the browser:
Another possibility, if you want to accept any SSL certificate, would be to go to Firefox options, go to “Privacy & Security” and uncheck the field “Check responding OCSP servers to guarantee the current validity of the certificates”:
Redirecting X11 to a Windows desktop
In Windows, first install an X server to be able to redirect, such as Xming. Once installed and started, redirect the Xs.
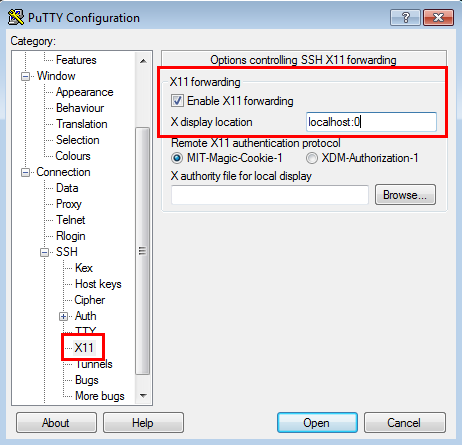
Using the SSH Putty client, go to the “Connection> SSH> X11” section before connecting, and make sure you check the “Enable X11 forwarding” option and fill in the “X display location” field as “localhost:0”:
Then go back to the “Session” section and establish the connection:
Once the connection is established, if you launch the Firefox browser on the PWRD server, you may see it on the Windows desktop.
firefox -p
In a default installation, you will only see the “default” profile, so it would be advisable to do as in the installation in Windows and create a new profile to use:
In case of saving the profile in a path other than /opt/firefox_profile, it will be necessary to edit the PWRD starting script /etc/init.d/pwrd to indicate the path to the new profile:
PWROPTS =" -firefoxProfileTemplate /path/to/profile/folder"
With the created profile, you can start the browser:
Once started, access the URL with the certificate you want to load and add it as an exception for the browser:
Another possibility, if you want to accept any SSL certificate, would be to go to Firefox options, go to “Privacy & Security” and uncheck the field “Check responding OCSP servers to guarantee the current validity of the certificates”:
Pandora FMS server configuration
To use the centralized mode (WUX), it will be necessary to apply the following configuration to the Pandora FMS server.
Regardless of the chosen mode, once started you may start assigning executions from your browsing sessions, adding the WUX Server configuration parameters to the configuration file of your Pandora FMS server.
Assuming that you have deployed your PWRD server on the same server where your Pandora FMS server runs, you should add the following configuration (add to /etc/pandora/pandora_server.conf):
wuxserver 1
wux_host 127.0.0.1
wux_port 4444
wux_timeout 30
The wux_timeout parameter sets the maximum transaction time to 30 seconds: if necessary adjust this value to your particular environment.
PFMS Threads Management
In case of using the PWRD in hub mode:
- The
wuxserverthreads management is done automatically when starting thepandora_serverservice. - It is done taking into account the number of nodes of a MINOR browser that is in the Selenium hub. For example:
- If in the hub there are configured 2 Firefox and 2 Chrome nodes, the number of
wuxserverthreads will be 2. - If 1 Firefox node and 4 Chrome nodes are configured in the hub, the number of threads will be 1.
- If 6 Firefox nodes are configured in the hub, the number of threads will be 6.
Note that each thread indicates the sessions that can be sent simultaneously from the wuxserver to the Selenium hub.
Session Recorder (PWR)
The new Selenium IDE version will be supported by Pandora FMS version 745 onwards, when Selenium 3 is implemented. Transactions recorded in Selenium 2 will not be affected.
Before monitoring a user experience, record it. Use the appropriate recording system according to the type of technology you chose.
Session recordings with Selenium 2 can only be done with Firefox.
To record a navigation with PWR, you will need the PWRD recorder available in the module library:
It contains:
- Web browser Firefox versión 47.0.1.
- Extension Selenium IDE.
Start the PWR_recorder.exe recorder:
It will automatically start Firefox with the environment ready to record PWR sessions:
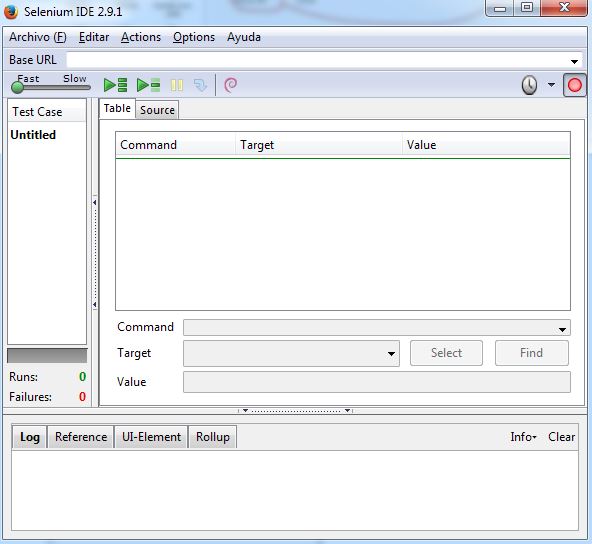
After accessing the Selenium IDE, you may start recording your user experience:
From that moment on, you will be able to navigate throughout the website that you wish to monitor and the different actions of each step that you take will appear in the recorder.
To stop the recording, use the following button, located in the upper right corner of the recorder:
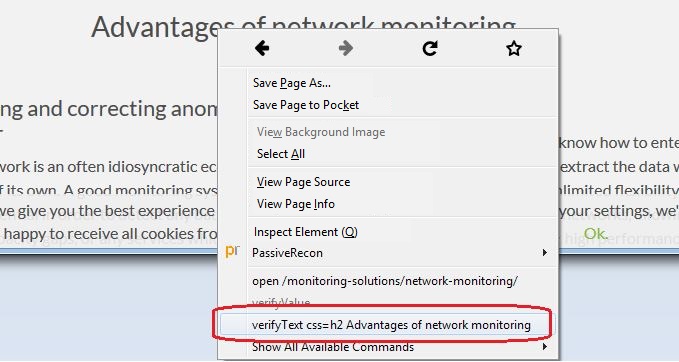
Once these actions are completed, perform the checks on the website. For example, check the existence of a certain text to make sure that the loaded page is the correct one. To that end, right-click on a section of text on the browser window while you keep recording, and select the option verifyText:
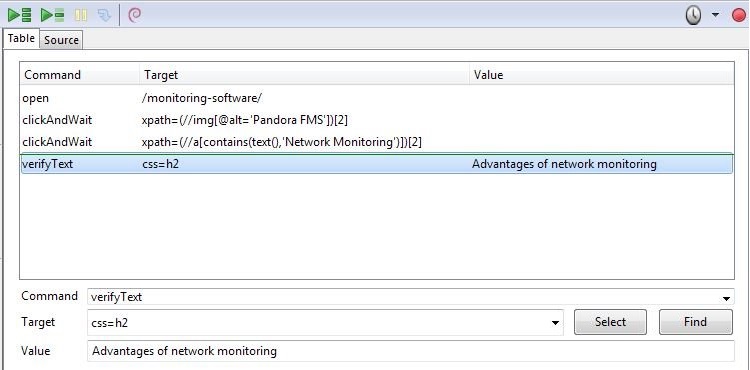
A new step will appear in the recorder indicating the indicated text checking action:
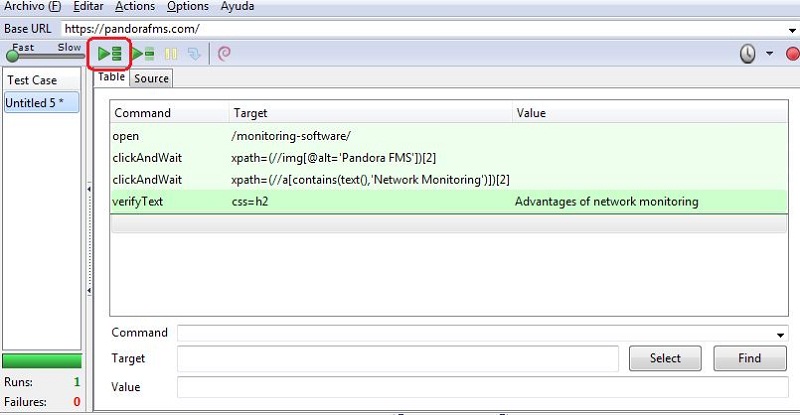
You may play the full sequence using the button Play entire test suite and check that it ends correctly:
Once the validity of the navigation sequence is verified, save it (File → Save Test Case) to execute it afterwards with Pandora FMS UX. The resulting file will be an HTML document that Pandora FMS UX will interpret.
Record a transactional session for PFMS WUX
Pandora FMS WUX allows dividing navigation monitoring into multiple modules, which will represent each one of the steps carried out.
To insert a new control point and generate the phase modules (up to that point), right-click on the point where you want to identify the beginning of the phase.
Type in the following text as a comment:
phase_start:<phase_name>
The phase will include the time and result of all the commands found until the following comment:
phase_end:<phase_name>
All commands executed between phase_start and phase_end tags will be included within that phase.
It should be taken into account that the recordings made in Selenium 2 may not work properly.
Web transaction execution
Standard execution
To launch pre-recorded PWR sessions, call the executable “pandora_ux_x64.exe”, which can be downloaded from the following link:
https://pandorafms.com/library/user-experience-pandora-ux
Indicate that the working mode is PWR, and the file that contains the session guidelines. In the path indicated in the -folder parameter, the screenshots will be saved to be shown in case of failure, optional parameter. You may also enter the number of consecutive retries in case of failure, optional parameter. Its execution in Windows is:
pandora_ux_x64.exe -exe PWR -script C:\tests\std.html -retries 3
The following modules will be returned:
- UX_Status_project_name: if the sequence succeeded or failed.
- UX_Time_project_name: time taken to complete the sequence.
- UX_Snapshot_project_name: screenshot right before the error, if any.
Example of successful execution:
<module>
   <name><![CDATA[UX_Status_std.html]]></name>
   <type>generic_proc</type>
   <data><![CDATA[1]]></data>
   <description><![CDATA[Test OK]]></description>
   <tags>UX</tags>
   <module_group>UX</module_group>
</module>
<module>
   <name><![CDATA[UX_Time_std.html]]></name>
   <type>generic_data</type>
   <data><![CDATA[16.317]]></data>
   <description><![CDATA[Test OK]]></description>
   <tags>UX</tags>
   <module_group>UX</module_group>
   <module_parent>UX_Status_std.html</module_parent>
</module>
Output with erroneous execution example:
<module>
   <name><![CDATA[UX_Status_std.html]]></name>
   <type>generic_proc</type>
   <data><![CDATA[0]]></data>
   <description><![CDATA[Failed to execute verifyText]]></description>
   <tags>UX</tags>
   <module_group>UX</module_group>
</module>
<module>
   <name><![CDATA[UX_Time_std.html]]></name>
   <type>generic_data</type>
   <data><![CDATA[15.463]]></data>
   <description><![CDATA[Failed to execute verifyText]]></description>
   <tags>UX</tags>
   <module_group>UX</module_group>
   <module_parent>UX_Status_std.html</module_parent>
</module>

<module>
   <name><![CDATA[UX_Snapshot_std.html]]></name>
   <type>async_string</type>
   <data><![CDATA[data:image/png;base64, iVBORw0KGgoAAAANSUhEUgAA…JRU5ErkJggg==]]></data>
   <description><![CDATA[Image (last error)]]></description>
   <tags>UX</tags>
   <module_group>UX</module_group>
   <module_parent>UX_Status_std.html</module_parent>
</module>
If everything has turned out right, you may add the execution line to the Pandora FMS agent installed on the machine that you have prepared to run the checks. The line to add to the agent configuration file will look like this (in one line):
In Windows:
module_plugin C:\Users\artica\Documents\Product\UX-Trans\UX\pandora_ux_x64.exe -exe PWR -script C:\Users\artica\Documents\Product\UX-Trans\PWR\sesion.html -folder <screenshots path>
In Linux:
module_plugin /usr/share/pandora_server/tool/pwrd/firefox/pandora_ux.64 -exe PWR -script /usr/share/pandora_server/tool/pwrd/firefox/TestUX.html -pwr_port 4444
Once it reports information to the Pandora FMS server, you will see how the corresponding modules appear. You may enable the view in “hierarchical mode” to see the relationship between them:
As indicated previously, you see the result of the execution (whether it was successful or not) in the module UX_Status_sesion.html, the time spent (in seconds) in the UX_Time_sesion.html module, and another with a screenshot of the last failure in UX_Snapshot_sesion.html, which in this case is empty. It will be on these modules where you may create alerts and show the individual graphs of each module.
Stage-based execution
If you have a transactional recording with Pandora FMS UX PWR, as indicated in previous sections, the system itself will generate the required modules to identify each of the indicated stages, so the execution will not change regarding the previous case. Just indicate the corresponding html file, which in this case will contain the different stages. Windows execution example:
pandora_ux_x64 -exe PWR -script C:\tests\std.html --folder <screenshots path>
The following modules will be returned by stage:
- UX_Time_project_name.phase_order
- UX_Status_project_name.phase_order
If there is any phase with an error, the following module will also be created:
- UX_Snapshot_project_name.phase_order
It will display an image of the web at the time of the error.
The global summary modules identified with the following names will also be returned:
- UX_Global_Time_project_name
- UX_Global_Status_project_name
- UX_Global_Snapshot_project_name
A web image at the time of the error will be displayed.
The agent's execution line would be the same as in the previous case, but with the html file that contains the stated phases.
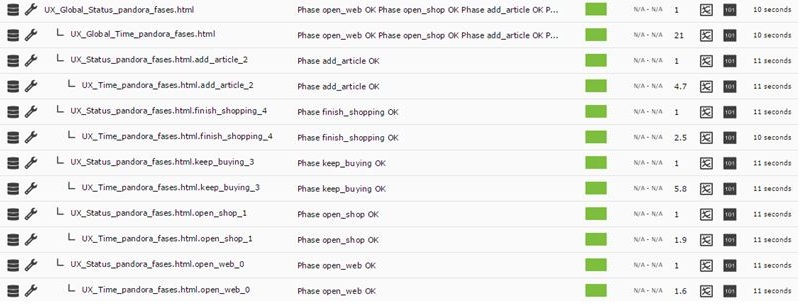
And when the information correctly reaches Pandora FMS server, it will be displayed as modules in this way. Enabling the view in hierarchical mode in the module list will help you see the information much more clearly:
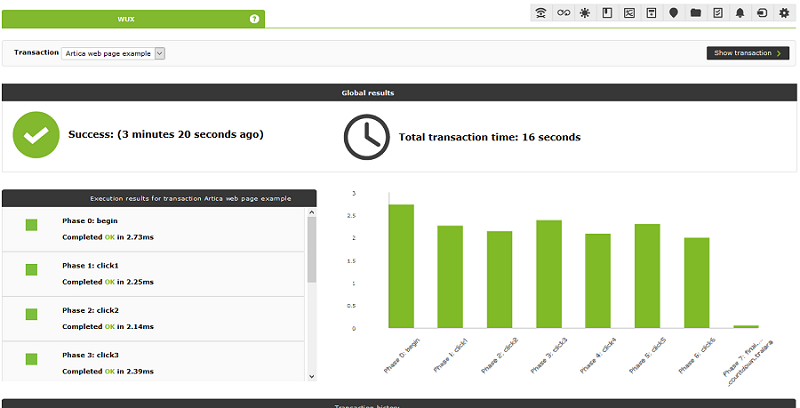
By accessing the WUXsection of the agent, you may see additional details of the transaction and its stages:
The example below represents a browsing process of our website and the purchase of multiple items, divided into 5 stages to accurately measure the times and know where improvements are needed, or a bottleneck takes place:
Value recovery
Pandora FMS UX is capable of retrieving data directly from the website during the execution of user experience tests.
To use this new feature, add the screenshot command as a comment in the Selenium test:
In the example here, two values are retrieved after navigation and will be represented as modules in Pandora FMS (number and result in text).
The steps to make the plugin collect data are as follows:
- Add a new comment to your test file with the Selenium recorder.
- Add the directive to the comment.
Data capture policy
getValue;<module name>;<module data type>;<Perl regular expression for data capture>
What does each field separated by semicolons represent?
- getValue: Instruction for the UX system.
- Module name: The name of the module as it appears in Pandora FMS.
- Module data type: What type will be used. It can be any of the data types supported by Pandora FMS.
- Perl regular expression for data capture: It must be a Perl regular expression, with the information capture command between brackets.
For example, in the text:
<p> The temperature of the solar panel is: <span class="temperature">54º C</span></p>
If you wish to retrieve the temperature to keep track of the value, specify the regular expression as follows:
<span class="temperature">(\d+\.*\,*\d*).*</span>
In such a way that it will recover the value 54 of the example, or possible values with decimal places.
The full capture directive would be as follows:
getValue;solar panel temperature;generic_data;<span class="temperature">(\d+\.*\,*\d*).*</span>
The commands that generate modules are:
- getValue: Extract a value.
getValue;module_name;module_type;REGEX_string_match
- getVariable: (Version 753 or later) Extract an specific value from a variable.
getVariable;module_name;module_type;var_name
- getScreenshoot: capture screen.
getScreenshot;module_name
getValue is a command that belongs to the type that generate PFMS modules. Visit the previous link to find out more about them.
All your own commands must appear in the test file (.side) as comments. Otherwise, it will fail to test the test in the Selenium extension.
Data management and display
Create a web analysis module in Pandora FMS Console
Once the browsing session is recorded, it is time to deploy it as a module in Pandora FMS console.
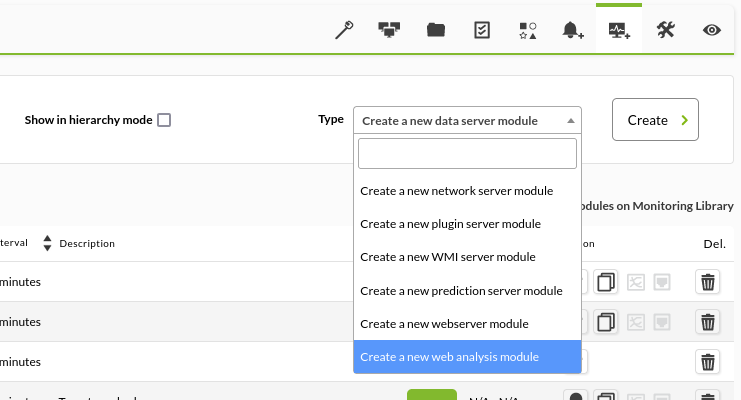
To do it, access any agent linked to a server with the WUX feature enabled and create a new module with the option Create a new web analysis module:
Once Create is selected, fill in all the fields the form presents:
Module name
WUX Module (Parent). All sub-modules with the monitoring results will rely on this new module.
Run performance tests
It indicates that you wish to monitor not only the browsing experience, but also the performance statistics of access to the target website.
Execute test from
Set the WUX server that will execute the test.
Browser
Web browser that will run the test.
The indicated browser must be on the Selenium grid or server used by the WUX server.
User data dir
(Version 764 or later) Optional: It allows you to specify a data directory.
User data dir option only works on Google Chrome web browser.
Profile
(Version 764 or later) Optional: It allows to specify a user profile. If the profile name does not exist, use the default profile.
The Profile option only works on Google Chrome web browser.
Accept insecure certificates
If enabled, any insecure certificate (self-signed, expired, etc.) that is part of the navigation will be accepted.
This option is only available for Google Chrome and Mozilla Firefox browsers, and will only take effect if the test is run by a Selenium 3 server.
Data history
To save or not the historical information of the modules that monitor this user experience.
Text area section
Text box where to copy (or load) the content of the files from the browsing session that you previously recorded.
FF interval
Module execution flip flop time interval (in seconds).
Retries
Number of module launch retries.
Custom macros
Custom macros enabled involve replacing certain text strings present in your browsing session file with certain custom values.
This feature has been improved for web analysis modules, enabling dynamic macros that allow these values to be translated into variable dates and times.
Why this feature?
Suppose you need to monitor, through a browsing session, the correct operation of a meeting room booking web application.
If you set a fixed date and time when filling in the form data, it is possible that the system canceled the booking because at some point it is in the past. For example, you might be trying to book a room for the past week.
It is also possible that you find a time limit to make that reservation, and that the system forces you to book the room within a specific time period, for example, no farther than the current month.
To avoid having to edit the macro every few days, and not worry about the configuration section, you may use dynamic macros, telling the system to always book the room for the next day at the time of performing the test.
In order to use this feature, the values must have a specific format, achieving the following possible replacements:
@DATE_FORMATcurrent date/time with user-defined format.@DATE_FORMAT_nhhours.@DATE_FORMAT_nmminutes.@DATE_FORMAT_nddays.@DATE_FORMAT_nsseconds.@DATE_FORMAT_nMmonth.@DATE_FORMAT_nYyear.
Where “n” can be an unsigned (positive) or negative number.
And FORMAT follows the standard of strftime of perl
For example:
 @DATE_%Y-%m-%d %H:%M:%S
 @DATE_%H:%M:%S_300s
 @DATE_%H:%M:%S_-1h
Data display
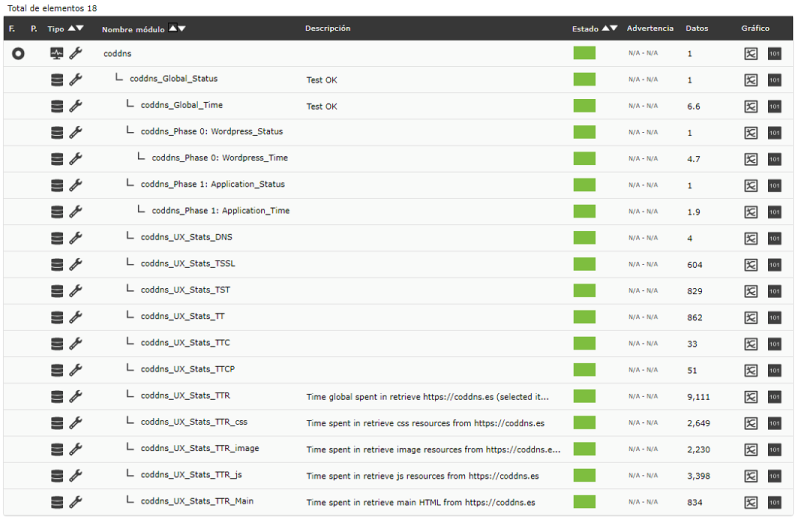
The information generated by WUX will be displayed in the form of modules as follows. Enabling the view in hierarchical mode in the module list will help you see the information much more clearly:
Within this hierarchy you find the following modules:
- module_Global_Status: It will indicate the global state of the complete navigation.
- If there is a recording, it gives the status of the WUX recording.
- In the case that the run performance Test is enabled but the recording is not included, the Global Status module status is the status of the check that is performed when obtaining these modules.
- module _ Global_Time: It will indicate the global time spent in full navigation.
- module_ Global_Screenshot: It contains an image with the result of the navigation error, it will only be generated in case of error
- module_Phase X: Phase name_ Status: It will indicate the navigation status during phase X.
- module_Phase X: Phase name_Time: It will indicate the time spent in phase X.
Example: Error screenshot view.
Warning: If you have updated from previous versions to Pandora FMS 7.0NG 712, you must make a small change.
In order to store the screenshots generated by WUX Server, you will need to launch the following operations in your database schema:
 alter table tagente_estado modify column datos mediumtext;
 alter table tagente_datos_string modify column datos mediumtext;
Note: Pay attention to table names.
If you do not perform, you may not see the full screenshot.
By accessing the WUXsection of the agent, you may see additional details of the transaction and its stages:
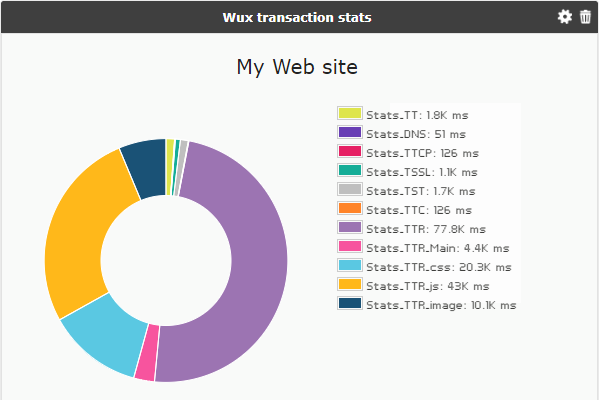
Website statistics are summarized in the following concepts:
- Stats_TT: Total time to load the website.
- Stats_TDNS: Total time to solve the target's IP address.
- Stats_TTCP: Time spent connecting through TCP.
- Stats_TSSL: Time spent establishing SSL communication.
- Stats_TST: Time elapsed until data transfer started.
- Stats_TTC: Time transferring data. It will group all the resource transfer times.
- Stats_TTR: Time taken to transfer the content of the page.
- Stats_TTR_main: Time used to transfer the HTML code.
- Stats_TTR_image: Time spent transferring image type resources (png|jpg|jpeg|bmp|tiff|gif|webp|svg).
- Stats_TTR_css: Time taken to transfer style sheets.
- Stats_TTR_js: Time spent transferring JavaScript files.
Assign alerts to a web analytics module
The alerts associated with the web analysis modules follow the same operating dynamics as the entire alert system in Pandora FMS.
For compatibility purposes, it is recommended to assign the alert templates on the sub-elements self-generated by the web analysis module, such as:
- The status of global navigation.
- Alerts about time thresholds.
- Alerts with warning template set to “always” for result screenshot modules.
New widgets for Dashboards
In order to represent user navigation information, two new types of widgets have been added:
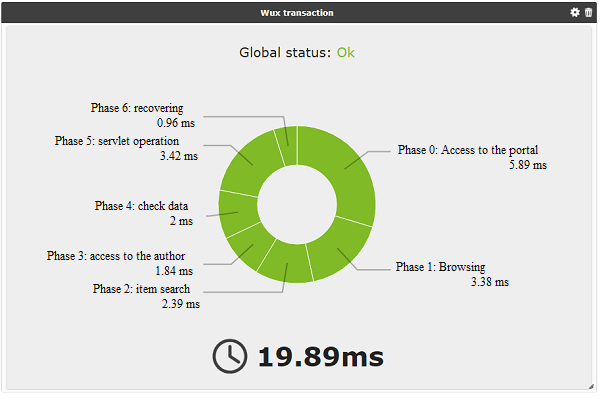
Navigation phase status widget:
Website statistics widget:
Desktop User Experience (PDR)
PDR system deployment
The PDR system only works on Windows® systems, and once it is run by Pandora FMS agent, it must run in process mode, since running in service mode will not work. Also, it will not be possible to lock the desktop session, so it is recommended to use it on virtual machines.
Prerequisites:
- Windows® system in desktop mode with auto start and auto login.
To achieve this configuration, execute:
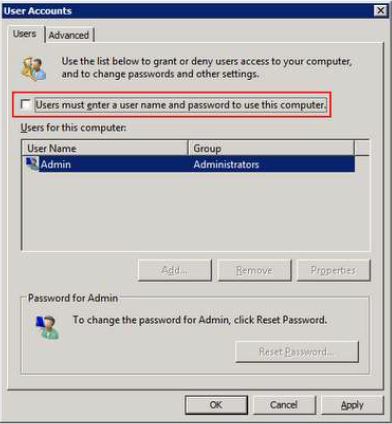
For versions prior to Windows 10®:
control userpasswords2
And uncheck the box “Users must enter a username and password to use this computer”:
For Windows 10®:
One way to enable autostart on MS Windows®, version 10, is to use Sysinternals Powertoys (available in the download section of the Microsoft® documentation) and enable the user who will perform the monitoring, for example:
To prepare the environment, create the following directories:
C:\PDR
And unzip the PDR.rar file provided in the following link: https://pandorafms.com/library/pdr-cmd-for-ux-monitoring/ in C:\PDR.
Record a PDR session
To start the recorder, run the following script:
C:\PDR\pdr
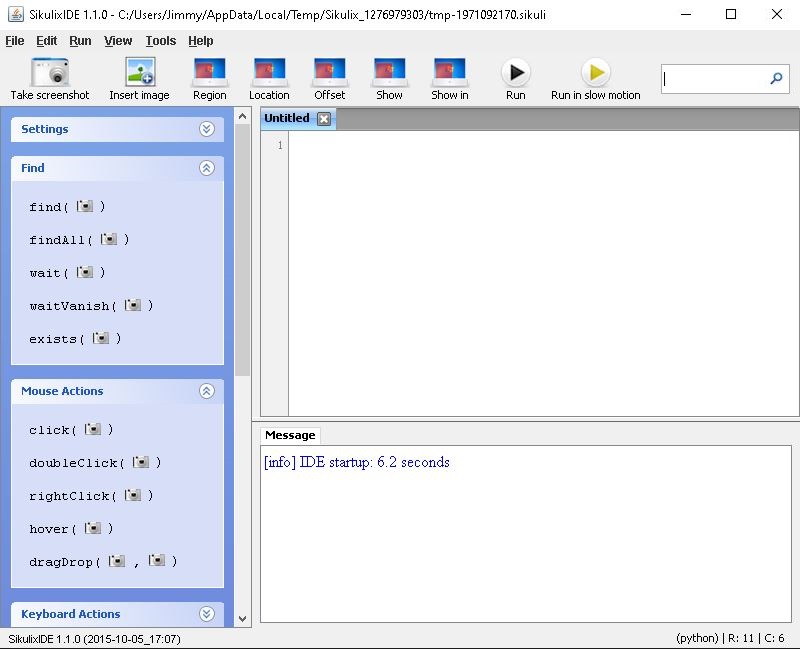
After the loading process, enter the recording environment:
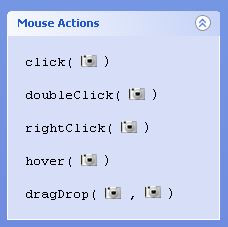
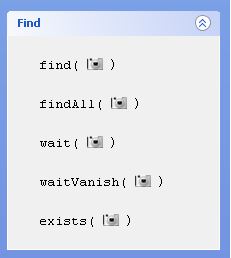
Select the actions you wish to perform and do a screenshot on the area where you want to apply them. Below you can find a list with the most common ones.
General actions:
Flow control actions:
More language help: http://sikulix-2014.readthedocs.io/en/latest/index.html
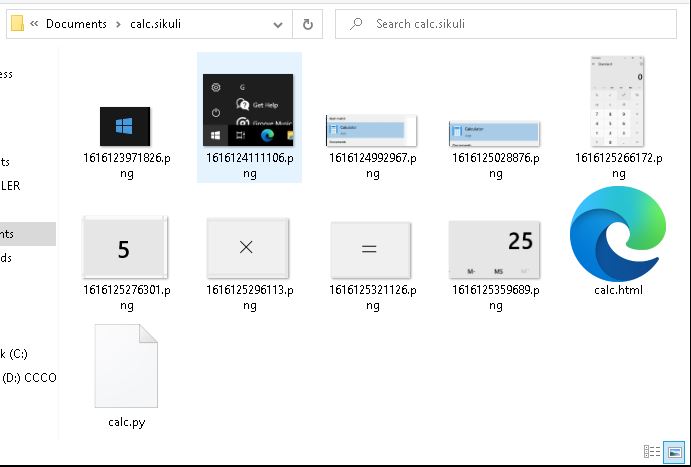
When recording the project, a folder will be created that will contain the following elements:
- .py file with the automation script code.
- Images to control navigation.
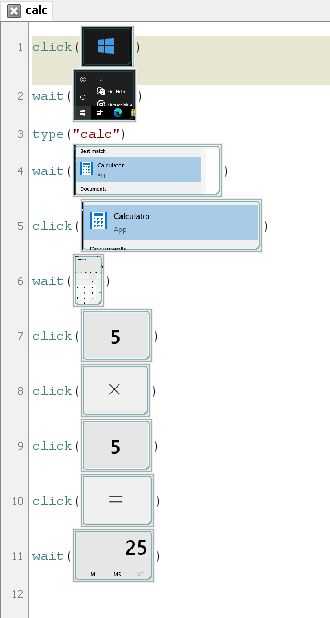
A simple example of execution could be monitoring that your Windows calculator works correctly. We will show the whole process through screenshots.
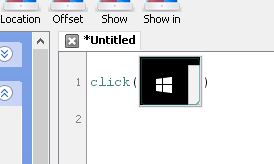
1. Choose the “click” action and the area where you wish to apply the action. The screen will change to “area selection” mode:
2. Enter the action type and the text “calc”. Then enter the actions to wait for the “calculator” area to appear and click on it. Then wait for the calculator window to appear to enter the following actions this way:
3. Then click on the corresponding buttons, selecting the areas as in the previous steps.
4. Finally save the process and run it using the Run button.
Important comments:
- If you double click on any of the images within the recording environment, you may adjust details of the control screenshot, such as selecting the exact point where to click.
- It is highly recommended to enter actions such as wait after each click to make sure that the execution will not stop due to an operating system delay.
- The recorder will search for the area that looks the same as the screenshot, so special care should be taken in case something is highlighted when the button is located above (for example, the calculator buttons change to orange when the mouse is hovering over them).
In the folder where you stored the recording you may see the image files and the Python file.
Note: You can customize the capture made from the PDR recording engine using the following code:
 ## OPTIONAL ##capture file names
 import shutil
 file = "C:\probes\screenshot_prueba.sikuli.png"
 focusWindow = App.focusedWindow()
 regionImage = capture(focusWindow)
 shutil.move(regionImage, file)
This will create an image of the active window in the destination indicated by file, with which you may take a screenshot right when you want. You may customize the screenshot using coordinates. To that end, specify the following syntax:
capture(x, y, w, h)
Where:
X: horizontal position of the rectangle to take a screenshot on.
Y: vertical position of the rectangle to take a screenshot on.
W: Screenshot width.
H: Screenshot height.
Record a transactional session with Pandora FMS UX PDR
It is not necessary to record a specific session. Just record the sessions you need in different scripts. It will be Pandora FMS UX who manages the return of results to organize it as a complex transaction. In the next point, we will see how to make the execution call for it to work correctly.
If you are going to make several recordings to create a transactional process, be careful when making the recording and make sure the elements you are looking for are present. It is recommended to manually execute the recordings that you wish to use in a single transactional process continuously, to ensure that the actions proceed as expected.
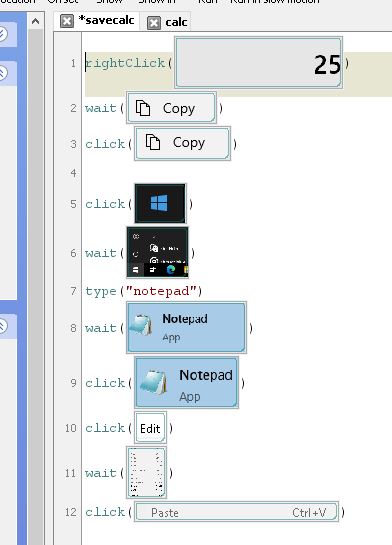
The following example contains a recording process that will represent the second phase of the process used in the previous example. The result returned by the calculator is copied and pasted into a notebook. The recording looks like this:
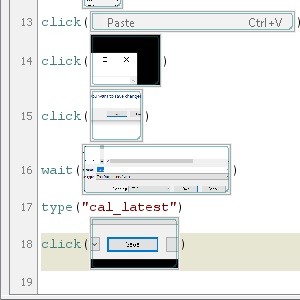
And another sequence that will consist of saving the text file in a certain location is included, overwriting the previous one. This offers high flexibility, since it opens the possibility of monitoring these files at the same time, reflecting the needed information in all kinds of checks for heavy desktop applications. This third sequence consists of the following steps:
PDR session execution
Standard execution
To launch pre-recorded PDR sessions, the working mode indicated is the path to the pdr.cmd file displayed at the corresponding point, the argument of said “-r” file, the file that contains the session directives (-script), the directory where to store the screenshots (-folder) ending in “\”, which is optional, where to save the screenshots in the folder where the pdr is located. You may also enter the number of consecutive retries in case of failure, optional parameter.
In the next run, the screen capture is also customized to collect only the active window:
pandora_ux_x64 -exe C:\PDR\pdr -args -r -script C:\pandora_ux\calculadora.sikuli -folder C:\pandora_ux\ -ss_config active -retries 3
The following modules will be returned:
- UX_Time_project_name.
- UX_Status_project_name.
- UX_Control_Snapshot_project_name (only on the first run).
If there is an error at any stage, the following module will also be created:
- UX_Snapshot_project_name.
And it will show an image of the active window (with -ss_config active) from when the failure took place.
Example of successful execution:
<module>
   <name><![CDATA[UX_Status_calculator.sikuli]]></name>
   <type>generic_proc</type>
   <data><![CDATA[1]]></data>
   <description><![CDATA[C:\pandora_ux\calculator.sikuli execution completed Control snapshot rebuild ]]></description>
   <tags>UX</tags>
   <module_group>UX</module_group>
</module>
<module>
   <name><![CDATA[UX_Time_calculator.sikuli]]></name>
   <type>generic_data</type>
   <data><![CDATA[20.204]]></data>
   <description><![CDATA[C:\pandora_ux\calculator.sikuli execution completed Control snapshot rebuilt ]]></description>
   <tags>UX</tags>
   <module_group>UX</module_group>
   <module_parent>UX_Status_calculator.sikuli</module_parent>
</module>
<module>
   <name><![CDATA[UX_Control_Snapshot_calculator.sikuli]]></name>
   <type>async_string</type>
   <data><![CDATA[data:image/png;base64, IBCAIAAAAOCnfhAAAAAXNSR…/4x79e/7757f8H2C00s1C73yMAAAAASUVORK5CYII=]]></data>
   <description><![CDATA[Control image rebuilt]]></description>
   <tags>UX</tags>
   <module_group>UX</module_group>
   <module_parent>UX_Status_calculator.sikuli</module_parent>
</module>
Example of output with failed execution:
<module>
   <name><![CDATA[UX_Status_std.html]]></name>
   <type>generic_proc</type>
   <data><![CDATA[0]]></data>
    <description><![CDATA[Failed to execute verifyText]]></description>
   <tags>UX</tags>
   <module_group>UX</module_group>
</module>
<module>
   <name><![CDATA[UX_Time_std.html]]></name>
   <type>generic_data</type>
   <data><![CDATA[15.463]]></data>
    <description><![CDATA[Failed to execute verifyText]]></description>
   <tags>UX</tags>
   <module_group>UX</module_group>
   <module_parent>UX_Status_std.html</module_parent>
</module>
<module>
   <name><![CDATA[UX_Snapshot_std.html]]></name>
   <type>async_string</type>
   <data><![CDATA[data:image/png;base64, iVBORw0KGgoAAAANSUhEUgAA…JRU5ErkJggg==]]></data>
    <description><![CDATA[Image (last error)]]></description>
   <tags>UX</tags>
   <module_group>UX</module_group>
   <module_parent>UX_Status_std.html</module_parent>
</module>
If everything turned out to be a success, you may add the execution line to the Pandora FMS agent installed on the Windows machine as an agent plugin. The line to add to the agent configuration file will look like this (in a single line):
module_plugin C:\Users\artica\Documents\Product\UX-Trans\ux\pandora_ux_x64.exe -exe C:\PDR\pdr.bat -args -r -script C:\PDR\calc.sikuli -folder C:\PDR\ -ss_config active -checkpoint -post "taskkill /F /IM calc.exe"
As you can see, this run has a few more options. The -checkpoint parameter is used to show a screenshot of the result, even if there is no failure. -post will execute actions after the session playback is finished. In this case, the calculator process that started the recording is closed, to prevent the system from failing due to too many open windows or similar processes.
Now that the agent has the execution line module_plugin ready, it is launched in process mode, executing the following from the command line as administrator:
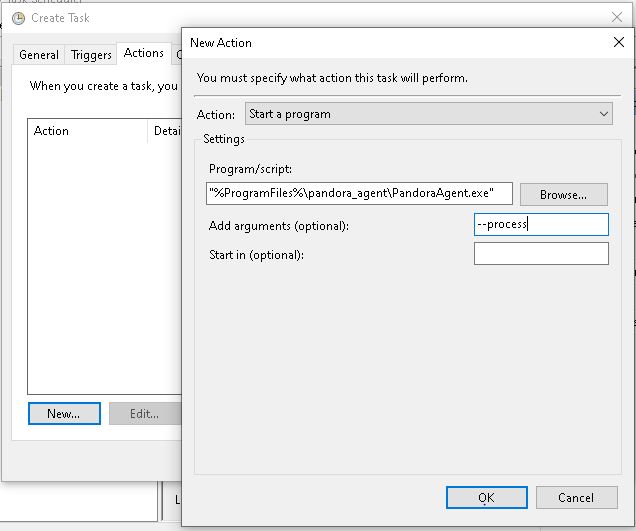
"%ProgramFiles%\pandora_agent\PandoraAgent.exe" --process
Obviously, the full path to the executable “PandoraAgent.exe” must be the one corresponding to the installation.
When launching it, the actions will be executed automatically according to the recording. From that point onwards the agent process should not be closed, and you should not log in the machine through remote desktop, or the executions could be interrupted. The machine must be left unhandled, that is why its use is recommended in virtual machines.
If you already have automation tests, they can be included in Pandora FMS with the following execution.
pandora_ux.64 -exe <exe of the automation system> -args <system arguments> -script <test file path>
<exe of the automation system>: exe (executable) of the automation system.<system arguments>: System arguments.<test file path>: Test file path.
Transaction-based execution
If you have recorded different processes with PDR and you have checked they work by playing them continuously, run:
C:\Users\artica\Documents\Product\UX-Trans\ux\pandora_ux_x64.exe -exe C:\PDR\pdr.cmd -args -r -t calculadora_trans -script C:\PDR\calc.sikuli,C:\PDR\savecalc.sikuli,C:\PDR\savefile.sikuli -folder C:\PDR\ -ss_config active
As it can be seen, just indicate the path of the new script in the -script parameter separated by a comma from the previous script and use the -t parameter with the name of the transaction that will include the different phases . If the process had more phases, the same logic would be followed, for example:
pandora_ux_x64.exe -exe C:\PDR\pdr.cmd -args -r -t proceso_transaccional -script C:\PDR\script1,C:\PDR\script2,C:\PDR\script3,C:\PDR\script4 -folder C:\PDR\ -ss_config active
The line to add to the agent configuration file, in this case, is the following:
module_plugin C:\Users\artica\Documents\Product\UX-Trans\ux\pandora_ux_x64.exe -exe C:\PDR\pdr.cmd -args -r -t calculadora_trans -script C:\PDR\calc.sikuli,C:\PDR\savecalc.sikuli,C:\PDR\savefile.sikuli -folder C:\PDR\ -ss_config active -checkpoint -post "taskkill /F /IM calc.exe"
Thanks to the -checkpoint parameter, you may see screenshots of the result of each phase in the Pandora FMS console.
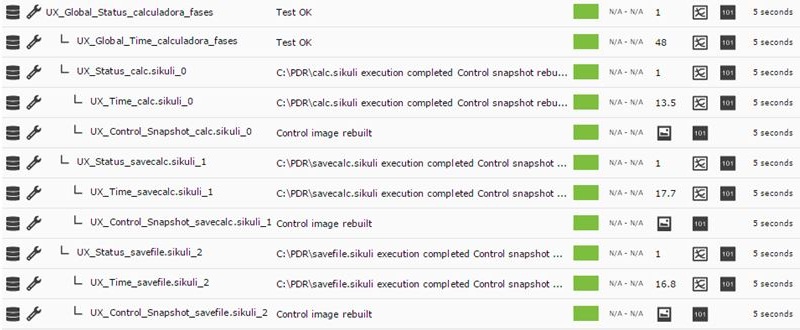
The following modules will be returned by stage:
- UX_Time_project_name.phase_order
- UX_Status_project_name.phase_order
If there is any phase with an error, the following module will also be created:
- UX_Snapshot_project_name.phase_order
It will also display an image of the web at the time of the failure, should it take place.
The global summary modules identified with the following names will also be returned:
- UX_Global_Time_project_name
- UX_Global_Status_project_name
- UX_Global_Snapshot_project_name
When the agent is running in process mode and the modules are recovered by Pandora FMS you will see them in the console. Again, through the view in “hierarchical mode” you can clearly show the relationship between the modules shown, clearly defining the different phases:
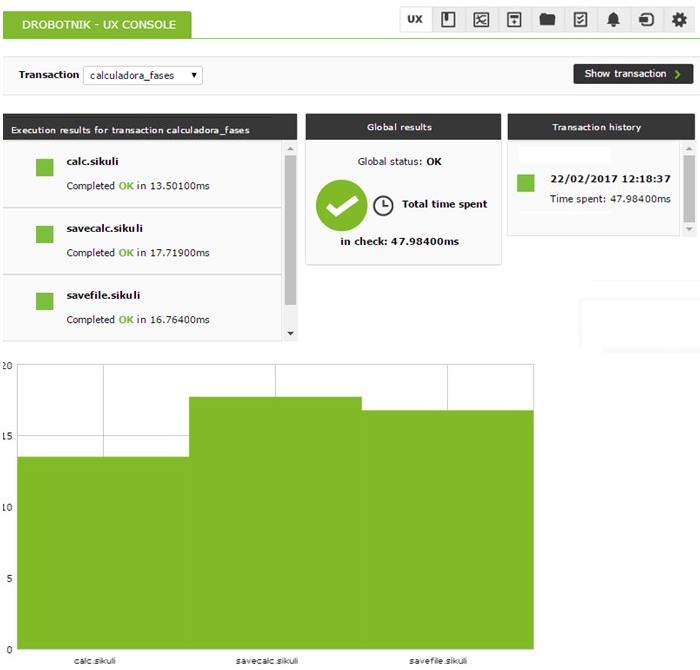
And in the transaction viewer, you can see the detail of the phases and the graph with the times:
The error traps will only be shown when the UX client (PWR) and the PWR server are running on the same machine. Otherwise, the directory for image delivery by the PWR server must be accessible by the client in order to display the image in Pandora FMS.
It will be on these modules where you may create alerts and see the history to build graphs and show the evolution of your systems over time.
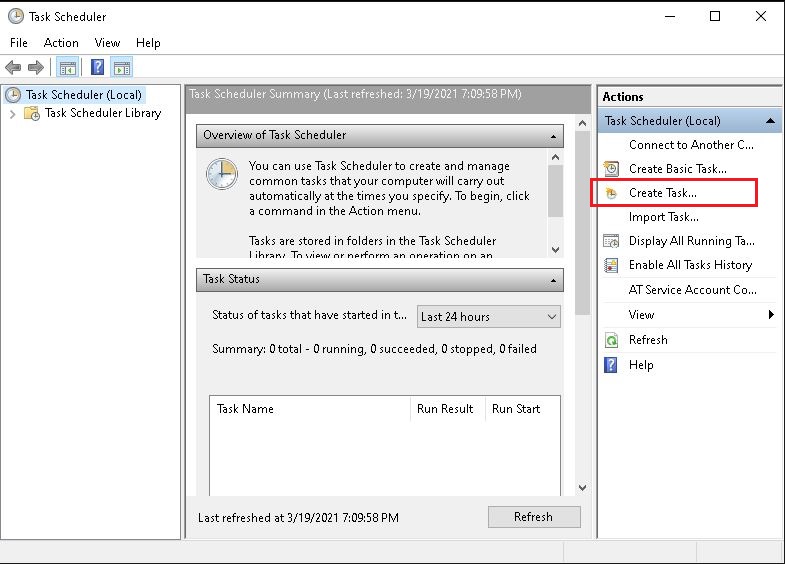
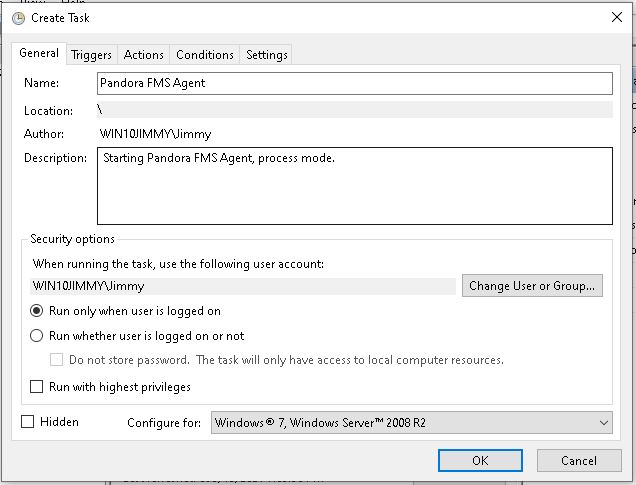
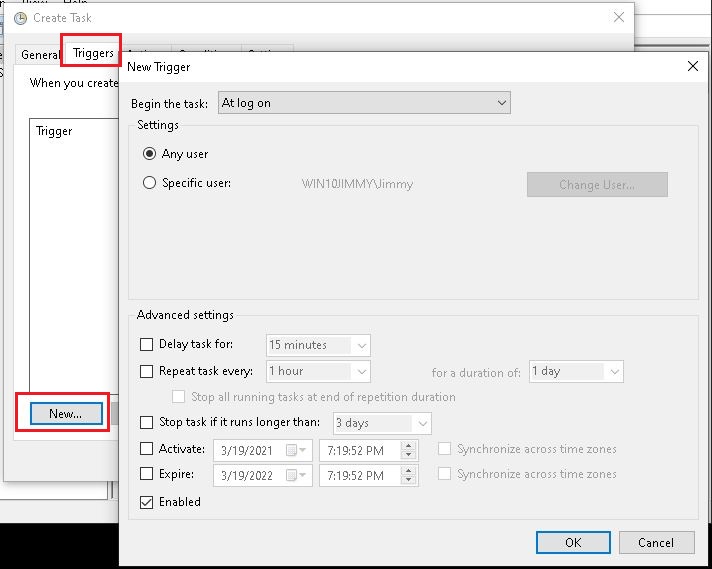
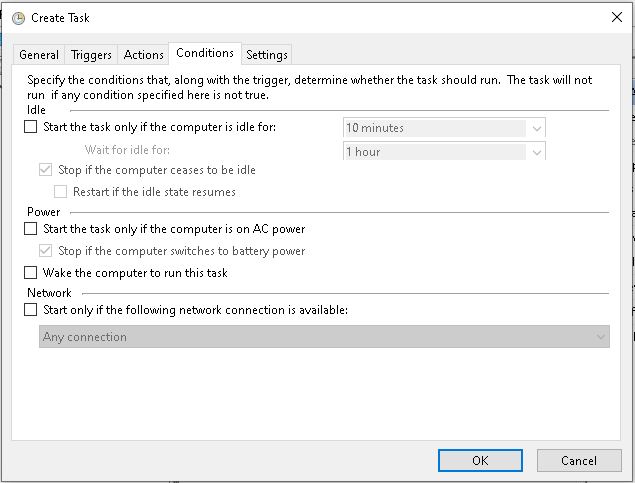
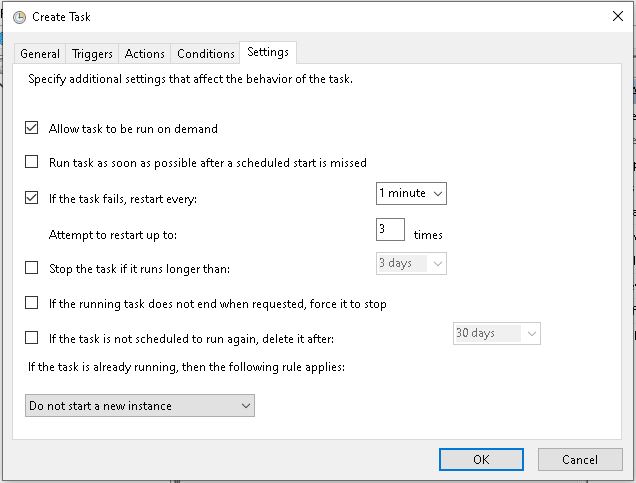
It is recommended to create a scheduled task that starts the Pandora FMS agent in process mode when the computer starts. This will not interrupt executions even if the system is forcefully restarted and if it is in automatic login mode without password, the agent will always be run even if the machine is restarted.
That way you will ensure the Pandora FMS agent will always be running in process mode in this Windows system, even when the machine is restarted, being able to always send the information collected by the PDR probe.
Systems with multiple desktops can be troublesome, so it is always recommended to use the configuration described above, on a desktop-mode machine with auto-login and a single desktop.


 Home
Home

