Desktop user experience monitoring (PDR)
Desktop User Experience (PDR)
PDR system deployment
The PDR system only works on Windows® systems, and once it is run by Pandora FMS agent, it must run in process mode, since running in service mode will not work. Also, it will not be possible to lock the desktop session, so it is recommended to use it on virtual machines.
Prerequisites:
- Windows® system in desktop mode with auto start and auto login.
To achieve this configuration, execute:
For versions prior to Windows 10®:
control userpasswords2
And uncheck the box “Users must enter a username and password to use this computer”:
For Windows 10®:
One way to enable autostart on MS Windows®, version 10, is to use Sysinternals Powertoys (available in the download section of the Microsoft® documentation) and enable the user who will perform the monitoring, for example:
To prepare the environment, create the following directories:
C:\PDR
And unzip the PDR.rar file provided in the following link: https://pandorafms.com/library/pdr-cmd-for-ux-monitoring/ in C:\PDR.
Record a PDR session
To start the recorder, run the following script:
C:\PDR\pdr
After the loading process, enter the recording environment:
Select the actions you wish to perform and do a screenshot on the area where you want to apply them. Below you can find a list with the most common ones.
General actions:
Flow control actions:
More language help: http://sikulix-2014.readthedocs.io/en/latest/index.html
When recording the project, a folder will be created that will contain the following elements:
- .py file with the automation script code.
- Images to control navigation.
A simple example of execution could be monitoring that your Windows calculator works correctly. We will show the whole process through screenshots.
1. Choose the “click” action and the area where you wish to apply the action. The screen will change to “area selection” mode:
2. Enter the action type and the text “calc”. Then enter the actions to wait for the “calculator” area to appear and click on it. Then wait for the calculator window to appear to enter the following actions this way:
3. Then click on the corresponding buttons, selecting the areas as in the previous steps.
4. Finally save the process and run it using the Run button.
Important comments:
- If you double click on any of the images within the recording environment, you may adjust details of the control screenshot, such as selecting the exact point where to click.
- It is highly recommended to enter actions such as wait after each click to make sure that the execution will not stop due to an operating system delay.
- The recorder will search for the area that looks the same as the screenshot, so special care should be taken in case something is highlighted when the button is located above (for example, the calculator buttons change to orange when the mouse is hovering over them).
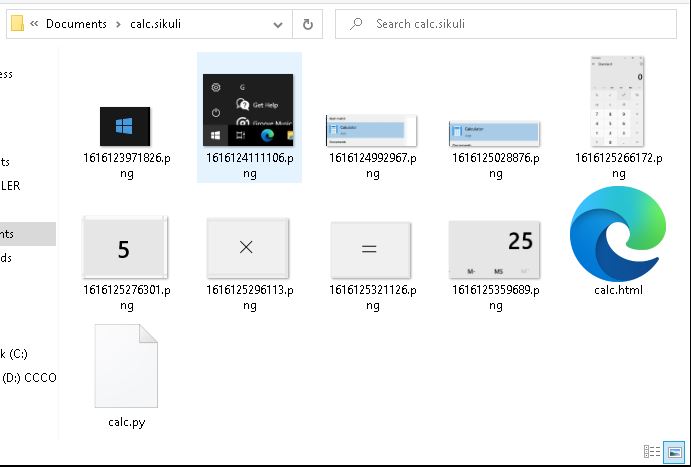
In the folder where you stored the recording you may see the image files and the Python file.
Note: You can customize the capture made from the PDR recording engine using the following code:
 ## OPTIONAL ##capture file names
 import shutil
 file = "C:\probes\screenshot_prueba.sikuli.png"
 focusWindow = App.focusedWindow()
 regionImage = capture(focusWindow)
 shutil.move(regionImage, file)
This will create an image of the active window in the destination indicated by file, with which you may take a screenshot right when you want. You may customize the screenshot using coordinates. To that end, specify the following syntax:
capture(x, y, w, h)
Where:
X: horizontal position of the rectangle to take a screenshot on.
Y: vertical position of the rectangle to take a screenshot on.
W: Screenshot width.
H: Screenshot height.
Record a transactional session with Pandora FMS UX PDR
It is not necessary to record a specific session. Just record the sessions you need in different scripts. It will be Pandora FMS UX who manages the return of results to organize it as a complex transaction. In the next point, we will see how to make the execution call for it to work correctly.
If you are going to make several recordings to create a transactional process, be careful when making the recording and make sure the elements you are looking for are present. It is recommended to manually execute the recordings that you wish to use in a single transactional process continuously, to ensure that the actions proceed as expected.
The following example contains a recording process that will represent the second phase of the process used in the previous example. The result returned by the calculator is copied and pasted into a notebook. The recording looks like this:
And another sequence that will consist of saving the text file in a certain location is included, overwriting the previous one. This offers high flexibility, since it opens the possibility of monitoring these files at the same time, reflecting the needed information in all kinds of checks for heavy desktop applications. This third sequence consists of the following steps:
PDR session execution
Standard execution
To launch pre-recorded PDR sessions, the working mode indicated is the path to the pdr.cmd file displayed at the corresponding point, the argument of said “-r” file, the file that contains the session directives (-script), the directory where to store the screenshots (-folder) ending in “\”, which is optional, where to save the screenshots in the folder where the pdr is located. You may also enter the number of consecutive retries in case of failure, optional parameter.
In the next run, the screen capture is also customized to collect only the active window:
pandora_ux_x64 -exe C:\PDR\pdr -args -r -script C:\pandora_ux\calculadora.sikuli -folder C:\pandora_ux\ -ss_config active -retries 3
The following modules will be returned:
- UX_Time_project_name.
- UX_Status_project_name.
- UX_Control_Snapshot_project_name (only on the first run).
If there is an error at any stage, the following module will also be created:
- UX_Snapshot_project_name.
And it will show an image of the active window (with -ss_config active) from when the failure took place.
Example of successful execution:
<module>
   <name><![CDATA[UX_Status_calculator.sikuli]]></name>
   <type>generic_proc</type>
   <data><![CDATA[1]]></data>
   <description><![CDATA[C:\pandora_ux\calculator.sikuli execution completed Control snapshot rebuild ]]></description>
   <tags>UX</tags>
   <module_group>UX</module_group>
</module>
<module>
   <name><![CDATA[UX_Time_calculator.sikuli]]></name>
   <type>generic_data</type>
   <data><![CDATA[20.204]]></data>
   <description><![CDATA[C:\pandora_ux\calculator.sikuli execution completed Control snapshot rebuilt ]]></description>
   <tags>UX</tags>
   <module_group>UX</module_group>
   <module_parent>UX_Status_calculator.sikuli</module_parent>
</module>
<module>
   <name><![CDATA[UX_Control_Snapshot_calculator.sikuli]]></name>
   <type>async_string</type>
   <data><![CDATA[data:image/png;base64, IBCAIAAAAOCnfhAAAAAXNSR…/4x79e/7757f8H2C00s1C73yMAAAAASUVORK5CYII=]]></data>
   <description><![CDATA[Control image rebuilt]]></description>
   <tags>UX</tags>
   <module_group>UX</module_group>
   <module_parent>UX_Status_calculator.sikuli</module_parent>
</module>
Example of output with failed execution:
<module>
   <name><![CDATA[UX_Status_std.html]]></name>
   <type>generic_proc</type>
   <data><![CDATA[0]]></data>
    <description><![CDATA[Failed to execute verifyText]]></description>
   <tags>UX</tags>
   <module_group>UX</module_group>
</module>
<module>
   <name><![CDATA[UX_Time_std.html]]></name>
   <type>generic_data</type>
   <data><![CDATA[15.463]]></data>
    <description><![CDATA[Failed to execute verifyText]]></description>
   <tags>UX</tags>
   <module_group>UX</module_group>
   <module_parent>UX_Status_std.html</module_parent>
</module>
<module>
   <name><![CDATA[UX_Snapshot_std.html]]></name>
   <type>async_string</type>
   <data><![CDATA[data:image/png;base64, iVBORw0KGgoAAAANSUhEUgAA…JRU5ErkJggg==]]></data>
    <description><![CDATA[Image (last error)]]></description>
   <tags>UX</tags>
   <module_group>UX</module_group>
   <module_parent>UX_Status_std.html</module_parent>
</module>
If everything turned out to be a success, you may add the execution line to the Pandora FMS agent installed on the Windows machine as an agent plugin. The line to add to the agent configuration file will look like this (in a single line):
module_plugin C:\Users\artica\Documents\Product\UX-Trans\ux\pandora_ux_x64.exe -exe C:\PDR\pdr.bat -args -r -script C:\PDR\calc.sikuli -folder C:\PDR\ -ss_config active -checkpoint -post "taskkill /F /IM calc.exe"
As you can see, this run has a few more options. The -checkpoint parameter is used to show a screenshot of the result, even if there is no failure. -post will execute actions after the session playback is finished. In this case, the calculator process that started the recording is closed, to prevent the system from failing due to too many open windows or similar processes.
Now that the agent has the execution line module_plugin ready, it is launched in process mode, executing the following from the command line as administrator:
"%ProgramFiles%\pandora_agent\PandoraAgent.exe" --process
Obviously, the full path to the executable “PandoraAgent.exe” must be the one corresponding to the installation.
When launching it, the actions will be executed automatically according to the recording. From that point onwards the agent process should not be closed, and you should not log in the machine through remote desktop, or the executions could be interrupted. The machine must be left unhandled, that is why its use is recommended in virtual machines.
If you already have automation tests, they can be included in Pandora FMS with the following execution.
pandora_ux.64 -exe <exe of the automation system> -args <system arguments> -script <test file path>
<exe of the automation system>: exe (executable) of the automation system.<system arguments>: System arguments.<test file path>: Test file path.
Transaction-based execution
If you have recorded different processes with PDR and you have checked they work by playing them continuously, run:
C:\Users\artica\Documents\Product\UX-Trans\ux\pandora_ux_x64.exe -exe C:\PDR\pdr.cmd -args -r -t calculadora_trans -script C:\PDR\calc.sikuli,C:\PDR\savecalc.sikuli,C:\PDR\savefile.sikuli -folder C:\PDR\ -ss_config active
As it can be seen, just indicate the path of the new script in the -script parameter separated by a comma from the previous script and use the -t parameter with the name of the transaction that will include the different phases . If the process had more phases, the same logic would be followed, for example:
pandora_ux_x64.exe -exe C:\PDR\pdr.cmd -args -r -t proceso_transaccional -script C:\PDR\script1,C:\PDR\script2,C:\PDR\script3,C:\PDR\script4 -folder C:\PDR\ -ss_config active
The line to add to the agent configuration file, in this case, is the following:
module_plugin C:\Users\artica\Documents\Product\UX-Trans\ux\pandora_ux_x64.exe -exe C:\PDR\pdr.cmd -args -r -t calculadora_trans -script C:\PDR\calc.sikuli,C:\PDR\savecalc.sikuli,C:\PDR\savefile.sikuli -folder C:\PDR\ -ss_config active -checkpoint -post "taskkill /F /IM calc.exe"
Thanks to the -checkpoint parameter, you may see screenshots of the result of each phase in the Pandora FMS console.
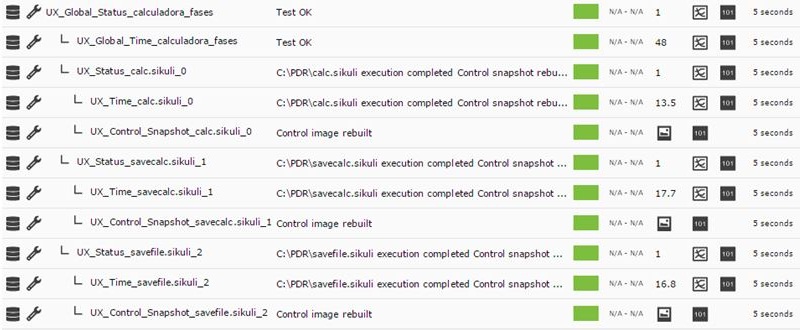
The following modules will be returned by stage:
- UX_Time_project_name.phase_order
- UX_Status_project_name.phase_order
If there is any phase with an error, the following module will also be created:
- UX_Snapshot_project_name.phase_order
It will also display an image of the web at the time of the failure, should it take place.
The global summary modules identified with the following names will also be returned:
- UX_Global_Time_project_name
- UX_Global_Status_project_name
- UX_Global_Snapshot_project_name
When the agent is running in process mode and the modules are recovered by Pandora FMS you will see them in the console. Again, through the view in “hierarchical mode” you can clearly show the relationship between the modules shown, clearly defining the different phases:
And in the transaction viewer, you can see the detail of the phases and the graph with the times:
The error traps will only be shown when the UX client (PWR) and the PWR server are running on the same machine. Otherwise, the directory for image delivery by the PWR server must be accessible by the client in order to display the image in Pandora FMS.
It will be on these modules where you may create alerts and see the history to build graphs and show the evolution of your systems over time.
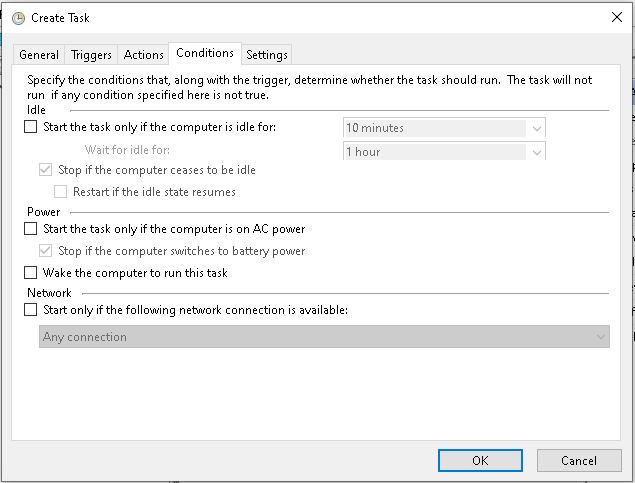
It is recommended to create a scheduled task that starts the Pandora FMS agent in process mode when the computer starts. This will not interrupt executions even if the system is forcefully restarted and if it is in automatic login mode without password, the agent will always be run even if the machine is restarted.
That way you will ensure the Pandora FMS agent will always be running in process mode in this Windows system, even when the machine is restarted, being able to always send the information collected by the PDR probe.
Systems with multiple desktops can be troublesome, so it is always recommended to use the configuration described above, on a desktop-mode machine with auto-login and a single desktop.


 Home
Home


