Network traffic monitoring with NetFlow and sFlow
Introduction to real time network analysis
Pandora FMS uses a tool to analyze the network in real time: NetFlow® and sFlow®. It uses the principle of “listening” over Ethernet continuously and analyzing the traffic to generate statistics.
In order to intercept network traffic and analyze it, it is necessary to have physical access to the network, since the network capture point must be the most appropriate one. To capture such data, traffic must be redirected from one switch port to another port using a port-mirror. Not all network devices allow this (only mid-range/high-end devices). It is also possible to port-mirror some commercial firewalls. It is the simplest way to intercept traffic and does not require additional hardware. By sending all traffic to a port, that port is connected directly to the network analyzer (probe).
These high-end switches and/or firewalls make monitoring easier. This is because these devices send the statistical information of the network flow directly to Pandora FMS collector without the need to use an independent probe. The hardware features should be consulted to find out if it can enable NetFlow and/or sFlow and send the flows to an independent collector (in this case, the Pandora FMS collector).
NetFlow network monitoring
Pandora FMS is able to monitor IP traffic using the NetFlow protocol.
NetFlow® is a network protocol, developed by Cisco Systems® and is currently supported on several platforms in addition to Cisco IOS® and NXOS®, such as devices from manufacturers like Juniper®, Enterasys Switches®, and operating systems like Linux®, FreeBSD®, NetBSD® and OpenBSD®.
NetFlow protocol
NetFlow enabled devices, when they activate this feature, generate “netflow records” consisting of small pieces of information that they send to a central device (a NetFlow server or collector), which receives information from the devices (NetFlow probes) for storage and processing.
This information is transmitted via the NetFlow protocol, based on UDP or SCTP. Each NetFlow record is a small packet containing a minimum amount of information, but in no case does it contain the raw traffic data. In other words, it does not send the payload of the traffic flowing through the collector, only the statistical data.
The traditional Cisco definition is to use a 7-element key:
- Source IP address.
- Destination IP address.
- Source UDP or TCP port.
- Destination UDP or TCP port.
- IP protocol.
- Interface (SNMP ifIndex)
- IP service type
Over time, manufacturers have designed equivalent systems for their network devices, with different names but similar purpose:
- Jflow or cflowd from Juniper Networks®.
- NetStream from 3Com/H3C|HP®.
- NetStream from Huawei®.
- Cflowd from Alcatel Lucent®.
- Ericsson® Rflow®.
- AppFlow®.
- sFlow®.
NetFlow Collector
A NetFlow collector is a device (a PC or a Server), embedded in a network to gather all NetFlow information which is sent by routers and switches.
NetFlow generates and collects that information, but if it needs a software that allows to store and analyze said traffic. Pandora FMS uses a specific server for this purpose, that will be started and shut down when Pandora FMS starts. That server's name is nfcapd and it is necessary to install it to be able to use NetFlow monitoring.
NetFlow Probe
The probes (for example in Raspberry) are generally routers with NetFlow enabled, configured, and sending information to the NetFlow collector (which in this case will be Pandora FMS server with the nfcapd daemon enabled).
Installation and requirements
Pandora FMS uses an open-source tool called nfcapd (that belongs to the nfdump package) to process all NetFlow traffic. This daemon is automatically started by Pandora FMS Server. This system stores data in binary files at a specific location. You must install nfcapd on your system before working with NetFlow in Pandora FMS.
Daemon nfcapd listens on port 9995/UDP by default, so keep it in mind if you have firewalls to open this port and when configuring NetFlow probes.
nfcapd installation
Install nfcapd manually, because Pandora FMS will not install it by default. For more information on how to install it, visit the Official NFCAPD Project Page.
Pandora FMS uses the directory “/var/spool/pandora/data_in/netflow” by default to process information, so when it is started nfcapd will use that directory. Avoid changing this location path, unless it is strictly necessary and you are fully aware of it.
Install nfdump version 1.6.8p1 to use it with Pandora FMS.
If you want to check that nfcapd is correctly installed, run the following command to start the foreground process:
nfcapd -l /var/spool/pandora/data_in/netflow
If everything works, you should see an output similar to this one:
 Add extension: 2 byte input/output interface index
 Add extension: 4 byte input/output interface index
 Add extension: 2 byte src/dst AS number
 Add extension: 4 byte src/dst AS number
 Add extension: 4 byte output bytes
 Add extension: 8 byte output bytes
 Add extension: NSEL Common block
 Add extension: NSEL xlate ports
 Add extension: NSEL xlate IPv4 addr
 Add extension: NSEL xlate IPv6 addr
 Add extension: NSEL ACL ingress/egress acl ID
 Add extension: NSEL username
 Add extension: NSEL max username
 Add extension: NEL Common block
 Bound to IPv4 host/IP: any, Port: 9995
 Startup.
 Init IPFIX: Max number of IPFIX tags: 62
Keep in mind that Pandora FMS Console (and more specifically the web server that runs it) must have access to those data. In this example they are located at:
/var/spool/pandora/data_in/netflow
Probe Installation
If a NetFlow-enabled router is not available, but you use a Linux server to route your traffic, you may install a NetFlow software to work as a probe and sends all NetFlow-related information to the collector.
Installing fprobe
fprobe captures traffic and sends it to a NetFlow Server. You may generate NetFlow traffic with it, among all the traffic that goes through its interfaces.
To download the RPM package just run the following command, and then install it:
wget http://repo.iotti.biz/CentOS/7/x86_64/fprobe-1.1-2.el7.lux.x86_64.rpm
yum install fprobe-1.1-2.el7.lux.x86_64.rpm
For instance, executing this command, all eth0 interface traffic will be sent to the NetFlow collector listening on port 9995 of the IP address 192.168.70.185:
/usr/sbin/fprobe -i eth0 192.168.70.185:9995
Once the traffic has been generated, you may see its statistics in the NetFlow collector by entering this command:
nfdump -R /var/spool/pandora/data_in/netflow
Installing pmacct
Experimental.
Among many features of the pmacct probe there is the ability to work with NetFlow v1/v5/v7/v8/v9, sFlow v2/v4/v5 over IPv4 and IPv6.
The source code is hosted at:
Rocky Linux 8
Install dependencies with administrator rights:
dnf config-manager --set-enabled powertools
dnf groupinstall 'Development Tools'
dnf install libpcap libpcap-devel
Download pmacct source code (you may use curl instead of wget) and build it:
cd /tmp
wget -O pmacct-1.7.7.tar.gz "https://github.com/pmacct/pmacct/releases/download/v1.7.7/pmacct-1.7.7.tar.gz"
tar xvzf pmacct-1.7.7.tar.gz
cd pmacct-1.7.7
./autogen.sh
./configure
make && make install
Start pmacct as a NetFlow probe in daemon mode:
- Create pmacct config.
For instance, all eth0 interface traffic will be sent to the NetFlow collector listening on port 9995 of the IP address 192.168.70.185:
cat> pmacctd_probe.conf <<EOF
daemonize: true
pcap_interface: eth0
aggregate: src_host, dst_host, src_port, dst_port, proto, tos
plugins: nfprobe
nfprobe_receiver: 192.168.70.185:9995
nfprobe_version: 9
EOF
- Start pmacctd:
# pmacctd -f pmacctd_probe.conf
Working with NetFlow under Pandora FMS
Pandora FMS works along with NetFlow as an auxiliary system, that means it does not store NetFlow data in its database. Pandora FMS shows that information as reports on demand.
Pandora FMS works with NetFlow data by using filters, which are sets of rules that match certain traffic patterns. A rule can be as simple as 'all the traffic from 192.168.70.0/24 network' or a complex pcap filter expression.
Once filters are created, define reports that determine how the information matched by those filters will be displayed (e.g. charts and tables) and the time frame. When defining filters and reports, set that information so that it can be accessed on demand similar to Pandora FMS reports. NetFlow reports appear as “report type” in Pandora FMS custom report section, to be able to add them to Pandora FMS “normal” reports.
There is also a real-time console view to analyze the traffic, creating rules on the spot. It can be very useful to investigate problems or temporarily display charts that do not match a specific filter.
Configuration
Access speed to the hard drive where NetFlow data are stored is usually the key factor for performance limits.
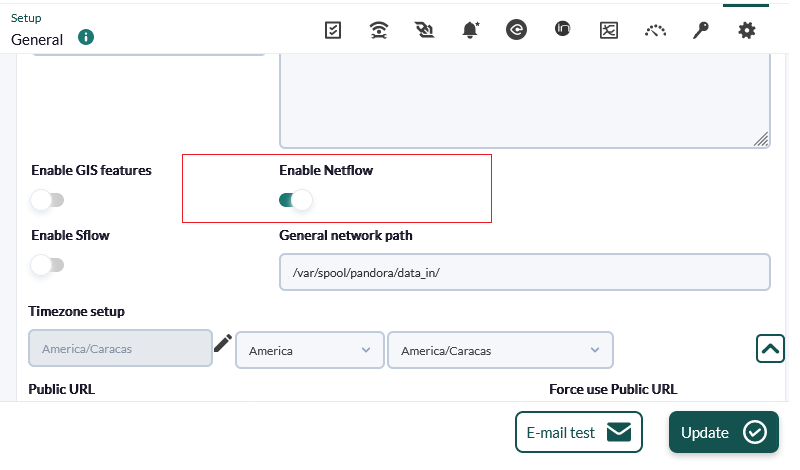
First of all, enable NetFlow so that it becomes accessible from the Operation and Administration menus. In the Configuration section (Management menu) there is an option for globally enabling or disabling NetFlow.
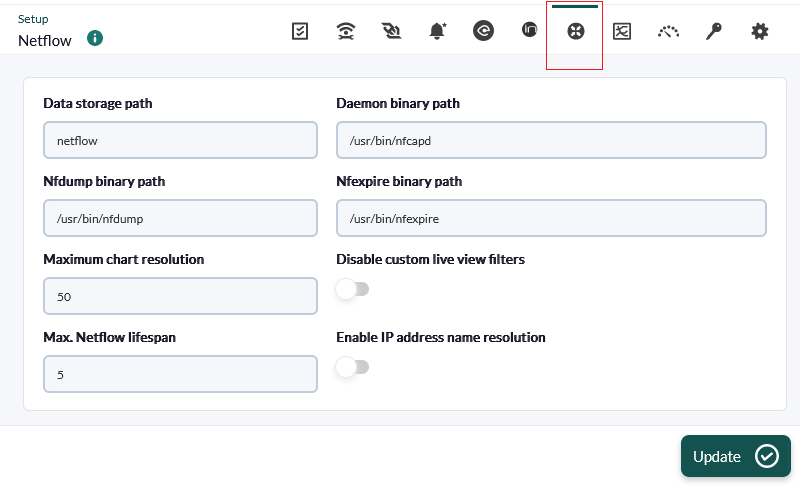
Once activated, a new NetFlow configuration option will appear in the setup section.
This section must be correctly configured so that the nfcapd daemon may be started together with Pandora FMS server:
- Data storage path: The directory where NetFlow data files are stored. Only the name of the directory should be entered, by default
netflow(see General Setup). - Daemon binary path: The path to the nfcapd binary.
- Nfdump binary path: The path to the nfdump binary.
- Nfexpire binary path: The path to the nfexpire binary.
- Maximum chart resolution: The maximum number of points displayed by a NetFlow area chart. The higher the resolution, the lower the performance. Values between '50' and '100' are recommended here.
- Disable custom live view filters: It disables defining custom filters from the NetFlow view (only for previously created filters).
- NetFlow max. lifespan: Maximum number of days NetFlow data will be stored before being deleted.
- Enable IP address name resolution: Il allows IP addresses resolution to try to retrieve the hostnames from NetFlow devices.
- Daemon interval: It allows you to set the NetFlow daemon time interval to 10, 30 or 60 minutes. After making a change and applying it in the time selector, it is necessary to restart the server for this change to take effect.
Once NetFlow is configured in the console, restart Pandora FMS Server so that it starts the nfcapd server. This server must be properly installed before trying to run it. Check server logs in case of doubt.
If you decide to store the NetFlow data on a device other than PFMS server (see nfcapd installation procedure and the distributed configuration) copy the binary file /usr/bin/nfexpire to that device and add the following entry in /etc/crontab:
0 * * * * root yes 2>/dev/null | /usr/bin/nfexpire -e "/var/spool/pandora/data_in/netflow" -t X_days d
Where x_days is the maximum number of days old of NetFlow data to be retained on that device (in this particular case PFMS Console configuration will have no effect for that field).
Filters
You may access filter creation and edition by clicking on Resources → NetFlow filters. This section contains a list of already created filters which can be modified or deleted.
You may also create a filter right away from the NetFlow live view, saving the active filter as a new one. NetFlow filters can be “basic” or “advanced”. The difference is that the former have fixed filtering fields (source IP, target IP, source port, target port) and the advanced ones are defined by the expression pcap (standard in filtering expressions for network traffic) and use all kinds of tools.
Enable NetFlow monitoring
![]() Version 770 or later.
Version 770 or later.
When creating the filter, filter monitoring can be activated by activating the token Enable NetFlow monitoring.
- This allows creating an agent that monitors the traffic volume of this filter.
- It creates a module that measures whether traffic from any IP address in this filter exceeds a certain threshold.
- A text module will be created with the traffic rate of each IP address within this filter every five minutes (the 10 most trafficked IP addresses).
The parameters are as follows:
- Maximum traffic value of the filter: Specifies the maximum rate (in bytes per second) of filter traffic. It is then used to calculate the percentage of maximum traffic per IP address.
- WARNING threshold for the maximum % of traffic for an IP: If any IP address within the filter exceeds the set percentage, a WARNING status will be generated.
- CRITICAL threshold for the maximum % of traffic for an IP: If any IP address within the filter exceeds the set percentage, a CRITICAL status will be generated.
Reports
NetFlow reports are integrated withPandora FMS reports.
To create a report item, choose one of the available NetFlow report items.
The following configuration options are available:
- Type: The element types will be explained below.
- Filter: NetFlow filter to be used.
- Period: Length of the data interval to be displayed.
- Resolution: Some reports require samples to be collected every certain period. This parameter is used to define the number of samples. The resolution can be low (6 samples), medium (12 samples), high (24 samples) or ultra-high (30 samples). There are two special values (hourly and daily) so that not a fixed value of samples is collected but one every certain period of hours or days.
- Max. values: Maximum number of items to aggregate. For example, if an HTTP traffic graph is aggregated by source IP address and Max. values is set to 5, only five IP addresses will be displayed.
There are three types of NetFlow reporting elements:
- NetFlow area chart: An area chart, aggregated or unsegregated.
- NetFlow data chart: A text representation of the area graph.
- NetFlow summary chart: Traffic summary for the given period. There are three elements: a table with global information, a pie chart with the most relevant IP addresses or ports and a table with the same information from the pie chart broken down.
NetFlow real time view
This view is used to check the history of captured data based on different search filters. Filters and different forms of information display can be used. The way of grouping the displayed information must be defined, as well as the way of obtaining such information in order to start displaying data.
Filters can be viewed in real time from Operation → Monitoring → Network → NetFlow Live View. This tool allows you to visualize the changes made to a filter and save it once the desired result is obtained. It is also possible to load and modify existing filters.
The way to obtain the information can be: source IP address, destination IP address, source port or destination port. If you choose, for example, to display the destination IP address information, the information will be displayed sorted by the IP addresses with the most traffic to the destination from highest to lowest. The same would be done to know the consumption of your network by protocol, choosing by destination port.
The possible ways of display are as follows:
- Area graph (Area stacked plots): They show over time (from the source date to the target date), the evolution of the data. The precision level of the graph must be chosen in the “Resolution” token.
- Circular mesh (Circular graph): It displays an interactive circular graph representing the pairs of connections between IP and traffic volume.
- Data table: It displays a data table with each IP and a number of rows depending on the chosen resolution.
- Detailed host trafic: It displays a map of portions representing the traffic per IP.
- Summary: It displays a summary table, a pie and a table with the data of the whole period.
- Top-N connections: A table showing the TOP-N connections between Source IP - Destination IP pairs, based on the traffic between those IP addresses (the sum of the percentages of the N elements of the table not necessarily will be one hundred because there may be other pairs of connections src/dst).
Network traffic maps
It allows you to create dynamic network maps, based on the traffic between nodes. It displays the relationship (connections) between different addresses, showing the N most important connections (by size of data transferred between them).
Distributed configuration
It is possible to locate the Pandora FMS node that collects NetFlow data on a host separate from the console. In environments with a lot of NetFlow data it is more than recommended to place it on a server with fast disks and a fast CPU of at least two cores. In order for Pandora FMS console to retrieve NetFlow data, it will be necessary to modify the default system configuration, following the steps described below:
- Configure automatic SSH authentication between the user who owns the web daemon and the user with the ability to run nfdump on the collector node.
For its configuration, follow these steps:
Enable the apache user login. In order to do this, modify the line of the apache user in the file /etc/passwd with this configuration:
apache:x:48:48:Apache:/var/www:/bin/bash
Create the .ssh directory inside the /var/www directory and give it the correct permissions:
 #mkdir /var/www/.ssh
 #chown apache:apache /var/www/.ssh
Create ssh keys from the apache user and copy them to the server where the NetFlow traffic is hosted.
#su apache
bash-4.2$ssh-keygen
Generating public/private rsa key pair.
Enter file in which to save the key (/var/www/.ssh/id_rsa):
Enter passphrase (empty for no passphrase):
Enter same passphrase again:
Your identification has been saved in /var/www/.ssh/id_rsa.
Your public key has been saved in /var/www/.ssh/id_rsa.pub.
The key fingerprint is:
SHA256:vYvl5V00E4faa14zN08ARzGUQ9IfAQJnMzkaqLAGRHI apache@<server>
The key's randomart image is:
+---[RSA 2048]----+
|+oE     ...*o=B+.|
|.o .   . .oo+o++ |
|  . o .   o o o+o|
|   o .   o   =  +|
|  .     S . . oo.|
|           .   +o|
|          o . o+=|
|         + + + +*|
|        . o . o .|
+----[SHA256]-----+
bash-4.2$ ssh-copy-id root@<netflow_server>
Once shared, it must be verified that it is possible to access the server through the apache user without entering a password:
bash-4.2$ ssh usuario@<netflow_server>
- Create a script in Pandora FMS console that replaces
/usr/bin/nfdumpwith one similar to the following
#!/bin/bash
NFDUMP_PARAMS=$(sed 's/(\(.*\))/\"\(\1\)\"/' <<<"$@");

ssh usuario@<netflow_server> "/usr/bin/nfdump $NFDUMP_PARAMS"
Give the script execution permissions:
chmod 755 /usr/bin/nfdump
Try executing the script like this:
/usr/bin/nfdump -V
It should return something similar to:
nfdump: Version: 1.6.13
Network monitoring with sFlow
From Pandora FMS version 770 onwards, support for sFlow, a network protocol which is an industry standard in hardware manufacturing for data network traffic, is included.
The operation of sFlow in PFMS is similar to the one established with NetFlow. In case both protocols are active, the data will be grouped together; in any case they will always be displayed by accessing the Operation menu in the left sidebar, and then clicking on Network.
sFlow configuration
NG 775 version or later.
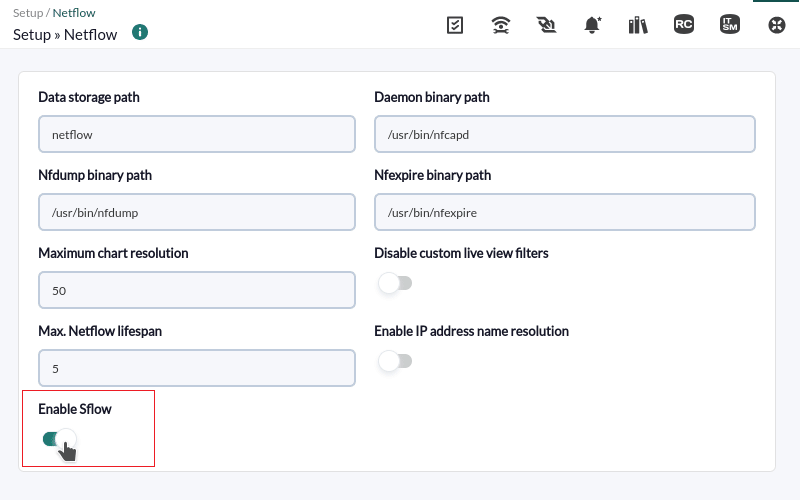
Enable sFlow to be accessible from the Operation and Management menus. Under the NetFlow configuration section, there is an option to enable or disable sFlow globally.
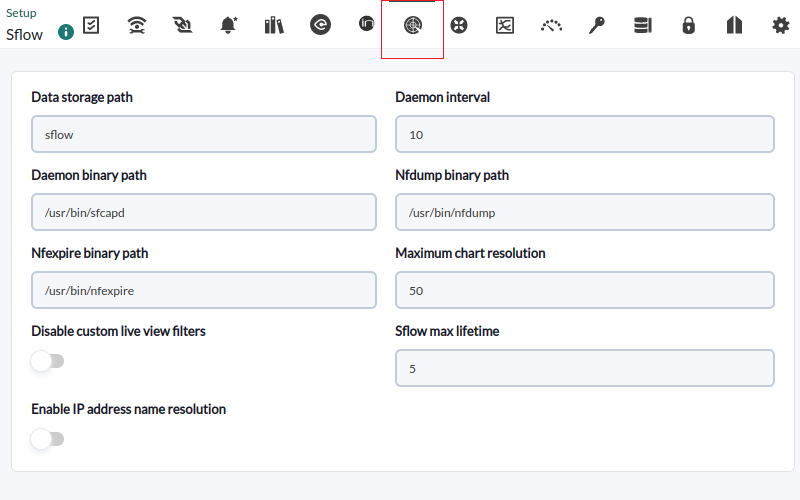
A new tab will be enabled specifically for sFlow:
- Data storage path: Directory where the sFlow data files are to be stored (see General Setup).
- Daemon binary path: Path to the nfcapd binary.
- Nfdump binary path: Path to the nfdump binary.
- Nfexpire binary path: Path to the nfexpire binary.
- Maximum chart resolution: Maximum number of points an sFlow area graph will display. The higher the resolution, the worse the performance. Values between 50 and 100 are recommended.
- Disable custom live view filters: It disables custom filter definition from the sFlow view (filters that are already created can still be used).
- sFlow max lifetime: It indicates the maximum time in days of sFlow data to be stored.
- Enable IP address name resolution: It enables IP address resolution to try to obtain the hostnames of sFlow devices.


 Home
Home


