Service monitoring
We are working on the translation of the Pandora FMS documentation. Sorry for any inconvenience.
Introduction
![]() A Service in Pandora FMS is a grouping of Information Technology resources (Information Technology, abbreviated IT) based on their functionalities.
A Service in Pandora FMS is a grouping of Information Technology resources (Information Technology, abbreviated IT) based on their functionalities.
PFMS Services are logical groupings that include hosts, routers, switches, firewalls, websites and even other Services. For example, the company's official website, Customer Relationship Management (CRM), a support application, or even all the printers in a company or home.
Services in Pandora FMS
The basic monitoring in Pandora FMS consists of collecting metrics from different sources, representing them as monitors (called Modules). Monitoring based on Services allows the previous elements to be grouped in such a way that, by establishing certain margins based on the accumulation of failures, groups of elements of different types and their relationship in a larger and general service can be monitored.
Service monitoring is represented under three concepts: simply, by their importance weights and chained by cascading events.
How Simple Mode Works
In this mode it is only necessary to indicate which elements are critical. Access Operation → Topology maps → Services → Service tree view → Create service.
Only elements marked as critical will be taken into account for calculations and only the critical status of said elements will have value.
- When between 0 and 50% of the critical elements are in the
criticalstate, the service will enter thewarningwarning state. - When more than 50% of the critical elements enter the
criticalstate, the service will enter thecriticalstate.
How services work based on your weight
A Service Tree must be defined in which both the elements that affect the application or applications and the degree to which they affect are indicated.
All elements added to the service trees will correspond to information that is already being monitored, whether in the form of modules, specific agents or other services.
To indicate the degree to which the states of each element affect the global state, a system of sum of weights will be used, so that the most important (with more weight) will be more relevant to adjust the global state of the service complete to an incorrect state before the less important elements (with less weight).
Root Services
A root Service is one that is not part of another Service. This provides more efficient distributed logic and allows applying a service-based cascade protection system.
The Services in Metaconsole allow adding other Services, Modules and/or Agents as elements of a Service.
Synchronous mode
The Prediction server follows a calculation chain in a hierarchical manner, from top to bottom, to obtain the state of each and every component of the root service. For services with up to a thousand elements, it is a satisfactory solution.
Asynchronous mode
By checking Asynchronous mode the service will be evaluated independently, at its own interval, even if it is part of another service, being an exception to the default synchronous behavior in which the evaluation is cascaded from the root service . An asynchronous service can be forced to run independently, even if it is part of a higher service (root service)
If a service that is part of another service (subservice) is marked as asynchronous at the time of evaluation of the root service, it will not execute the calculation of the state of the asynchronous service, but will take as valid the last value stored by it from the last time it was executed. This configuration can be of great help in evaluating elements in large services to improve their performance, in addition to allowing execution priority to be given to services that are elements of a root service.
Creating a new Service
Pandora FMS Server
The component Prediction server must be enabled in order to use the Services.
It is necessary that the PredictionServer component is running and the Enterprise version of Pandora Server is installed.
Introduction
Once you have all the devices monitored, within each Service add all the modules, agents or subservices necessary to monitor the Service. To create a new Service, access Operation → Topology maps → Services → Service tree view → Create service.
Initial setup
- Agent to store data: The Service saves the data in Prediction Modules). It is necessary to introduce an agent to be the container for these modules, and at the same time it will also contain the alarms.
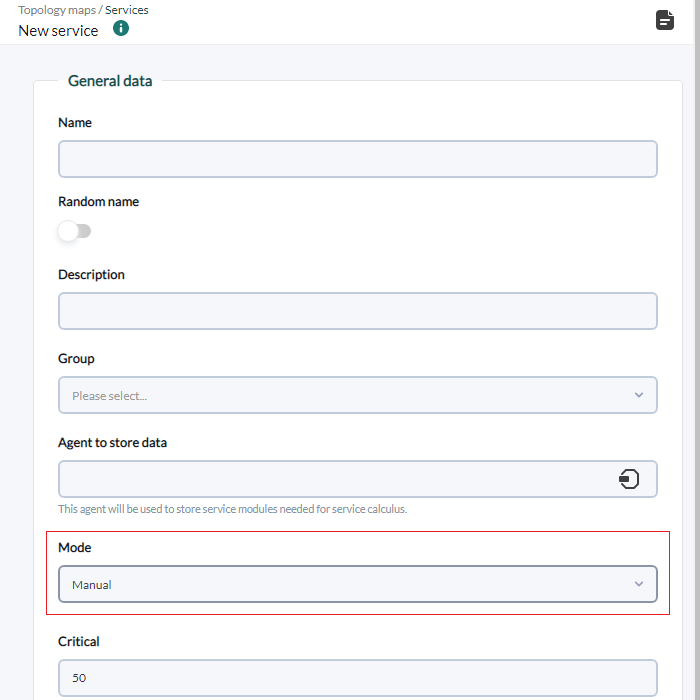
- Mode:
- Smart: The weights and elements that are part of the Service will be calculated automatically based on established rules.
- Manual: The weights and elements that are part of the Service will be indicated manually with fixed values.
- Critical: Weight threshold to declare the service as critical. In Smart mode this value will be a percentage.
- Warning: Weight threshold to declare the service as in warning state. In Smart mode this value will be a percentage.
- Unknown elements as critical: Allows you to indicate that elements in an unknown state contribute their weight as if they were a critical element.
- Asynchronous mode: By default the calculation of the states of each component is carried out synchronously. By activating this option, the calculation of the subordinate components will be carried out asynchronously.
- Cascade protection enabled: Activates cascade protection on the elements of the Service. These will not generate alerts or events if they belong to a Service (or subservice) that is in critical state.
- Calculate continuous SLA: Triggers the creation of Service Level Agreement (SLA) and SLA value modules for the current Service. It is used for cases where the number of Services required is so high that it can affect performance. If you deactivate this option after having created the Service, the historical data of these Modules will be deleted, so information will be lost.
- SLA interval: Time period to calculate the effective SLA of the service.
Note that the interval at which all service module calculations will be performed will depend on the interval of the agent configured as a container.
Item Settings
Once an empty Service has been created, access the Service editing form and select the Configuration elements tab. The Add element button is clicked and a pop-up window with a form will appear. The form will be slightly different if the service is in smart mode or manual mode. In Type you must select module, agent, service or dynamic.
If Service is chosen in Type, it must always be taken into account that the services that will appear in the drop-down list are those that are not ancestors of the service, this is necessary to show a correct structure dependency tree between services.
Manual Mode
To calculate the status of a service, the weight of each of its elements will be added based on its status, and if it exceeds the thresholds established in the service for warning or critical, the status of the service will become warning or critical as appropriate. .
The following fields will only be available for services in manual mode:
criticalwarningunknownnormal
Smart Mode
In services in Smart mode, their status is calculated as follows:
- Critical elements contribute their entire percentage to the weight of the service. This means that if, for example, we have 4 elements in the service and only 1 of them is critical, that element will add 25% to the weight of the service. If instead of 4 elements there were 5, the critical element would add 20% to the weight of the service.
- The elements in warning contribute half of their percentage to the weight of the service. This means that if, for example, we have 4 elements in the service and only 1 of them in warning, that element will add up to 12.5% to the weight of the service. If instead of 4 elements there were 5, the warning element would add 10% to the weight of the service.
Dynamic Mode
The following fields will only be available for elements of type Dynamic (Services in Smart mode):
- Matching object types: Drop-down list to choose whether the elements for which the dynamic rules will be evaluated, and which will be part of the service, will be Agents or Modules.
- Filter by group: Rule to indicate the group to which the element must belong to be part of the service.
- Having agent name: Rule to indicate the name of the Agent that the element must have to be part of the Service. A text will be indicated that must be part of the name of the desired Agent.
- Having module name: Rule to indicate the name of the Module that the element must have to be part of the Service. A text will be indicated that must be part of the name of the desired Module.
- Use regular selector expressions: If you activate this option, the search mechanism will be used using MySQL regex.
- Having custom field name: Rule to indicate the name of the custom field that the element must have to be part of the service. A text will be indicated that must be part of the name of the desired custom field.
- Having custom field value: Rule to indicate the value of the custom field that the element must have to be part of the service. A text will be indicated that must be part of the value of the desired custom field. It is possible to add searches in more custom fields with the Add custom field match button too.
You must place text in both fields for it to be considered for searching in custom fields.
Services Wizard
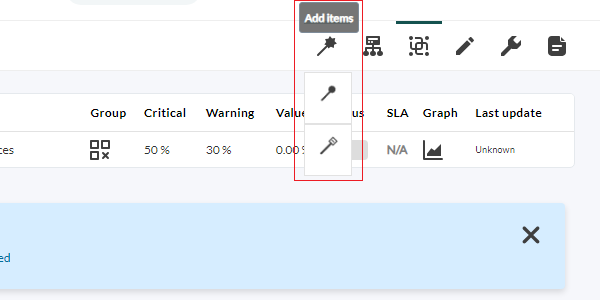
In the upper right tab, when creating or editing a service, the wizard for adding items appears with the following options:
- Add items: To add elements (agents, modules or services).
- Edit items: To edit elements.
- Delete items: To delete items.
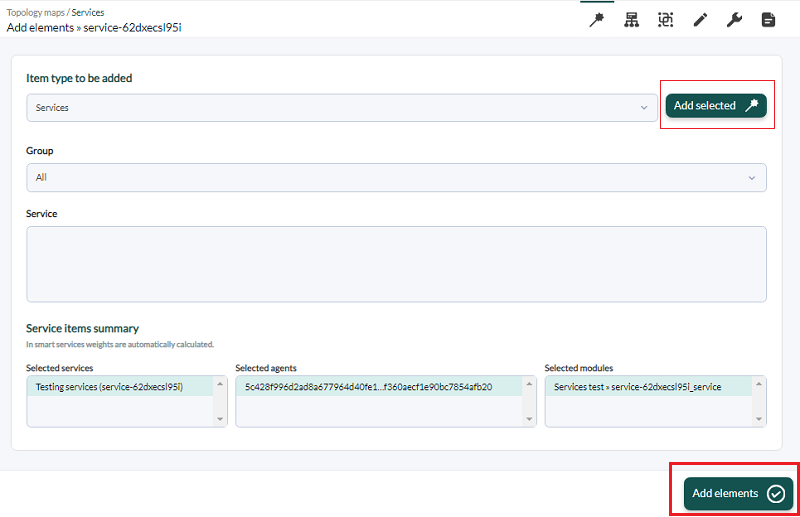
To add items, the wizard presents a drop-down list in Item type to be added and by default it presents the option to add agents to the service. To do this, you must click on Agents and immediately, right next to it, the available agents will be displayed by name. You can also type in that element (free search) and it will automatically display agent matches by name. If the list of agents is long, you can filter by groups in the drop-down list named Group.
For modules and services the selection process is similar, except that in the case of modules there is no free search for elements.
In the case of services you must always first filter by group so that the available services appear. Select the All group to see all services.
In all cases you must choose one or more elements and then press the Add selected button. Below, in Service items summary there will be a summary with the agents, modules and services added to the service.
Once you have selected the desired elements in Service items summary, click Add elements to add and save the new components to the service being edited.
Modules that are created when configuring a service
- SLA Value Service: It is the percentage value of SLA compliance (
async_data). - Service_SLA_Service: Shows whether the SLA is being met or not (
async_proc). - Service_Service: Shows the sum of the service weights (
async_data).
Viewing the Services
Simple list of all services
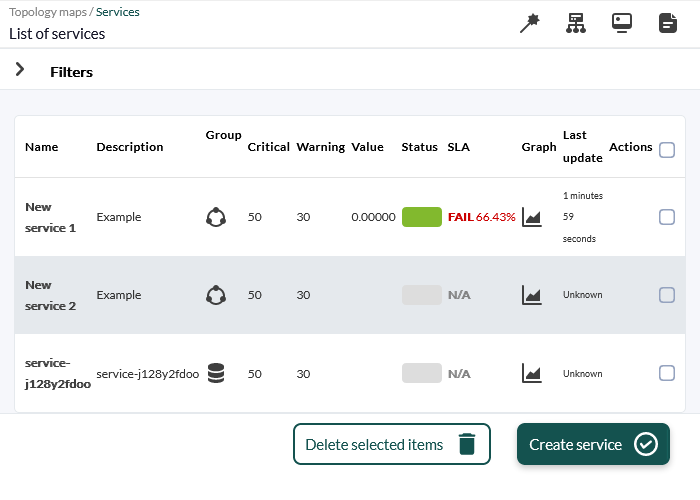
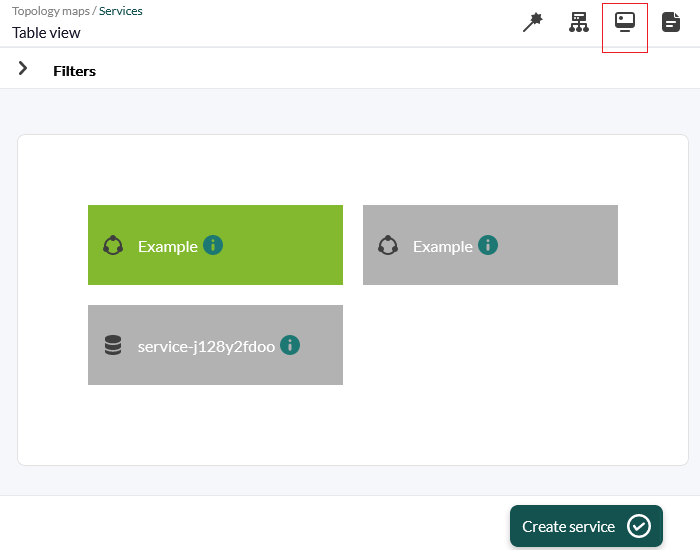
It is the operation list that shows all the services created and to which the user has access rights in the Pandora FMS Console. Click Operation → Topology map → Service tree view and inside this List of services.
Table of all services
Operations with elements
To add elements, there is a dialog box that allows you to select agents, modules or other services and clicking on each of them at the bottom will show the elements available to select and be added with Add selected. Once you have finished adding elements click the Add elements button to save the changes. For editing and deletion it works similarly.
- In cases of addition and editing, the service must be in Manual mode.
- See also “Massive operations: Services” to perform similar operations applied to services.
Tree view of services
This view allows the visualization of services in tree form. It is accessed through the menu Operation → Topology maps → Services → Service tree view.
The ACL permission restriction only applies to the first level.
How to interpret data from a service
Planned stops recalculate the value of SLA reports taking into account allowing recalculation “back in time” with planned stops added later (this is an option that must be activated globally in the General setup). When it comes to a service SLA report, if there is a planned stoppage that affects one or more elements of the service, the planned stoppage is considered to affect the entire service, as it is not possible to define the impact that the stoppage has on the service. overall service.
It is important to note that this is at the report level, the service trees, and the information they present in the visual console are not altered with respect to planned stops created after their supposed execution. These % service compliance values are calculated in real time based on historical data for the same service.
Weights are treated somewhat differently in simple mode as there is only the critical weight andhave the possibility of falling into two states apart from the normal one. Each element is given a weight of 1 in critical and 0 in the rest, and each time a change is made to the service elements, the service weights are recalculated. The warning weight of the service is negligible, it always has a value of 0.5 because if it is left at 0 the service will always be at a minimum in warning (but the warning weight is not used in the mode simple).
The critical weight is calculated so that it is half of the sum of the critical weights of the elements, which is 1. If there are 3 elements the critical weight of the service is 1.5 then the server is in charge of deciding if the critical weight has been exceeded or equaled to move the service to critical or warning status.
Service Cascade Protection
It is possible to silence those elements of a Service dynamically. This allows you to avoid an avalanche of alerts for each element that belongs to the Service or subservices.
When you enable the Cascade protection enabled feature, the action associated with the template that has been configured for the root service will be executed, thus reporting elements that have an incorrect state within the Service.
It is important to keep in mind that this system allows alerts to be used for elements that are going to be critical within the Service, even if its general status is correct.
Service cascade protection will accurately notify which root elements have failed regardless of the depth of the defined Service.
Root Cause Analysis
A macro called _rca_ is available which will indicate the root cause of the service state. To use it, it will be added to the template that has been associated with the service. This macro will return output similar to the following:
[Web Application → HW → Apache server 3]
[Web Application → HW → Apache server 4]
[Web Application → HW → Apache server 10]
[Web Application → DB Instances → MySQL_base_1]
[Web Application → DB Instances → MySQL_base_5]
[Web Application → Balancers → 192.168.10.139]
This example indicates that:
- Apache servers 3, 4 and 10 are in critical status.
- MySQL_base 1 and 5 databases are stopped.
- Balancer 192.168.10.139 is not responding.
This added information makes it possible to debug the reason for the service status, reducing investigation tasks.
Service groupings
Services are logical groupings that make up part of an organization's business structure. For this reason, the grouping of services may make some sense, since in many cases there may be dependencies between one another, for example forming a general service (the company) several more specific services (corporate website, communications, etc.).
To group services, it is necessary that both the general or higher service and the lower services that will be added to it be created to create the logical tree-shaped structure.


 Home
Home

