Monitoring of many machines quickly
We are working on the translation of the Pandora FMS documentation. Sorry for any inconvenience.
Introduction
This guide aims to show the user how to quickly and efficiently manage a large number of machines (5,10,50,500…) using the different features of Pandora FMS designed for this purpose. We will divide the document into four parts:
- Monitoring of network devices, using Recon Server and templates.
- Monitoring of SNMP network devices, using Recon Script SNMP.
- Agent monitoring, using policies.
- Remote monitoring with personalized scripts, using an agent generator via XML.
Monitoring of network devices, using Recon Server and templates
Situation
We have to monitor 200 servers, 20 switches and 10 routers, and we cannot go one by one configuring them. “General” monitoring is very simple, but we don't have much time or opportunity to install agents on the machines.
Solution
Pandora FMS will detect the systems and apply different templates depending on whether it is a switch, a router or a server. The templates will carry remote checks that can be applied as soon as the type of machine is detected.
How long will it take?
A class C network (255 hosts) is scanned in less than a minute with version 6.0. Applying a monitoring pattern to discovered machines is almost immediate, so you can have those 230 machines fully configured in less than ten minutes.
Step 1. Define monitoring profiles
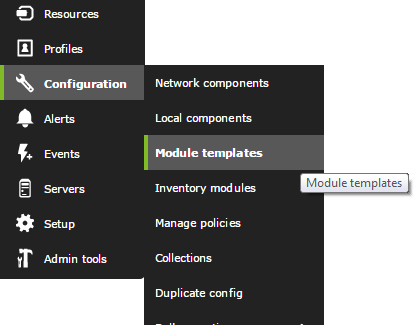
First we are going to define a monitoring template that in Pandora FMS is called “Module template”. To do this we go to the following menu:
Here we will see some already defined profiles, which contain some generic checks. We are going to edit one of them (Linux Server) which refers to a profile useful for monitoring generic Linux servers remotely.
As you can see in the screenshot above, this profile has some basic TCP checks, such as “Check SSH Server”, a basic ICMP check: “Host Alive” and various SNMP modules that make use of the Linux MIB, which are the rest of the checks.
These “template” checks are defined in the Pandora FMS basic module library, and contain generic module definitions.
The IP value does not exist in this module, because it will be auto-assigned from the agent's IP. The rest of the fields are “by default”, eg: thresholds, SNMP community, and will be applied to all agents that have a template with this module. If we want to customize it (for example: change the community) we will have to change it in the agents one by one or in a general way with the massive changes tool.
Now that we know what a monitoring template and a generic template module are, we can look at some of the other templates, specifically the WMI generic monitoring template and the basic monitoring template.
The first contains three WMI modules for Windows. These modules will have to be customized, editing the original component or the generated modules, since they require a username and password with permissions to make remote WMI queries.
The second one only contains a basic ICMP connectivity check, and we can add other basic checks as we see in the following screenshot:
Step 2. Use a network task with Recon Server
Now that we have three basic monitoring profiles: Linux, Windows and network.
Suppose we have to monitor all the computers in a set of networks, for example:
- 192.168.50.0/24 for servers.
- 192.168.50.0/24,192.168.1.0/24 for communications.
And we want it to identify all the machines on those networks and, depending on their OS, apply one template or another. Another way to do it, since the switches can be of various brands and models, is to “identify” them by means of a pattern based on whether or not they have an open port. For example: those machines with port 23 (telnet) open identify them as generic machines (switches, routers).
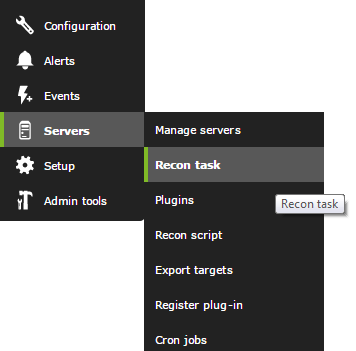
Let's go to the Recon Servers section to create a new one:
We are going to create one to search for and register Windows servers, applying the Windows machine monitoring pattern:
Here you can see how in the “OS” field (type of operating system), we have chosen Windows, so it will only apply this monitoring profile to those machines that are of the Windows type, and otherwise they will be ignored. Since the way to automatically detect the OS type is not 100% reliable (it depends on the services of the machine itself), another method could be chosen, such as specifying a specific port.
In that way, allThe machines with that port open would enter the application of the template. We see that example here, where we have created another task but using filtering by port instead of by OS to apply the generic network device monitoring template:
It is also important to note that to specify two networks, you have to separate them by commas: 192.168.50.0/24,192.168.1.0/24
Finally, I would configure the Linux one in a similar way, and when I finished defining the three groups it would look like this:
Once the recognition tasks are defined, they can start on their own, but we are going to see their status and force them if necessary. For that, we will click on the eye icon, to go to the Recon server operation view.
By default, the recognition server (recon_server) has one execution thread, so it will be able to execute only one task at a time, the rest will wait for the active exploration task to finish; however, this can be modified in the server configuration file (pandora_server.conf). We can force the scan tasks by clicking the round green icon to the left of the task.
This will cause the recon server to search for new machines that do not exist in active monitoring. If it finds them, it will automatically register them (trying to resolve the name, if we have activated that option) and assigning all the modules that were contained in the profile.
We must be aware that many of the modules assigned in a profile may not make sense or may not be correctly configured for a specific agent. In this agent, we have detected a Linux system correctly, but that server does not have SNMP, so all SNMP modules are not reporting. Since they couldn't get any data even the first time, they are in a mode known as the “Non-init state”. The next time the database maintenance script runs, they will be automatically removed:
Monitoring of SNMP network devices, using Recon Script SNMP
In this scenario, we consider the need to “automatically” monitor in depth an SNMP device with many interfaces, needing to obtain the status of each interface, the traffic in each port, the error rate, etc.
To do this, we will use a system known as Recon Script. It is a modular system that allows executing complex actions in a script. Pandora FMS has a script already created to detect this type of SNMP devices.
To do this, we create a network task, with the following form:
In the “first field”, we put the destination network or networks. In the “second field”, we put the SNMP community that we are going to use when exploring these devices. In the “third field”, we put some options parameters. In this case -n is for it to also register the down interfaces, since by default it only registers the active interfaces.
This script will register the interfaces that were not there before and are now active on each machine, in each execution. So if new interfaces are built they will be detected and added. Network tasks can be scheduled to run periodically, for example once a day.
This is what the Task Recon Script type task looks like once created:
And this is what the Task Recon Script type task looks like in execution:
Agent monitoring through policies
To massively manage the monitoring of computers with software agent installed we will use the policies.
First of all, we must have the software agents already installed and with the remote_config parameter enabled, since otherwise we will not be able to create execution modules:
remote_config 1
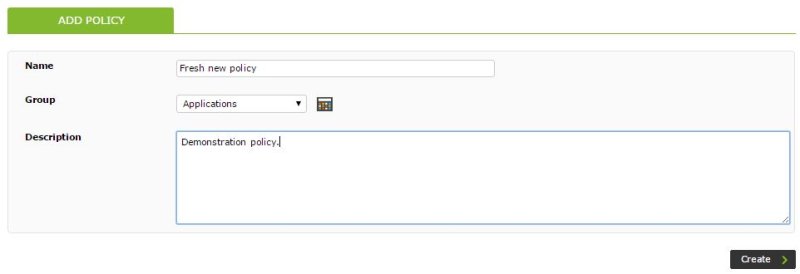
Next we will navigate to the Manage policies section, and we will proceed to create a new policy, completing some of the informative parameters such as name, group and description:
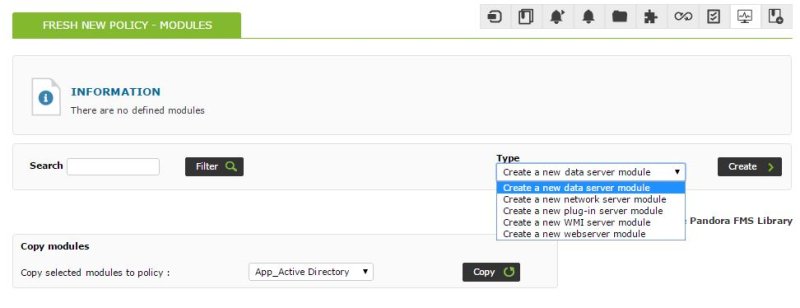
From here we can navigate to the module creation section within the policy, and create a new local module (dataserver module):
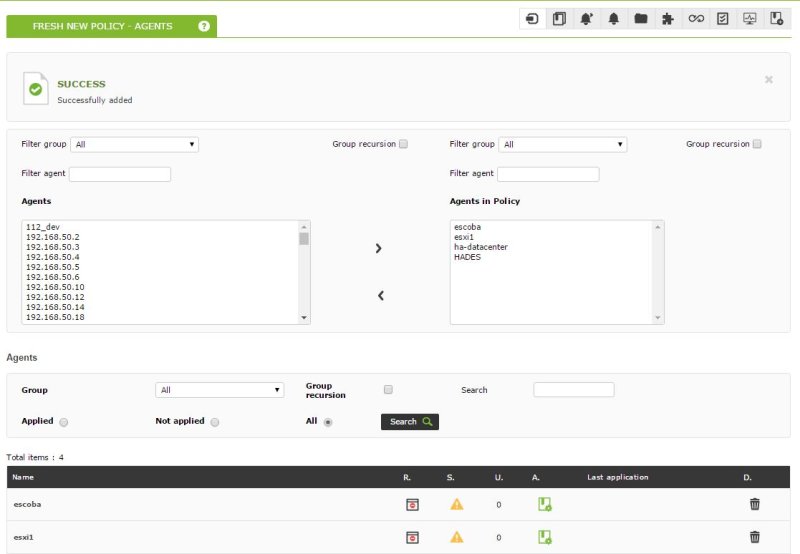
Once as many modules as we need have been created, which can be both local execution (dataserver module) and remote execution, we can proceed to include as many agents as we want in the policy. To do this we will navigate to the corresponding tab within our policy, and we will move agents to the “Agents included in the policy” section:
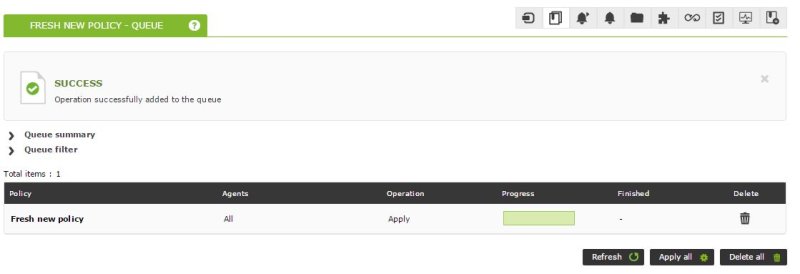
Once the agents are added, we must apply the changes made in the Queue section, apply all the changes and wait for the d bar to complete.and progress:
Once done, we already have all the modules created in the policy deployed to the chosen agents.
The policies allow us not only to add modules to groups of agents, they also allow us to include other types of elements such as alerts, file collections, plugins, etc. Furthermore, any modification we make to the policy, such as modifying the threshold of one of its modules, will be automatically inherited by all the agents included in the policy once it is applied.
Agent monitoring using custom scripts
This is an advanced way of monitoring large volumes of systems, similar to each other, in a completely “ad-hoc” way. For this, you have to have tools that already exist that give you information about your systems, some examples may be:
- Scripts that I already had that report information from remote systems.
- Other monitoring systems already running that generate data that can be reused.
- Small checks that are the same for a set of XXX machines but that do not return a single piece of data but several simultaneously. If they returned data one at a time, you could reuse them as plugins for the remote server.
The philosophy is simple: use a script to generate the XML headers of the agents, putting the agent name you want, and filling in the module data by an external script, which will be executed as an argument. This external script should generate correct data with the Pandora XML format (extremely simple!). The main script will close the XML and move it to the standard path for processing the XML data files (/var/spool/pandora/data_in). Schedule the script via CRON. You have more information about the XML format that Pandora FMS uses to report the data, see our technical appendices.
Remote Agent Script
You have a small script in /usr/share/pandora_server/util/pandora_remote_agent.sh that takes two parameters
  -a <agent name>
  -f <script file to execute>
Thus if you have a script such as /tmp/sample_remote.sh which contains the following:
#!/bin/bash

PING=`ping 192.168.50.1 -c 1 | grep "0% packet loss" | wc -l`

echo "<module>"
echo "<name>Status</name>"
echo "<type>generic_proc</type>"
echo "<data>$PING</data>"
echo "</module>"

ALIVE=`snmpget -Ot -v 1 -c artica06 192.168.70.100 DISMAN-EVENT-MIB::sysUpTimeInstance | awk '{ print $3>=8640000 }'`

echo "<module>"
echo "<name>Alive_More_than_24Hr</name>"
echo "<type>generic_proc</type>"
echo "<data>$ALIVE</data>"
echo "</module>"

# Another script with returns XML
EXT_FILE=/tmp/myscript.sh

if [ -e "$EXT_FILE" ]
then
$EXT_FILE
fi
You will be able to generate a complete XML with the agent name “agent_test” by running the remote agent script as follows:
/usr/share/pandora_server/util/pandora_remote_agent.sh -a agent_test -f /tmp/sample_remote.sh
Suppose you want to run the same script against XX machines, you would have to pass some data, such as username, IP, password to the same script:
/usr/share/pandora_server/util/pandora_remote_agent.sh -a agent_test -f "/tmp/sample_remote.sh 192.168.50.1"
You would have to parameterize the /tmp/sample_remote.sh script to take the command line parameters and use them properly.
Schedule the script via cron
Imagine you have 10 machines monitored like this:
/usr/share/pandora_server/util/pandora_remote_agent.sh -a agent_test1 -f "/tmp/sample_remote.sh 192.168.50.1"
/usr/share/pandora_server/util/pandora_remote_agent.sh -a agent_test2 -f "/tmp/sample_remote.sh 192.168.50.2"
/usr/share/pandora_server/util/pandora_remote_agent.sh -a agent_test3 -f "/tmp/sample_remote.sh 192.168.50.3"
/usr/share/pandora_server/util/pandora_remote_agent.sh -a agent_test4 -f "/tmp/sample_remote.sh 192.168.50.4"
/usr/share/pandora_server/util/pandora_remote_agent.sh -a agent_test5 -f "/tmp/sample_remote.sh 192.168.50.5"
/usr/share/pandora_server/util/pandora_remote_agent.sh -a agent_test6 -f "/tmp/sample_remote.sh 192.168.50.6"
/usr/share/pandora_server/util/pandora_remote_agent.sh -a agent_test7 -f "/tmp/sample_remote.sh 192.168.50.7"
/usr/share/pandora_server/util/pandora_remote_agent.sh -a agent_test8 -f "/tmp/sample_remote.sh 192.168.50.8"
/usr/share/pandora_server/util/pandora_remote_agent.sh -a agent_test9 -f "/tmp/sample_remote.sh 192.168.50.9"
/usr/share/pandora_server/util/pandora_remote_agent.sh -a agent_test10 -f "/tmp/sample_remote.sh 192.168.50.10"
Put all these lines in a new script, eg: “/tmp/my_remote_mon.sh” and give it execute permissions, and add the following line to root's crontab:
- */5 * * * * root /tmp/my_remote_mon.sh
This will cause that script to run on the system every 5 minutes. You can add machines to the script.
If you want to know more information about system monitorings, its advantages and the process to follow to carry out a correct monitoring consult our system monitoring article.


 Home
Home
