
Checking the information returned by the agent
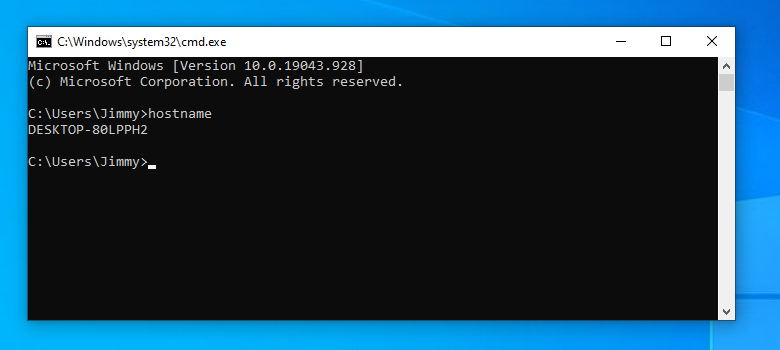
Once the MS Windows agent has been started® after its installation, it is time to check what this agent is reporting. To do this, you must know the name under which this agent is going to report. By default the agent is created with the name of the host. You can see the name of the host MS Windows® with the execution of the command hostname in a window with cmd.exe.
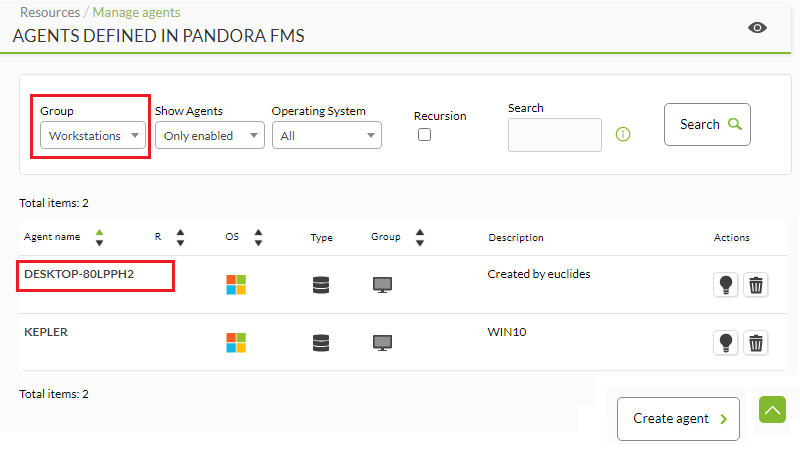
Once you know the agent name, the next step is to see if it has been created in Pandora FMS. To do this you have several options. The first one is to search in agent details, inside the group in which the agent has been created, in this example the group Workstations.
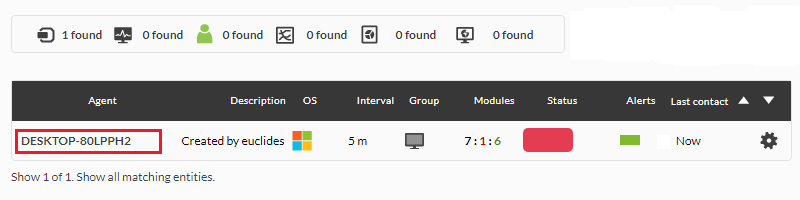
A faster and more efficient way to find the agent is to search directly through the Pandora FMS search engine, indicating the agent's name.

By default, the MS Windows® agent comes with several pre-loaded local basic monitoring modules, such as CPU load (CPU Load), % of RAM used (Memory_Used), free space in MB of disks (DiskUsed), etc.
If we need to add new modules to this agent, we can consult the advanced documentation of monitoring with EndPoints.
You can see graphs generated with the module's data history and a table with the data history from this view by clicking on the marked icons in the following screenshot:
