Interface Network Traffic
For that it is imperative for SNMP to be configured on the remote device. This usually needs to be enabled and with a minimum configuration that allows querying data. SNMP devices allow you to configure the IP addresses that can make queries and with which community, which for all intents and purposes is a kind of password.
First the agent from where you need to get the network traffic will be located; in this case it is 192.168.70.1. Following the same process (left side menu Operation → Monitoring → Views → Agent detail) you will get to the main view of the agent to be configured and you will click on the last tab on the right, which will take you to the editing view of that agent.
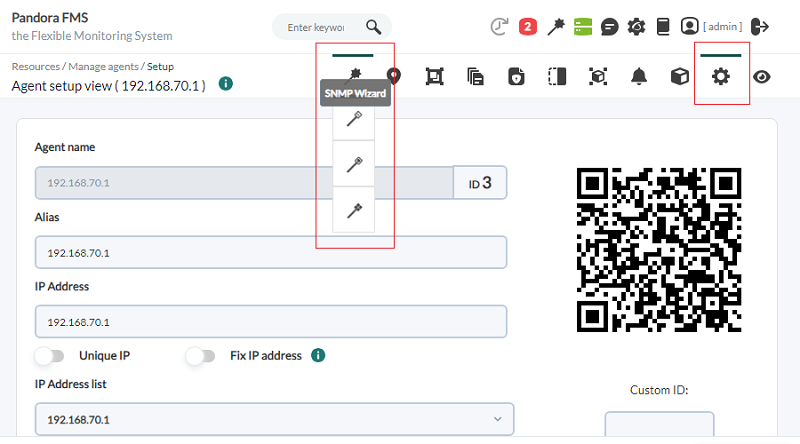
You will go to the main agent editing view. Here the configuration Wizards submenu for this agent will be displayed, where the wizard (SNMP Interface Wizard) will be chosen.
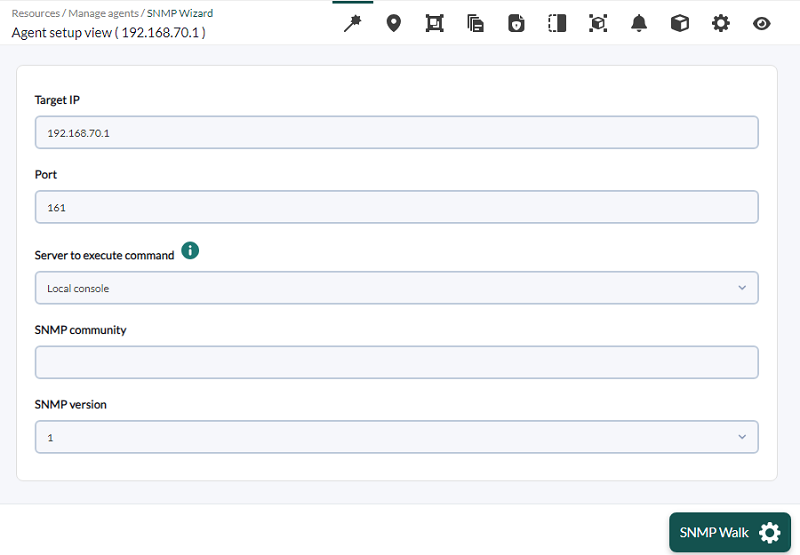
At this point you must provide the SNMP community that the equipment has configured, and make sure that the device supports SNMP queries enabled on the IP address shown on the screen. You may change the IP address and the default SNMP community, which is public. Once it is filled in, click on SNMP Walk. If everything works, it will show the interfaces and the data that can be obtained from them.
With CTRL+Click (or CMD+Click on MacOS®) you may select several items in both boxes. Always remember to monitor the outgoing traffic (ifOutOctets), the incoming traffic (ifInOctets) and the interface status (ifOperStatus) for each interface. Click Create modules and a screen will appear that should inform that the modules have been created.
Note that network traffic modules are incremental, i.e. their value is the difference between the information sample just collected and the previous one. It displays a "rate" (in this case in bytes per second), so it needs some time (between 5 and 10 minutes) before displaying any data.
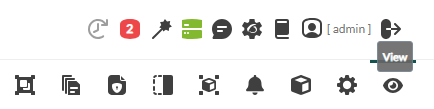
Click on the View tab to return to the agent view and wait at least 5 minutes until traffic data is already available by refreshing or clicking on the View tab.
After a while you should have the data of the traffic modules (input and output, separately) and a new section in the agent, which shows information of the interfaces with a direct access to an aggregated graph with the input and output traffic overlaid, if you click on the title where it says Interface information (SNMP).
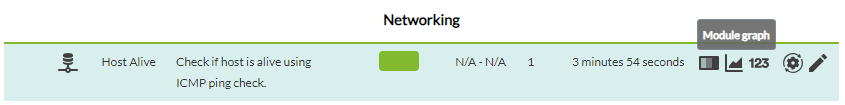
If you want to speed up the execution of the network modules, you may use the force remote check icon (it will not work with local modules, or those collected locally by a EndPoint). Depending on the server load, it may take between 2 and 15 seconds to run the network test.
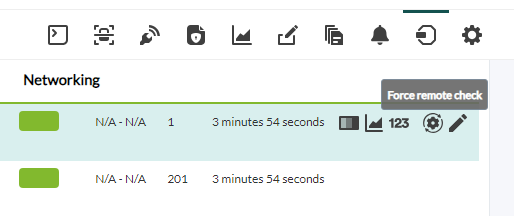
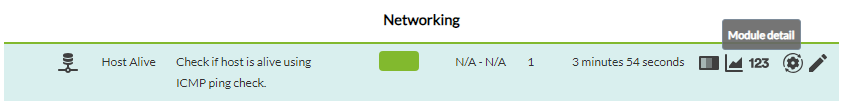
The traffic module information will look like this, and the graphs for each metric. By clicking on the Module graph icon, a window will be displayed with the graph for that monitor and by clicking on the Module detail icon, a table with the data will be shown.