
6. Network device monitoring through SNMP Interface Wizard
To perform this type of monitoring, it is essential that SNMP is configured on the remote device. This generally needs to be activated with a minimum configuration that allows data queries.
SNMP devices allow you to configure which IP addresses can perform queries and which community will be used for those queries.
Most network devices (routers, switches) have the community public by default.
For this monitoring, an agent will be created via the menu Management → Resources → Manage agents → Create agent, with the following configuration:
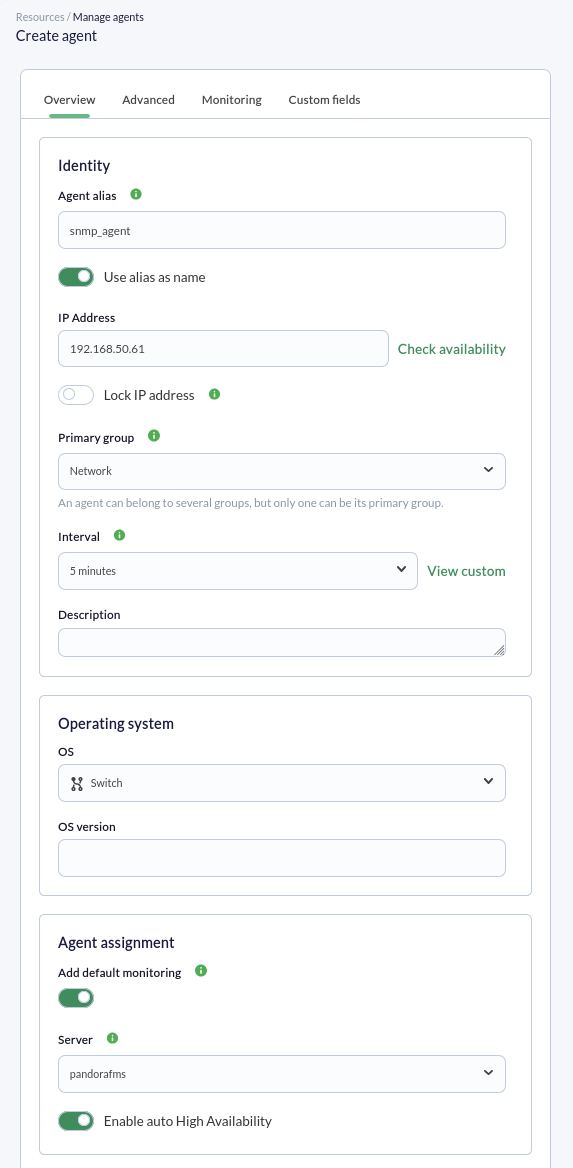
Important fields include IP Address, where the IP address of the remote SNMP device to be checked will be entered. Generally, this IP address is automatically used when modules are created, but you should always verify that this IP address has actually been used in each module. In the Add default monitoring field (active by default), we will see this feature in action: two modules will be created, one to verify connectivity—in this case with the switch—and the latency or connection time (speed). Click the Create button to save.
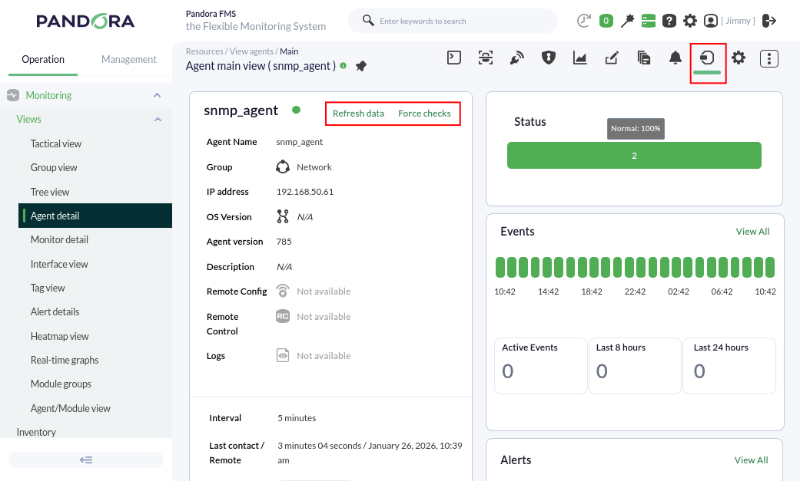
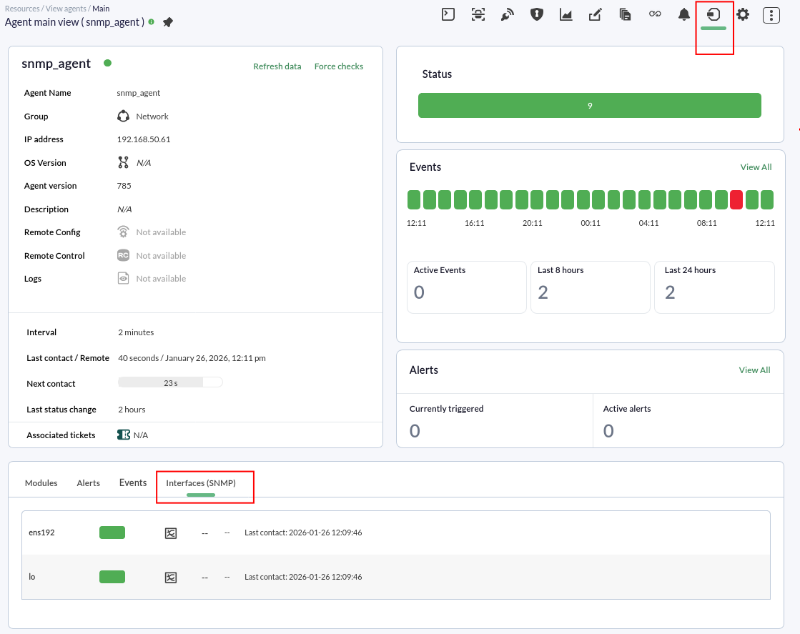
Once the agent is created, go to its main view (Main tab), and in a few moments, you will see if there is a connection to the device. If necessary, you can force the check and refresh the data (Force checks and Refresh data buttons):
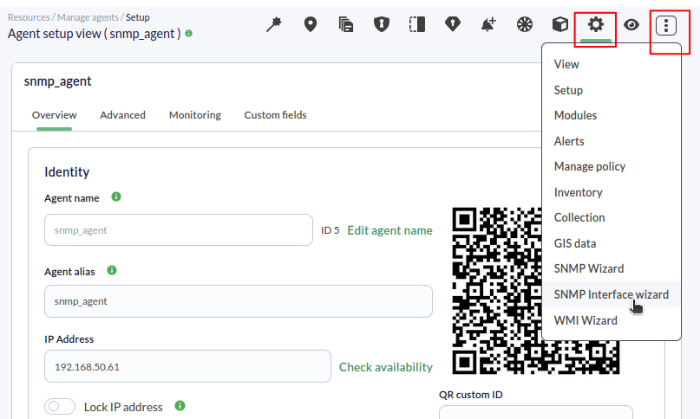
Now we will go to the Manage tab, which allows access via the drop-down menu to the SNMP interface wizard option (this option is also available in the first tab from left to right):
When accessing the SNMP wizard for network interfaces, the following dialog box will appear where the IP address (Target IP field) has already been inserted, brought from the agent's general data, and a previously stored SNMP credential has been selected (Import from credential store field):
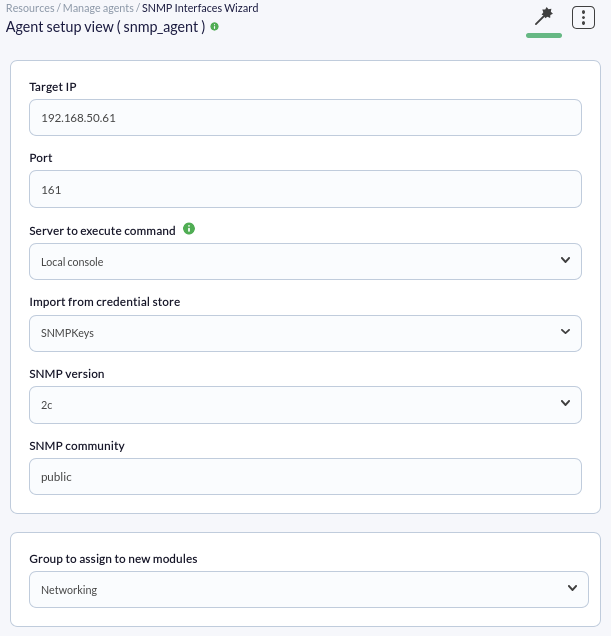
This stored credential also provides the SNMP version and its community. Finally, we select the Networking group to assign the new modules and click the SNMP walk button. This may take some time depending on the device's complexity; once the scan is complete, we will look at the box that allows adding general checks to the detected network interfaces.
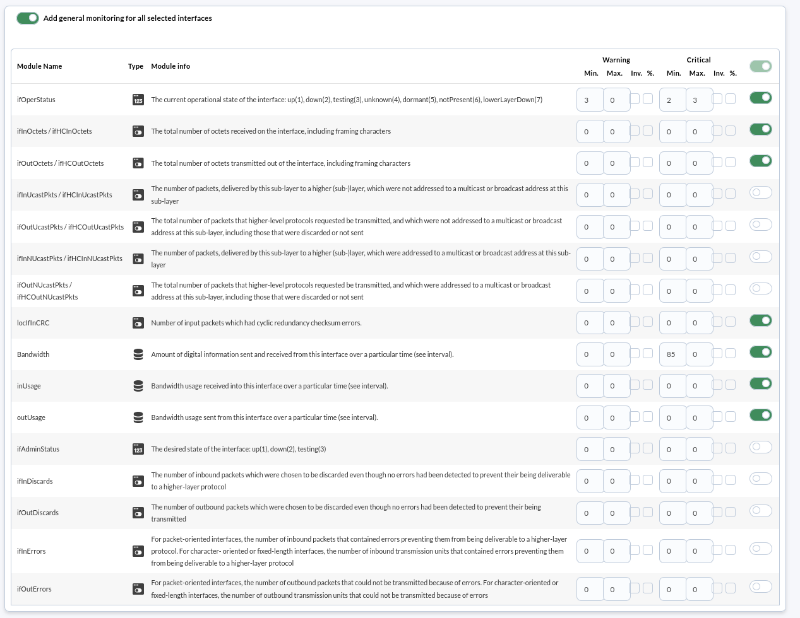
We will leave the values already checked and click the Create modules button, after which a dialog box with a summary of the modules will be presented:
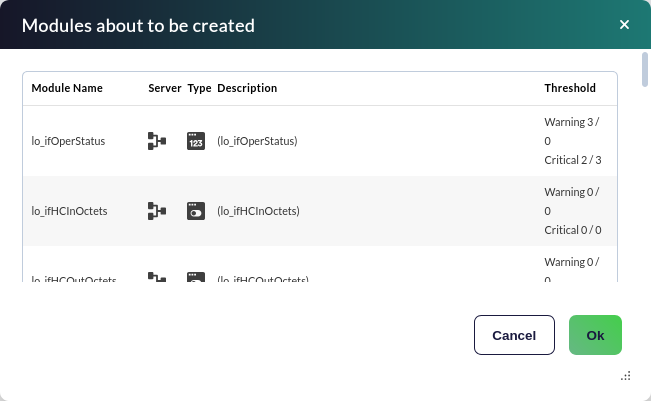
Upon clicking the Ok button, the modules will be created in the agent.
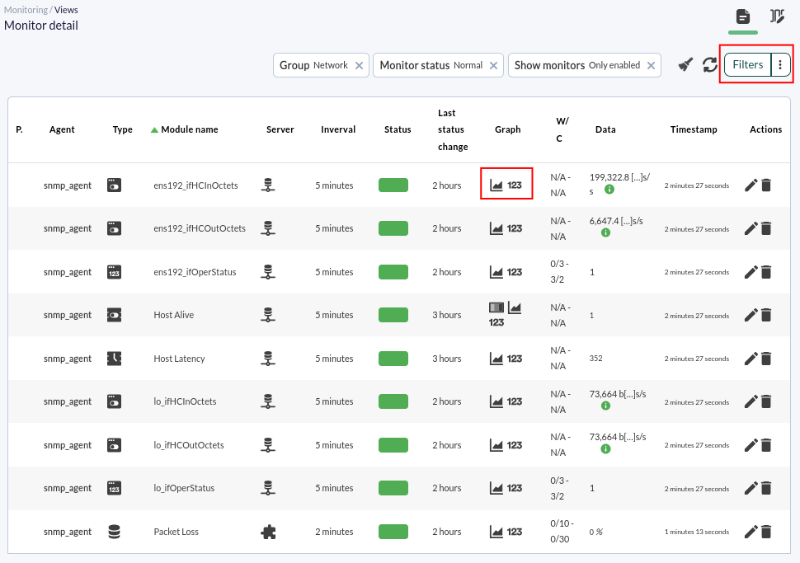
Network traffic modules are of the incremental type, meaning their value is the difference between the information sample just collected and the previous one. It shows a "rate" (in this case in bytes/sec), so it needs some time (between 1 or 2 agent intervals) before it can display consistent values.
Once monitored for a sufficient amount of time, go to the menu Operation → Monitoring → Views → Monitor detail and in Filters search for the agent group and the normal status:
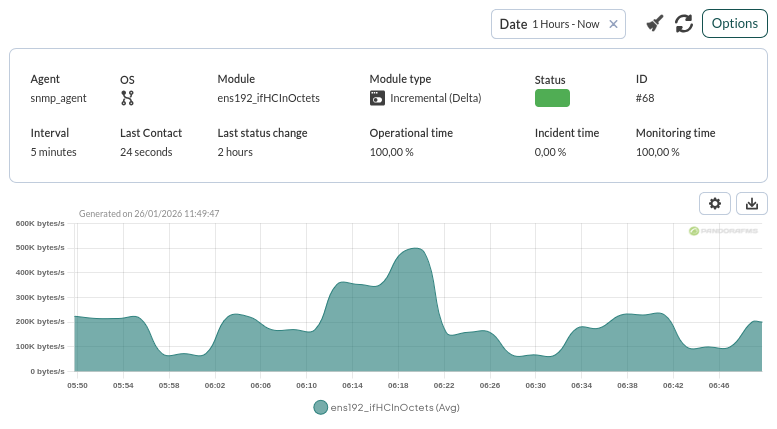
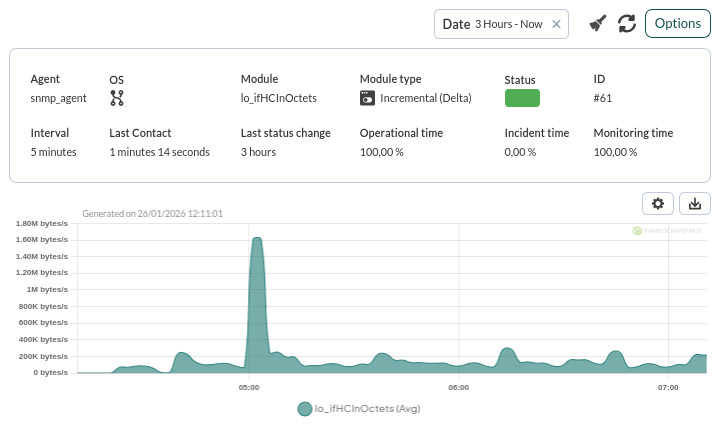
Let's look at a graph of just one of the individual metrics:
We can also use the Interface information (SNMP) view, located below the general agent view, to conveniently see the input/output traffic information for each interface:
By clicking on the graph icon of an interface ( ) you will see more details (in Options you can change the time period):
Are you not achieving the results explained in this chapter? Access the help or support section.