To perform this type of monitoring, it is essential that SNMP is configured on the remote device. This generally needs to be activated with a minimum configuration that allows data queries.
SNMP devices allow you to configure which IP addresses can perform queries and which *community* will be used for those queries.Most network devices (*routers*, *switches*) have the *community* `public` by default.
For this monitoring, an agent will be created via the menu **Management** **→ Resources → Manage agents → Create agent**, with the following configuration: [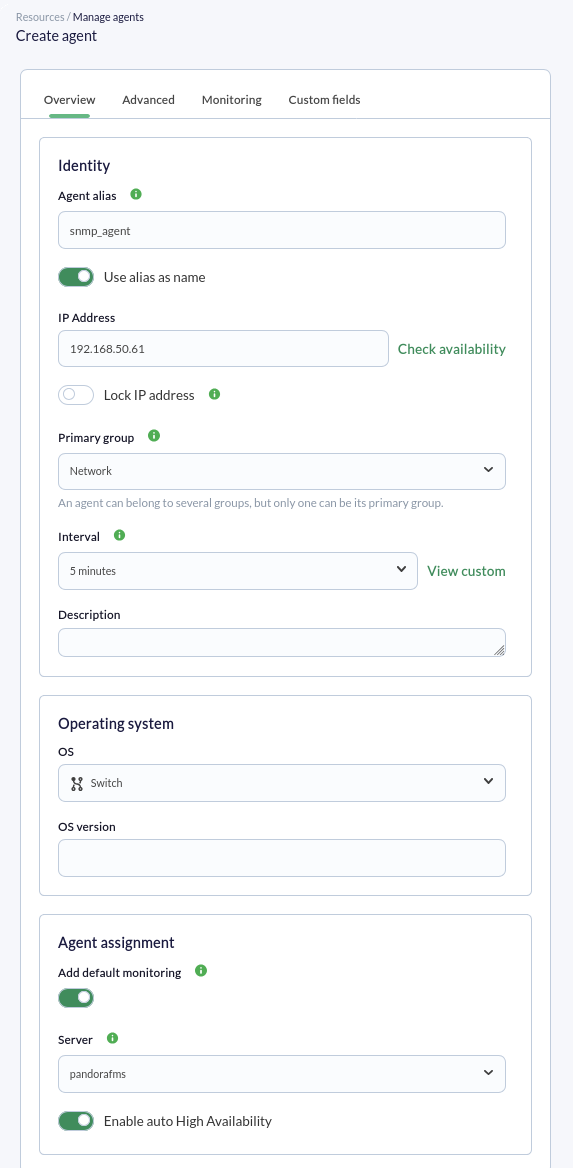](https://pandorafms.com/guides/public/uploads/images/gallery/2026-01/pfms-snmp-agent-image-010.png) Important fields include **IP Address**, where the IP address of the remote SNMP device to be checked will be entered. *Generally, this IP address is automatically used when modules are created*, but you should always verify that this IP address has actually been used in each module. In the **Add default monitoring** field (active by default), we will see this feature in action: two modules will be created, one to verify connectivity—in this case with the *switch*—and the latency or connection time (speed). Click the **Create** button to save. Once the agent is created, go to its main view (**Main** tab), and in a few moments, you will see if there is a connection to the device. If necessary, you can force the check and refresh the data (**Force checks** and **Refresh data** buttons): [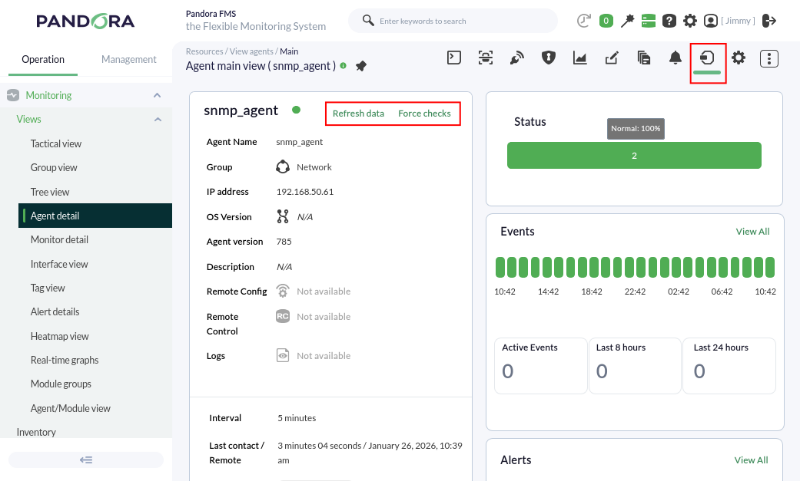](https://pandorafms.com/guides/public/uploads/images/gallery/2026-01/pfms-snmp-agent-image-020.png) Now we will go to the **Manage** tab, which allows access via the drop-down menu to the **SNMP interface wizard** option (this option is also available in the first tab from left to right): [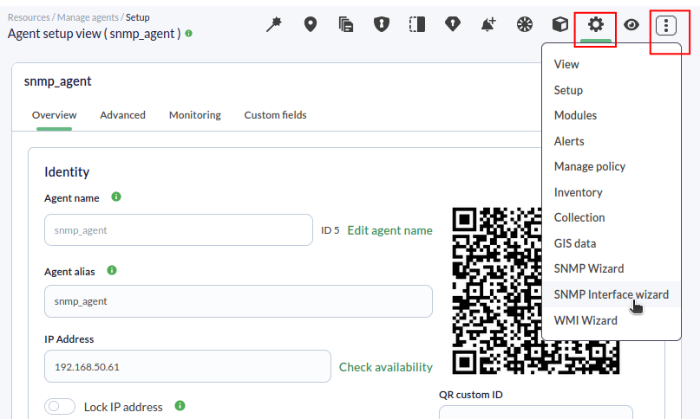](https://pandorafms.com/guides/public/uploads/images/gallery/2026-01/pfms-snmp-agent-image-030.png) When accessing the SNMP wizard for network interfaces, the following dialog box will appear where the IP address (**Target IP** field) has already been inserted, brought from the agent's general data, and a previously stored SNMP credential has been selected (**Import from credential store** field): [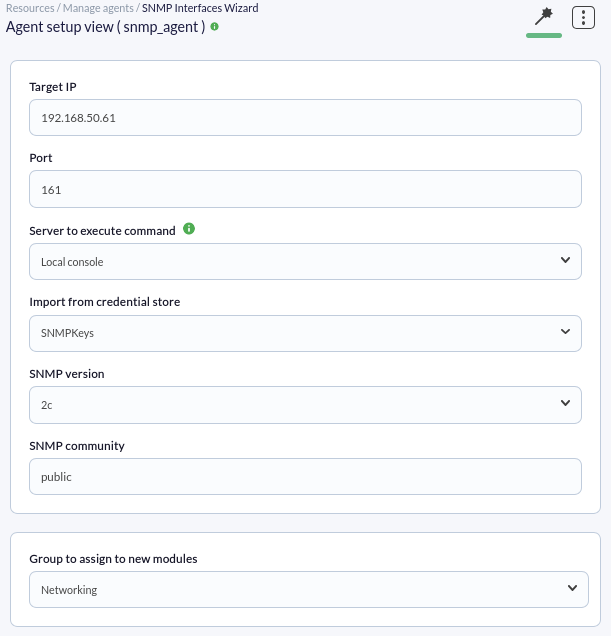](https://pandorafms.com/guides/public/uploads/images/gallery/2026-01/pfms-snmp-agent-image-040.png) This stored credential also provides the SNMP version and its *community*. Finally, we select the **Networking** group to assign the new modules and click the **SNMP walk** button. This may take some time depending on the device's complexity; once the scan is complete, we will look at the box that allows adding general checks to the detected network interfaces. [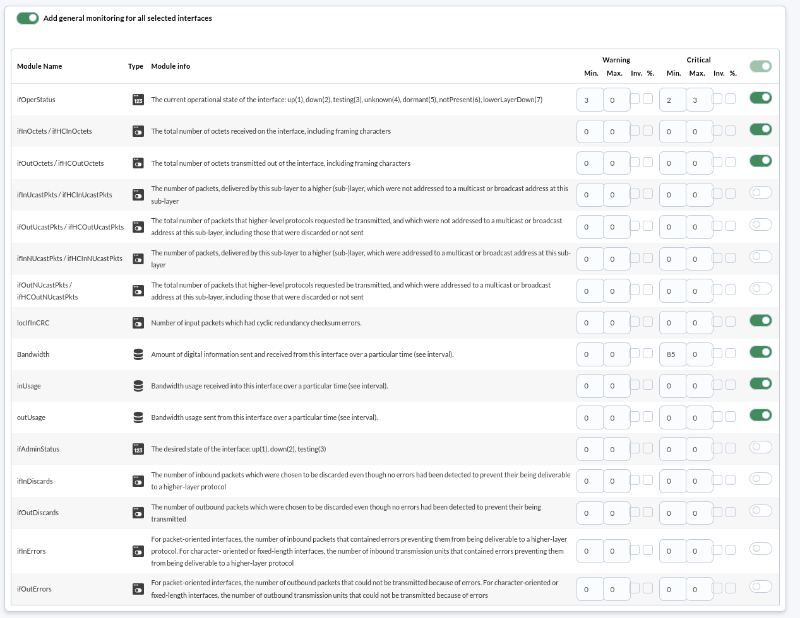](https://pandorafms.com/guides/public/uploads/images/gallery/2026-01/pfms-snmp-agent-image-050.png) We will leave the values already checked and click the **Create modules** button, after which a dialog box with a summary of the modules will be presented: [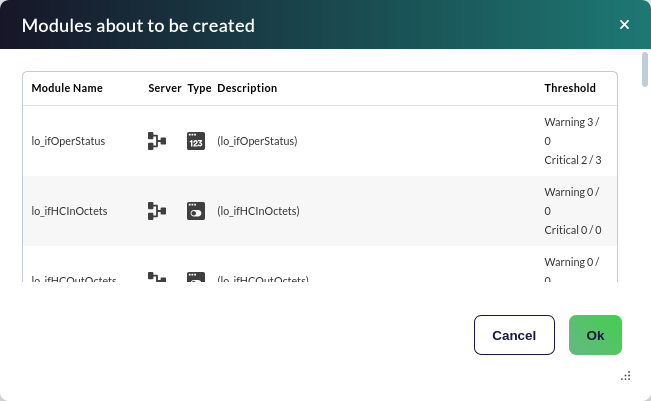](https://pandorafms.com/guides/public/uploads/images/gallery/2026-01/pfms-snmp-agent-image-060.png) Upon clicking the **Ok** button, the modules will be created in the agent.Network traffic modules are of the *incremental* type, meaning their value is the difference between the information sample just collected and the previous one. It shows a "rate" (in this case in bytes/sec), **so it needs some time (between 1 or 2 agent intervals)** before it can display consistent values.
Once monitored for a sufficient amount of time, go to the menu **Operation → Monitoring → Views → Monitor detail** and in **Filters** search for the agent group and the normal status: [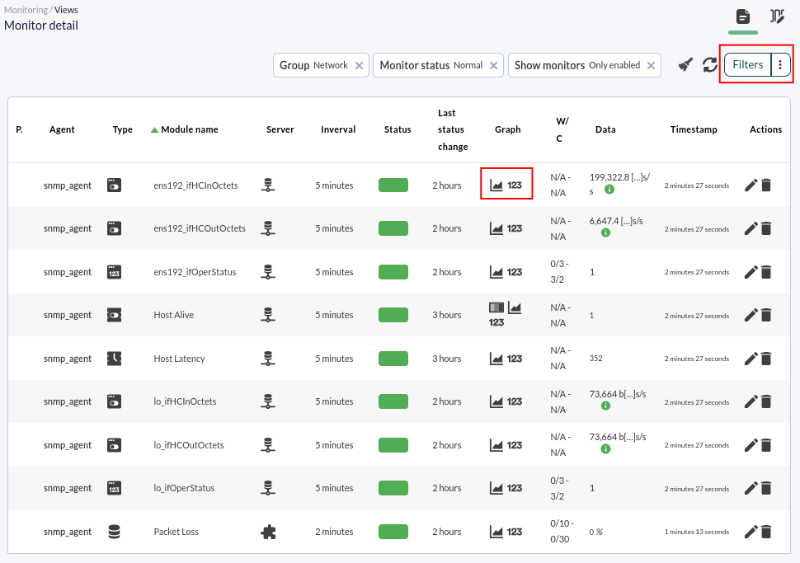](https://pandorafms.com/guides/public/uploads/images/gallery/2026-01/pfms-snmp-agent-image-070.png) Let's look at a graph of just one of the individual metrics: [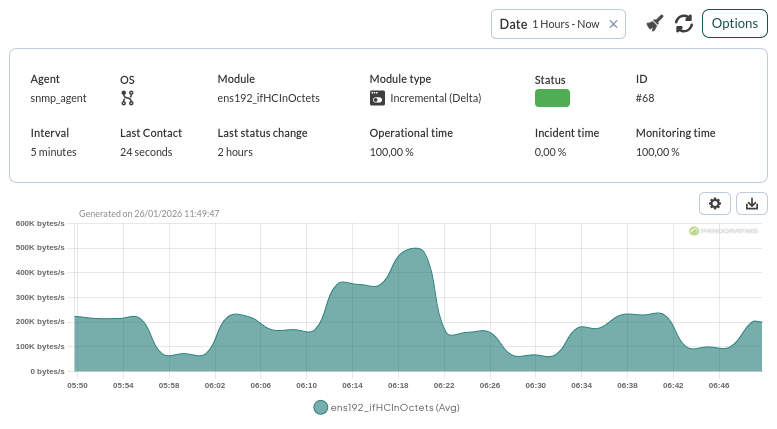](https://pandorafms.com/guides/public/uploads/images/gallery/2026-01/pfms-snmp-agent-image-080.png) We can also use the **Interface information (SNMP)** view, located below the general agent view, to conveniently see the input/output traffic information for each interface: [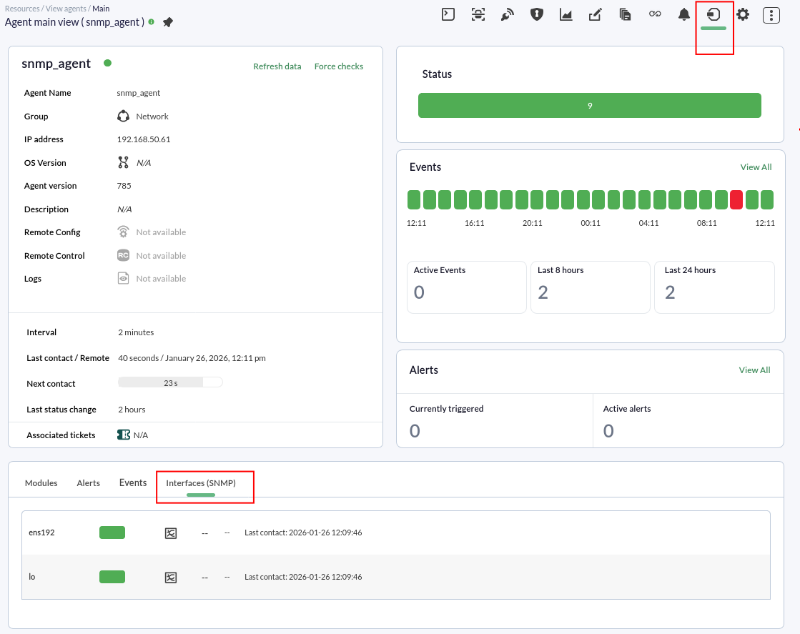](https://pandorafms.com/guides/public/uploads/images/gallery/2026-01/pfms-snmp-agent-image-090.png) By clicking on the graph icon of an interface ([](https://pandorafms.com/guides/public/uploads/images/gallery/2020-11/image-1604424478824.png)) you will see more details (in **Options** you can change the time period): [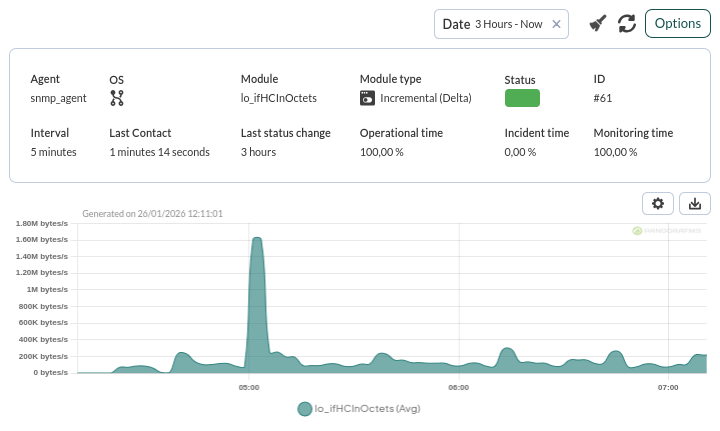](https://pandorafms.com/guides/public/uploads/images/gallery/2026-01/pfms-snmp-agent-image-110.png)Are you not achieving the results explained in this chapter? Access the [help](https://pandorafms.com/guides/public/books/first-steps-with-pandora-fms/page/21-where-to-look-if-problems-arise) or [support](https://pandorafms.com/guides/public/books/first-steps-with-pandora-fms/page/22-support) section.