
11. Module Advanced Settings
In this section, we will see how to configure some of a module's advanced options, as well as define the measurement thresholds that cause a module to transition to a WARNING or CRITICAL state. When editing a module, you can also define many other settings that allow you to fine-tune each metric monitored by Pandora FMS to your needs.
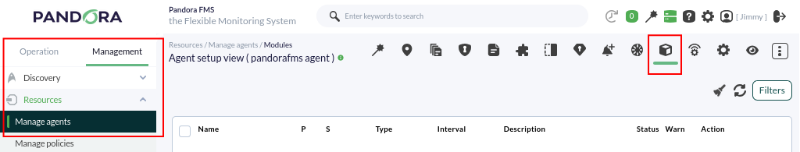
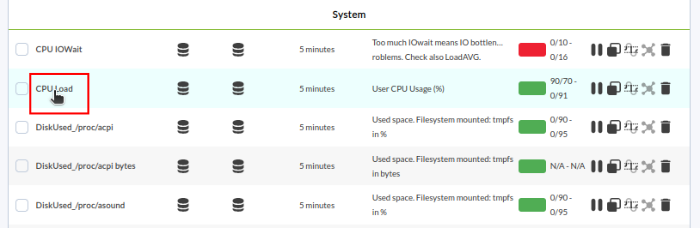
We choose the module we want to configure by clicking on its name:
In this view, we will find the fields necessary to adjust the warning and critical thresholds. In this example, we are editing the CPU Load module, a module that returns a numerical value (as seen in the module type information, it is a Generic numeric or generic_data).
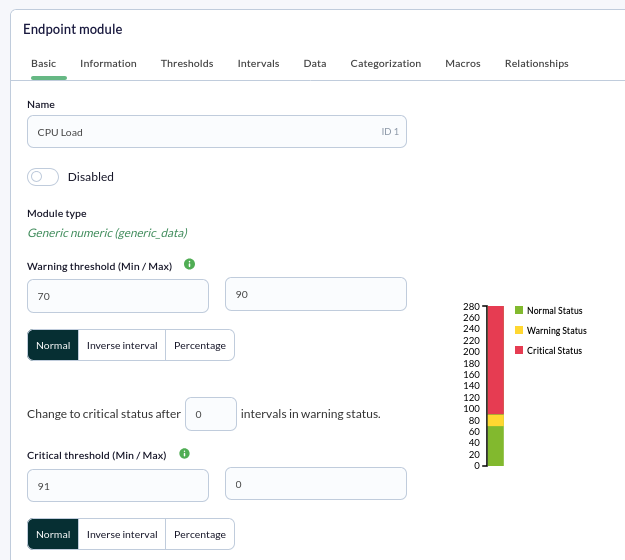
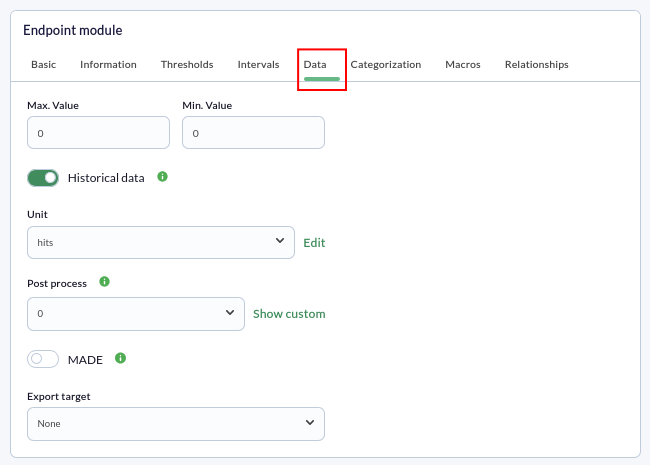
Other fields of interest include the Disabled checkbox to deactivate the module, or the module group definition list it is assigned to, which serves to classify an agent's modules so they appear grouped. Finally, the Historical data checkbox allows defining whether this module saves all information it receives (to display historical graphs) or only the last collected value.
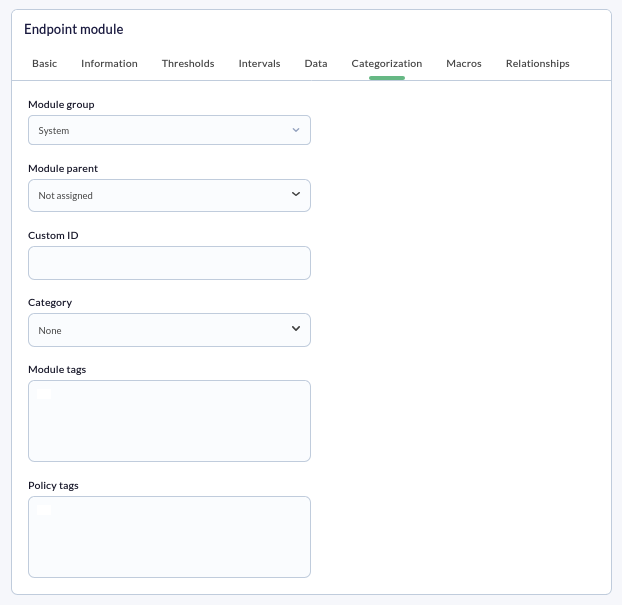
We will also see some other interesting fields in the Categorization tab:
Thresholds
In this section, we will configure the warning and critical thresholds for a module, which define what values a module must have to be in a CRITICAL, WARNING, or NORMAL state. Let's see an example:
In our example, we have a CPU % module to which we want to add thresholds. This module, by default, will always be in a NORMAL (green) state as long as it is between 0% and 100%.

If we want this module to show a critical or warning state when the CPU reaches a certain percentage, we must configure it by determining the desired Warning threshold and Critical threshold. In this example, we will configure them so that when the CPU reaches 60% usage, the module enters a warning state, and if it exceeds 80%, it enters a critical state.
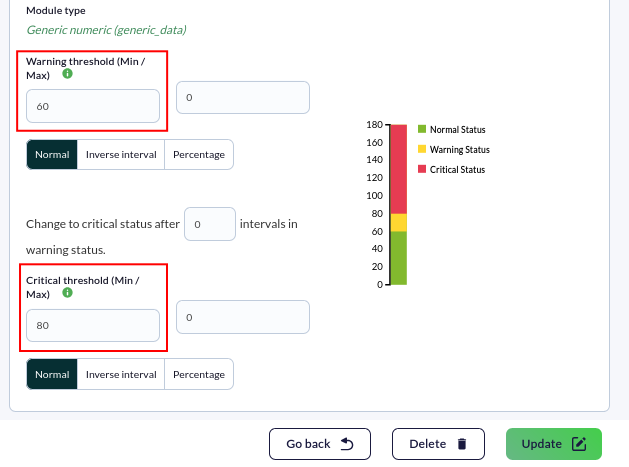
After configuring the thresholds, we just need to click the Update button, and our thresholds will be correctly configured. The next received data will already interpret those thresholds.
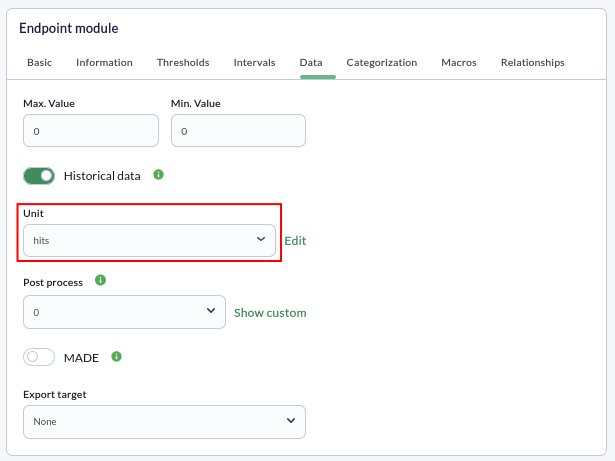
Units
This field within the advanced options allows defining the units of the data obtained in a module. This unit will be included in graphs and reports, making it easier to interpret the data shown to the user.
In our example, we want the unit to be hits. We place ourselves inside the Unit field and choose the desired option from the drop-down menu:
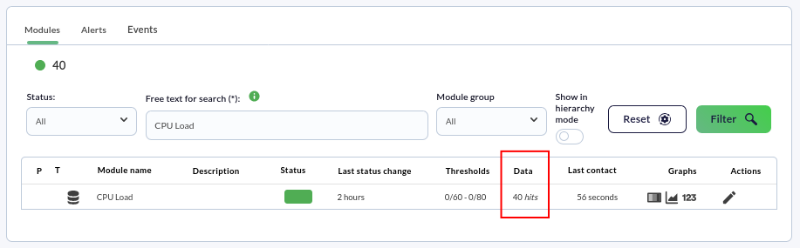
Finally, we click the "Update" button and verify that our unit is correctly displayed in the modules view.
If the unit does not appear among those available, we can define one by clicking on the pencil icon.
Are you not achieving the results explained in this chapter? Access the help or support section.