
2. Basic Architecture
Pandora FMS Servers
The Servers are integrated into a single application, generically called PFMS Server, which is a multi-threaded application that concurrently executes different instances or specialized Pandora FMS servers. These are the elements in charge of performing the existing checks as they verify and change their status based on the results obtained. They are also responsible for triggering the alerts established to control data status.
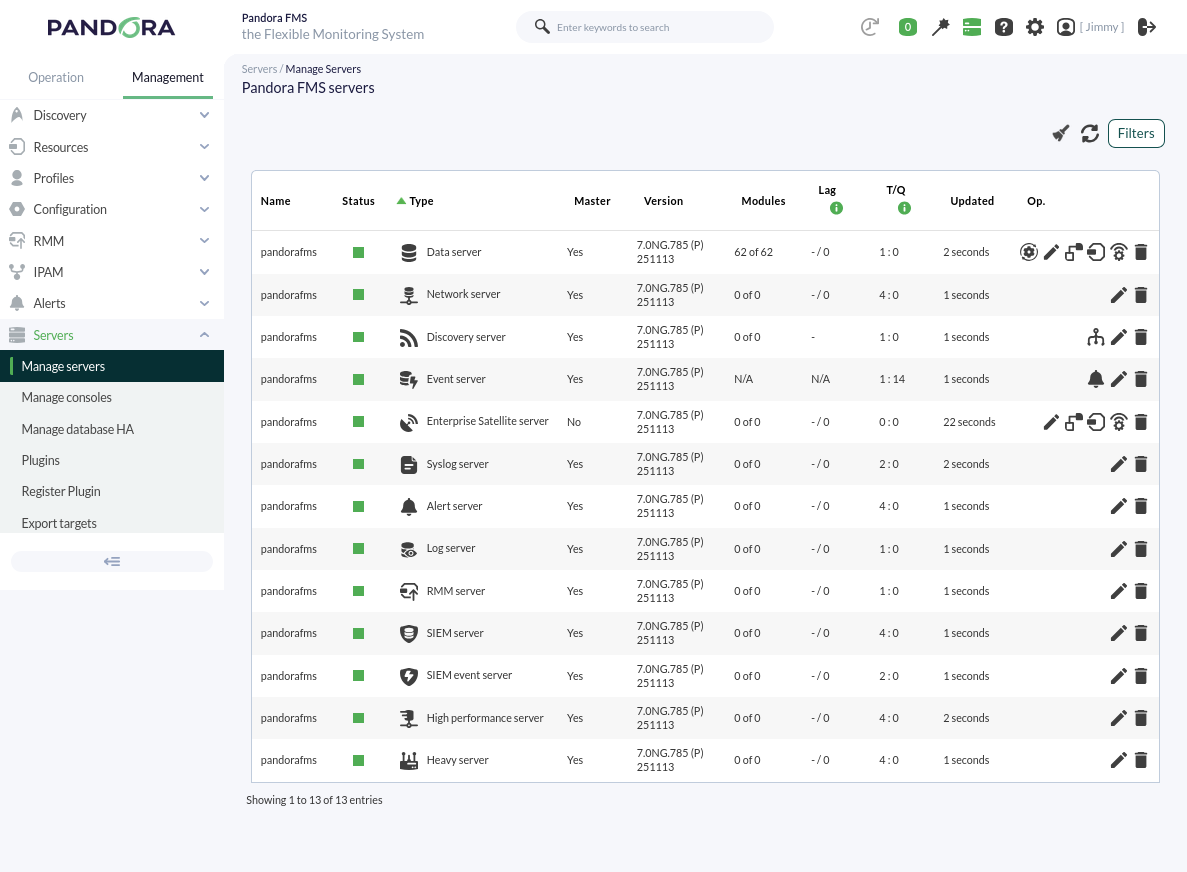
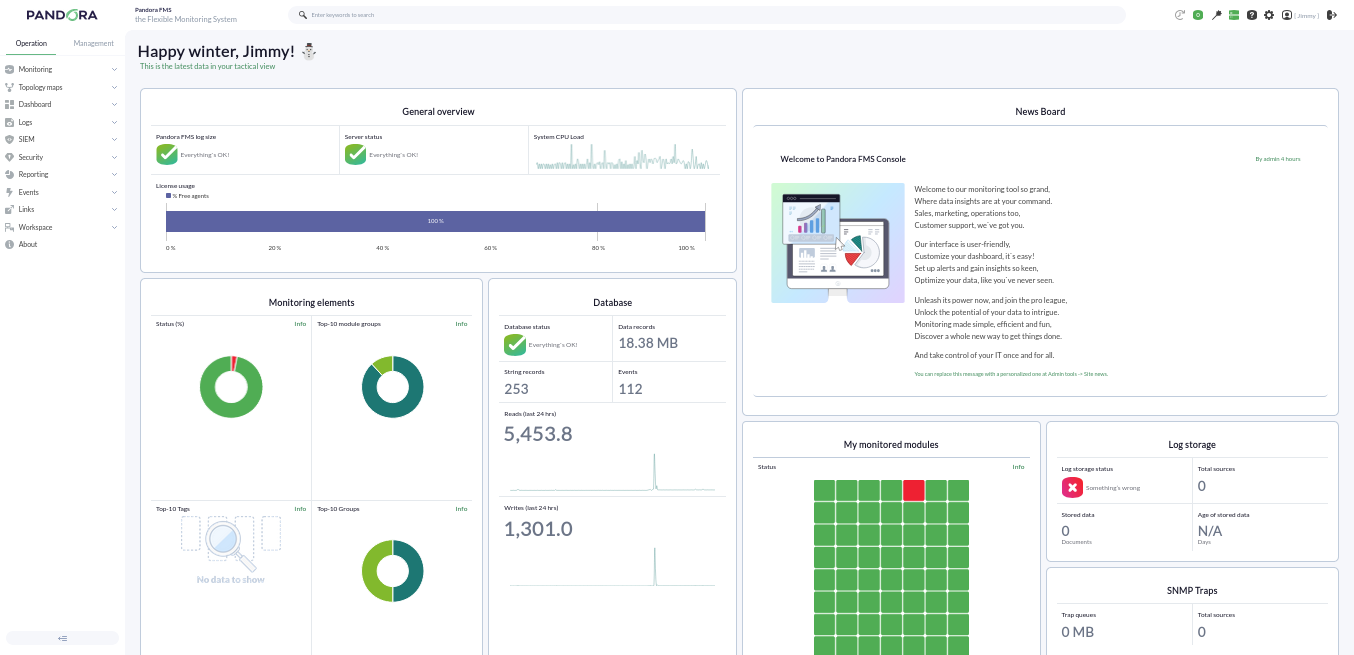
Pandora FMS automatically manages the status of each server, its load level, and other parameters. The user can monitor the status of each server through the server status section of the Web Console:
Basic Servers
Data Server (enabled by default): It is responsible for processing the information sent by the EndPoints (in XML format); the server processes it and stores the result in the database. It is also responsible for generating alerts and events based on that data, the latter being of critical importance. To enable the server, it is necessary to configure the line dataserver 1 in the file /etc/pandora/pandora_server.conf .
In the remote configuration (Web Console) of the Data Server, the rest of the servers can be visually activated. It also has the extra option of viewing and editing the file /etc/pandora/pandora_server.conf.
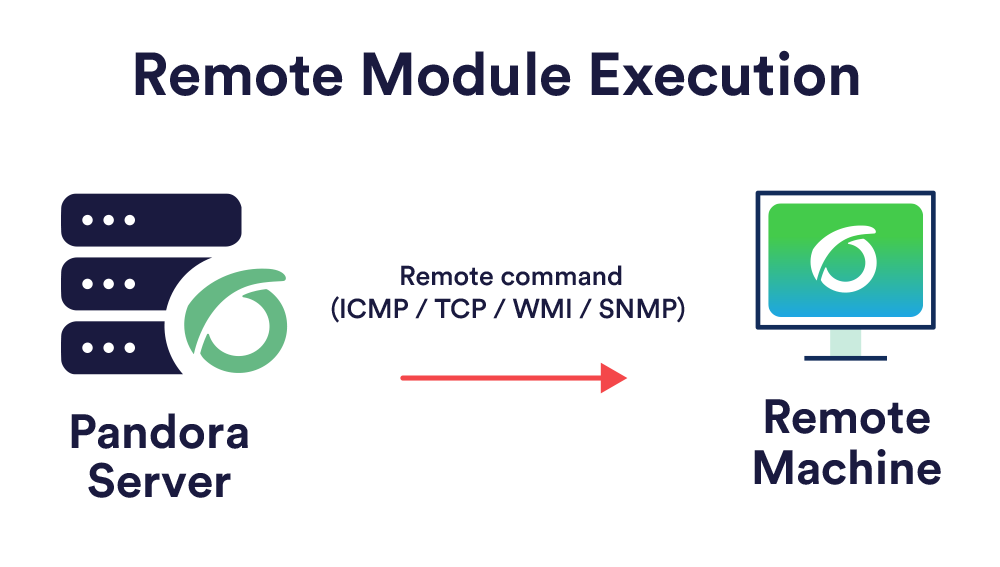
Network Server (enabled by default): This server performs remote monitoring tasks through the network, which can be ICMP checks, TCP requests, and SNMP requests. The server and remote machines must have communication to perform these checks. As of version 785, this server also includes the following tasks:
- Predicts numerical values using statistics and modules with real data as a source, allows detecting anomalies outside usual trends, and creates new values from prediction statistics, which can be used as baselines. It also allows creating new values through arithmetic operations with the values of existing modules (synthetic modules).
- Remotely monitors MS Windows® systems using the WMI® protocol. This is done by executing WMI statements, remote statements compatible with any Windows system with WMI enabled that allow obtaining Hardware and Software information.
- Perform complete web checks, from the user identification process to passing parameters via forms, content checking, menu navigation, etc. It allows for availability checks (works or does not work) and obtaining latency times (in seconds) of the complete browsing experience, including resources associated with the page (images, full texts, etc.).
Discovery Server (enabled by default): Allows exploring networks to detect equipment and apply monitoring templates quickly. It also allows the rapid deployment of specific monitoring for databases, cloud systems, and virtual environments through DISCO packages. It includes the necessary tools to discover or import devices and equipment on the network. To enable the server, it is necessary to configure the line discoveryserver 1 in the file /etc/pandora/pandora_server.conf .
Heavy server (enabled by default): performs complex checks remotely through customized scripts, managed centrally. This server allows an advanced user to define their own checks, developed by themselves, and integrate them into the application so they can be used conveniently from Pandora FMS. It also has several other important functions:
- It is responsible for managing monitored devices through NCM.
- If data export has been enabled and configured, basic information can be forwarded to another higher-level PFMS Server so that the latter has concentrated information to be analyzed and visualized (without altering the operation of the lower-level PFMS Server).
- Obtains and visualizes system inventory information: installed software, hardware element models, data storage devices, services running on the system, etc. This information can be obtained both remotely (from the PFMS Server) and locally (via the EndPoints). It does this with extensions developed by the user, for both MS Windows® and Linux®.
Network High Performance Server (enabled by default) handles the workloads of ICMP and SNMP checks:
- ICMP: Uses the nmap binary version 5.5 or later that is installed with Pandora FMS. They make up the basic monitoring checks such as connectivity and response time; by default, when creating an agent via the Web Console, it comes with two pre-configured modules for this.
- SNMP: Uses the braa binary which is also installed with Pandora FMS. This braa binary is located in
/usr/bin/braaby default. It is compatible with SNMP v1 and v2. It requires the Network Server to be operating simultaneously to be able to translate the received OIDs.
The number of threads that the processes will use in the instance where Pandora FMS is installed can be set for each server.
Pandora FMS Web Console
It is the Pandora FMS user interface, it allows monitoring the status of the Agents, viewing statistical information, and generating graphs and data tables. It is also capable of generating reports and centrally defining new agents, modules, alerts, and creating other users and profiles.
Pandora FMS Database
Pandora FMS uses a MySQL database where all the information received in real-time is stored, normalizing all data from the various source origins (server, agents, etc.).
Currently Pandora FMS only supports MySQL, MariaDB, and Percona.
Agents
In Pandora FMS there are two types of agents and they can execute remote and local type modules:
- Remote Agent: This type of agent is an organizational element created in the Pandora FMS Web Console; it usually contains remote-type modules that are executed by those servers that obtain information remotely, such as the Network Server.
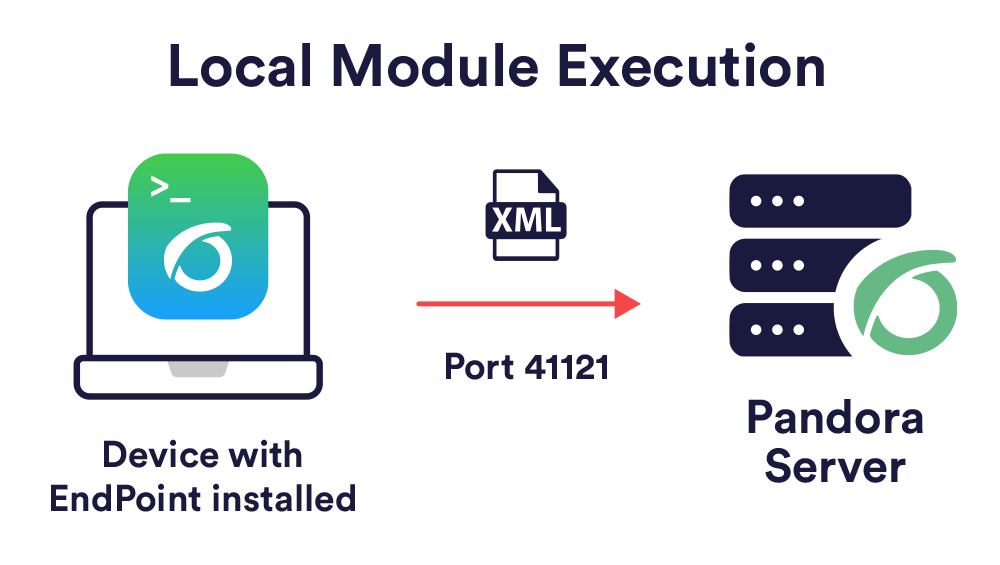
- EndPoint: It is software installed on the equipment to be monitored locally, extracting information from the equipment itself; it allows monitoring machine resources (CPU, RAM, disks...) and installed applications (MySQL, Apache, JBoss). All information collected by the EndPoints is sent to the server in XML format via the Tentacle protocol (SSH or FTP can be used) at a default interval of 5 minutes (300 seconds) from their respective agent.
Generally, the monitoring of servers and equipment will be carried out with EndPoints, while the monitoring of network equipment will be done remotely without the installation of any software.
Topologies, Schemas, and Monitoring Models
Ideally, all monitored equipment should have communication with the Pandora FMS server, but occasionally we will encounter cases where we do not have full communication between the different elements we want to monitor. We are going to mention different situations we may face and how to fix them.
Accessible Networks
- Network accessible for centralized remote monitoring: The Pandora FMS server has communication with all machines on the network.
- Network accessible for Agent and EndPoint-based monitoring: It is the EndPoints that have communication with the Pandora FMS server.
Networks with Access Difficulty
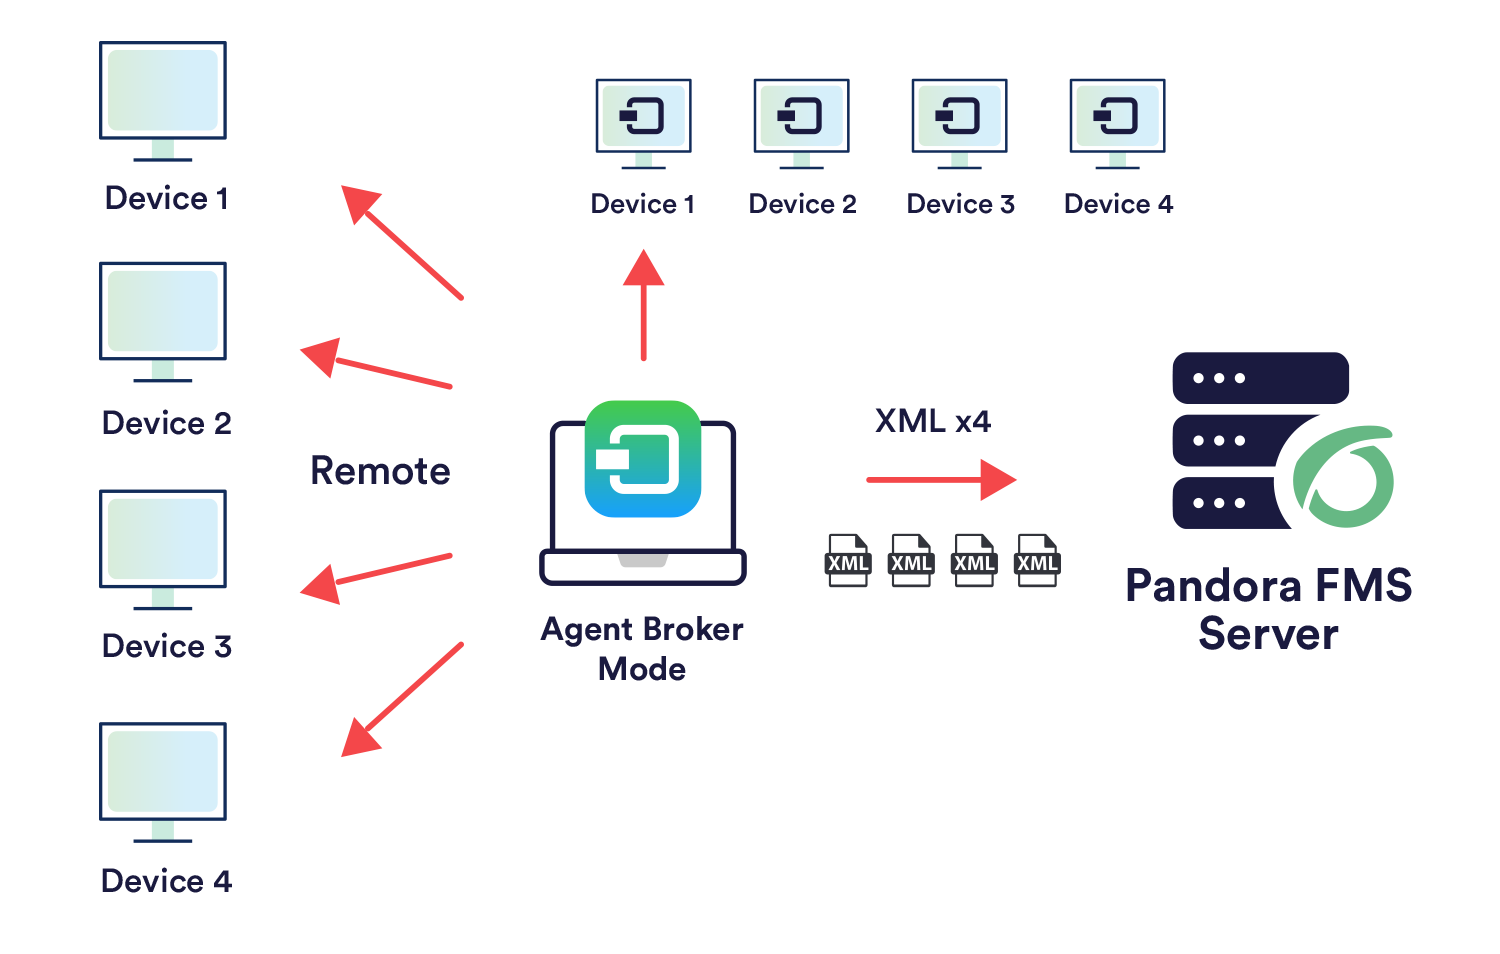
- Remote network not reachable by Pandora FMS remote checks: Use the broker agent mode.
- EndPoints that do not have access to the Pandora FMS server: In this case, use the proxy feature of the EndPoints or a Satellite Server as an EndPoint proxy.

- Different networks to monitor remotely with the server: Satellite Server or several different Pandora FMS servers connected to the same database can be used.
Are the results explained in the chapter not being achieved? Access the help or support section