
Pandora FMS NG 777 LTS Andromeda

There are two types of versions in Pandora FMS: LTS (Long-Term Support) versions, for example: 772 LTS “Renaissance”, and RRR (Regular Rolling Release) versions, for example: 773, … ,776. This update corresponds to 777 LTS “Andromeda”.
LTS versions have frequent and periodic updates (fixes), which correct both security issues and critical bugs detected in the tool. These are the versions that we recommend to use in production environments. LTS versions are released approximately once a year.
RRR versions incorporate new features in each release, as well as bug fixes, but due to their dynamic nature, bugs are more likely to found. RRR versions are released approximately every two months. They are ideal for those users who need to be up to date and are not afraid to find some unpolished detail. LTS versions are aimed at consolidating all changes of the RRR versions and offering maximum stability.
New Features since Last LTS Version (772)
LTS versions do not include new features, they just fix bugs from previous RRR versions. In this brief section, we will make reference to all af the new features since the last LTS version.
Revamped GUI
The web Console was renewed, both in the Command Center (Metaconsole) and in nodes, in an attempt to harmonize colors and frame sizes, in multiple sections and features.


New HA System
Our HA allows Pandora FMS to be 100% geographically distributed. The redundant database nodes can be on different networks, separated by many kilometers. The new High Availability (HA) system 100% integrated into the interface is managed right away from the console, enabling the “switchover” feature and automatically detecting events such as failures and synchronizations. It is even capable of overcoming a “split brain” event with a subsequent merging of data from locations that continued working, even after de-synchronization. This ensures that Pandora FMS continues operating independently, even in the event of a general network outage.
New Multi-Process Mode
It is now possible to start the different servers of a Pandora FMS instance as separate processes, each with its own threads instead of using the traditional single-process model with all threads. This allows each Pandora FMS server to be managed separately, with the ease of continuing to boot from a single system service.
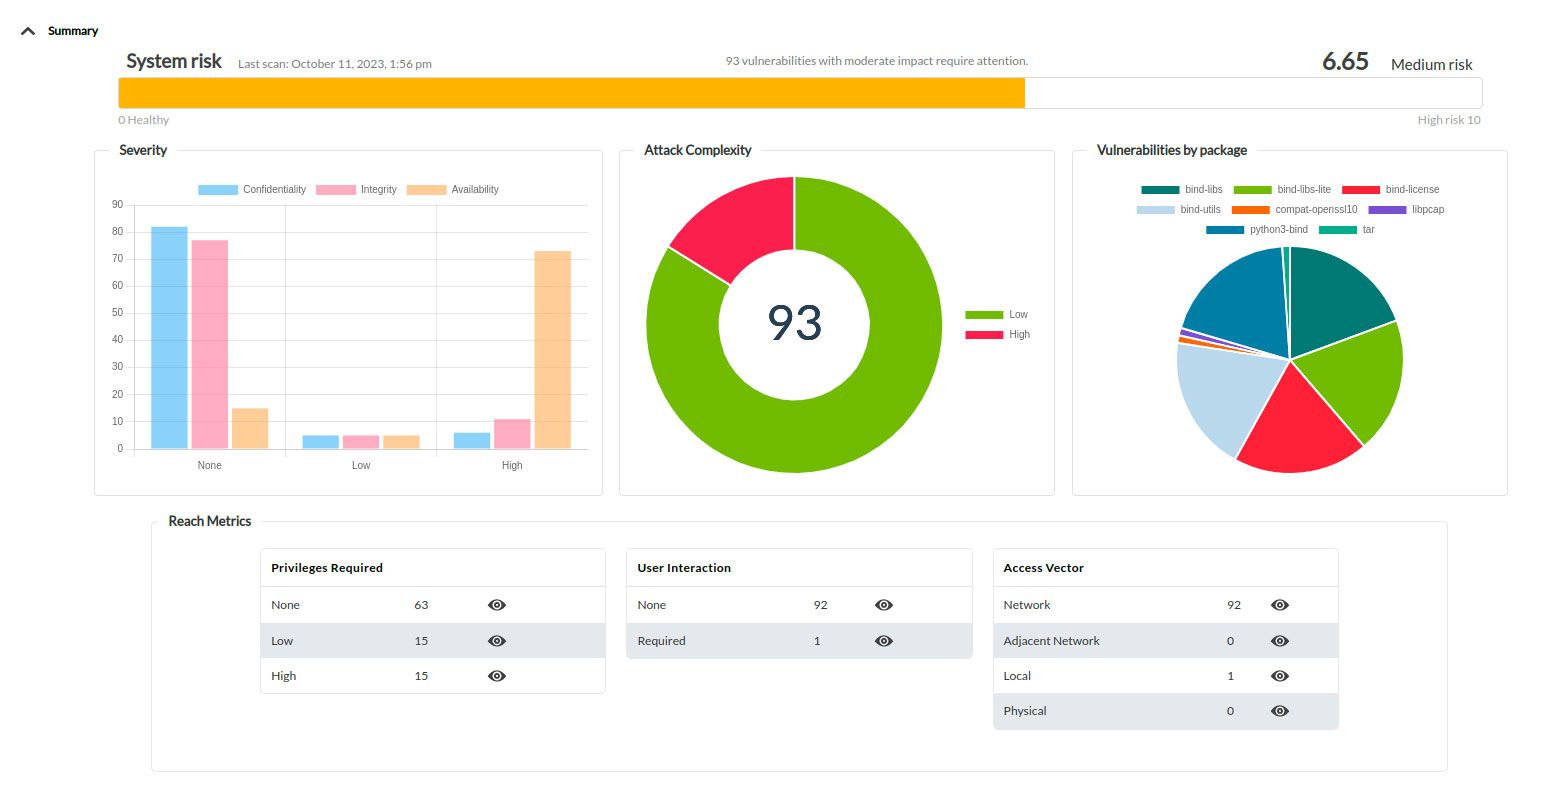
Continuous System Security Monitoring (Hardening)
Pandora FMS uses the CIS recommendations to implement a security audit system, integrated with monitoring to see the evolution of Hardening throughout your organization, system by system.
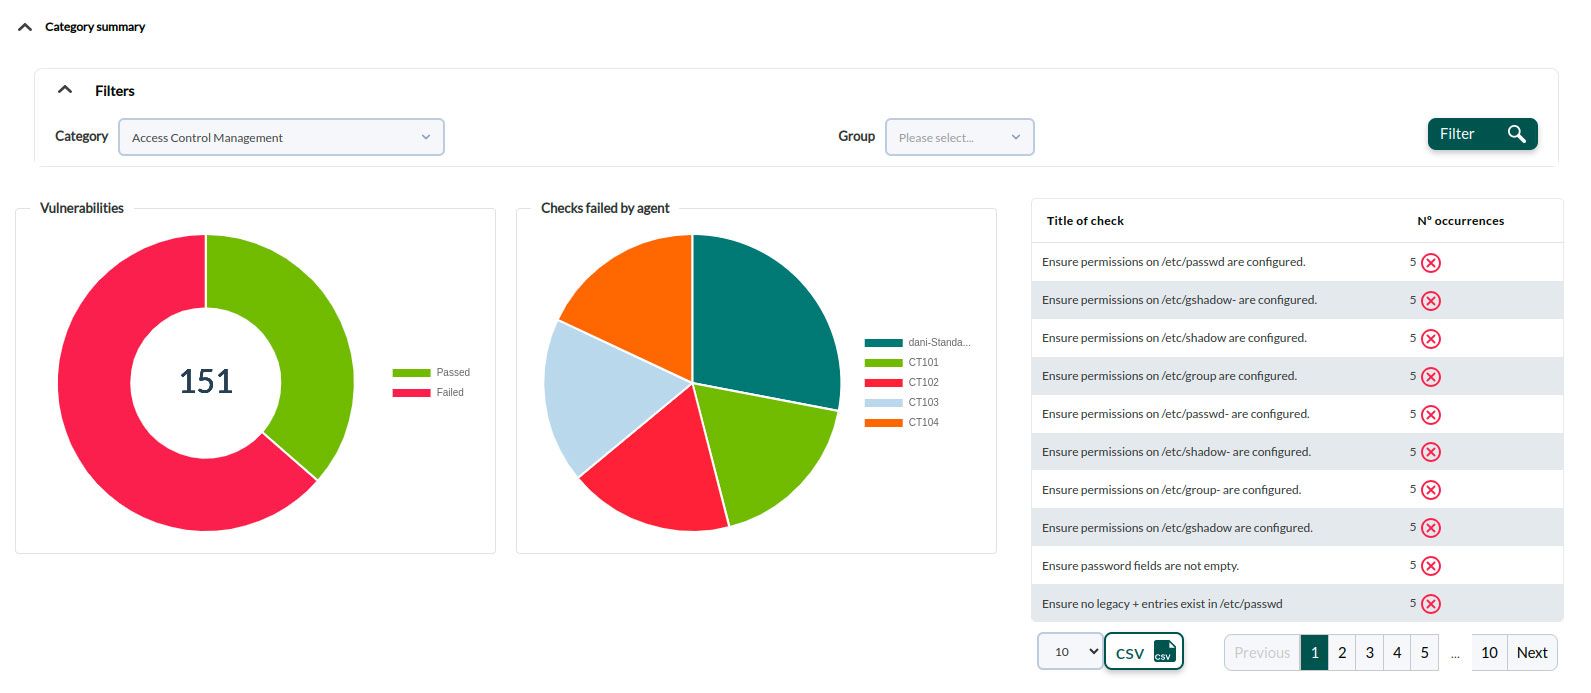

Security Vulnerability Monitoring
A set of features that allow us to monitor the security of our systems, monitoring which installed applications are vulnerable. To do this, data crossings are obtained with the inventory data of each agent and also by remotely checking the agents, to find out which applications are listening on the network. It offers a summary table of vulnerabilities by agent. Pandora FMS uses a database of known vulnerabilities, using CVE, NVD and other public databases.
Discovery 2.0
It allows a new way to implement centralized monitoring with automatic discovery through downloadable wizards from our plugin library (and therefore be created by any developer who uses our APIs).

API 2.0
From version 776, a Pandora FMS API version 2.0, with a new format to carry out the requests and a dynamic documentation accessible from Pandora FMS console itself.

ITSM and PFMS Integration
Connection and communication between Pandora FMS and Pandora ITSM is now allowed. From a simple configuration, you may integrate ticket generation and management from Pandora FMS console, alerts and event responses.

New features in Network Configuration Management (NCM)
Reports, bulk operations, interface improvement, configuration and backup history, planner and dashboard.
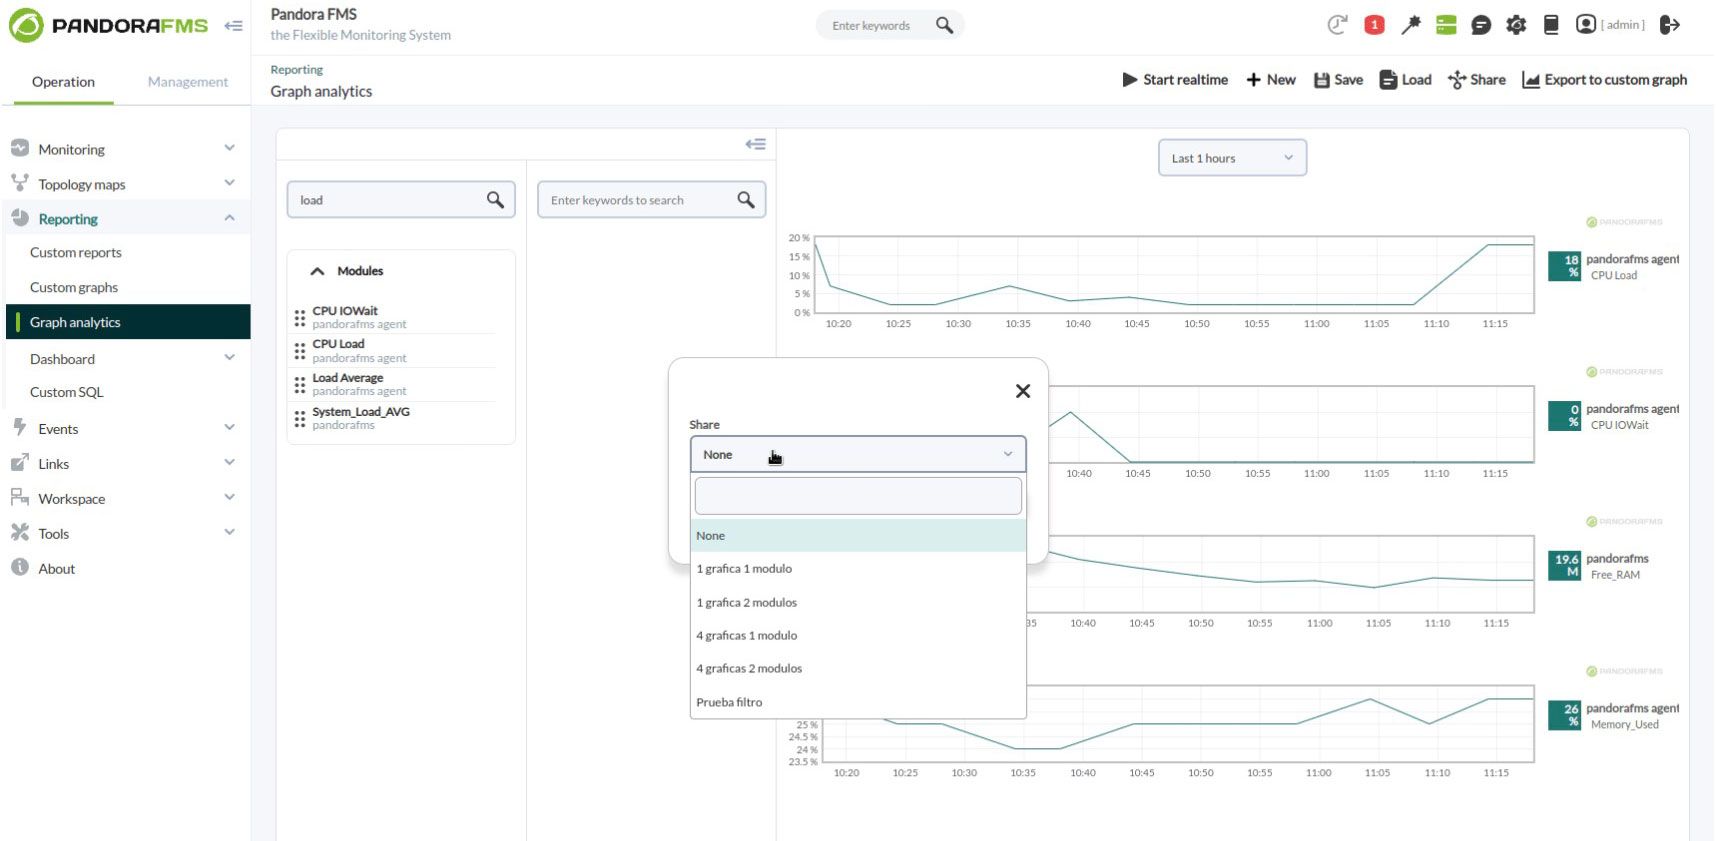
New tool: Graph analytics
It is a tool designed for problem detection, comparative analysis and pattern detection. It allows you to search and compare agent and module graphs. It is accessed through the Operation → Reporting → Graph analytics side menu.
The work of organizing the most important data and information can be saved through a filter and a public link can even be shared, moreover graphs can also be exported to the Custom Graph section.
View of service trees in vertical format
Some of our clients asked us for an alternative way of seeing the services, because when they were very numerous, they did not look good, so we incorporated another alternative way of seeing the services.

Version obsolescence management
Extended the operating system management system to be able to assign expiration dates to certain OS versions, so that not only specific searches can be created for specific versions of each OS, but also generate support expiration reports (End Of Lifesupport).

New Agent Deployment Wizard
In version 771 we added an agent installation wizard, so that an inexperienced user may easily deploy agents in Windows, Linux or Mac environments.


Data export and import system and configurations
This new feature allows greater flexibility when copying and/or moving items between PFSM servers. It includes export/import of data such as Custom graph, Custom report, Dashboard, GIS Map, Network map, Policy, Service, Visual Console.

Correlation Engine Refactoring
We separated the log and event alerts. They allow in both cases to create sets of logical rules to process the information separately and in a more optimized way. That way the event console scales in its ability to process data.


Demo Data Loading
We included an option in Settings → System Settings → Demo data from which you may generate perfectly functional Pandora FMS demo data.


“Event cardboard” Widget
In version 770 we added a colored card widget, with an event count, both in the nodes and in the Command Center (Metaconsole), according to filtering rules based on type of events, event status, criticality and/or severity, groups, etc. (and by servers and/or nodes if requested by the Command Center).

Widget Heatmap
In version 770 we added a widget, similar to the “Heatmap” view, which embeds in a variable size widget the information in pixel maps of the state of groups, agents or modules previously filtered by group.

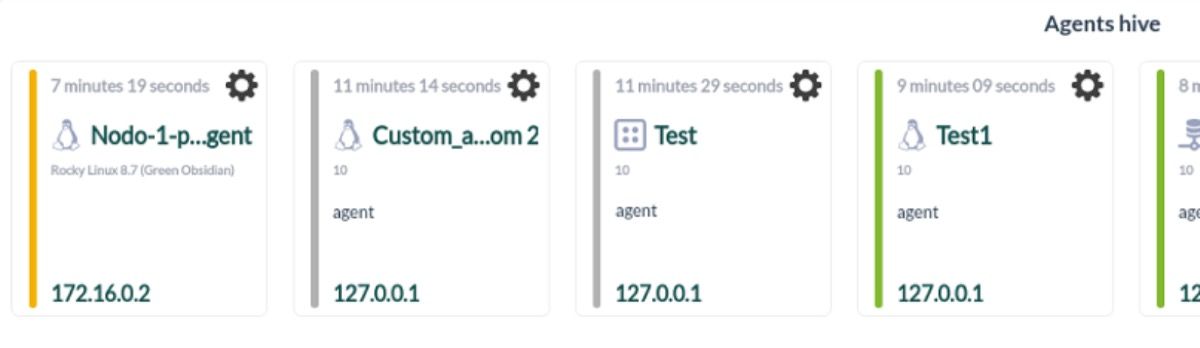
Agent Hive View Widget
It is displayed in a grid with items containing the agent name, the operating system icon and the general status of the agent in a color stripe on the left. Clicking on any item in the box will take you to the agent detail view, or click on the wheel to access the edit view.
Simple Graphic Element in Visual Consoles
In version 771 we added another item to dashboards, which shows a simplified graph of any monitored metrics. Both the color and the size of each item are configurable.

Android Pandora FMS Console
Improved Pandora FMS console for Android.
New Report Schedule View
Although reports could already be scheduled, we created a new view to see it more easily. It may be found at Reporting -> Custom reports -> Schedule.

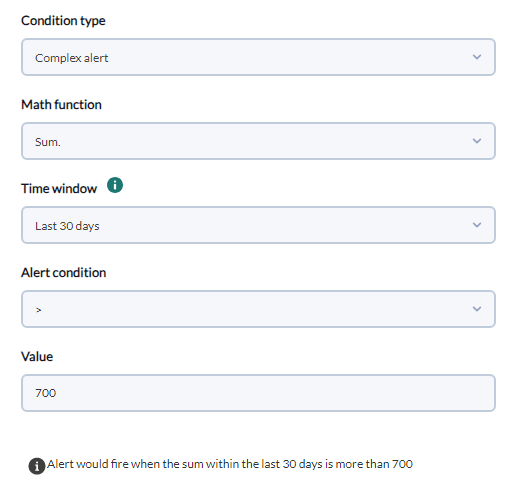
Complex alerts
New feature to create new alert templates, which allow processing extraordinary calculations in addition to ordinary monitoring.
These complex alerts allow the calculation of the average or sum, or the detection of maximums and minimums of the monitored information, such as, for example, obtaining a warning when the percentage of CPU usage in a week exceeds the average consumption.
IP Information in Network Explorer
Now Network Explorer offers real-time information (using Whois) of any of the IPs displayed.

Multiple Selection on Visual Consoles
A feature that was suggested for years and that we finally implemented. It is now possible to select multiple items to move, resize or delete them.
New native PowerShell® module in Software Agent for Ms Windows®
Starting with version 776, there is a new module for Windows agents that allows you to enter commands in PowerShell with complex instructions. This offers greater power and ease of configuration for all agents on modern Windows systems.
Discovery Kubernetes
Centralized version through Discovery 2.0 of the existing Kubernetes Enterprise plugin that allows you to retrieve data from the node, pods and deployments API.

New Discovery PFMS 2.0 plugin for Proxmox®
Centralized version through Discovery 2.0 of the existing ProxMox Enterprise plugin that allows you to retrieve data from the API of nodes, backups, virtual machines, lxc containers and storage.
pandora_collectd plugin
pandora_collectd plugin collects information from collectd and sends it to Pandora FMS for processing and storage. It generates an agent with data turned into Pandora FMS modules, allowing to monitor devices by means of collectd, obtain history data, create reports, dashboards, trigger alerts, etc.


Responses