Pandora FMS NG 770 RRR
Notable improvements
New interface
We start off with a global and very important change. It is not just a new look but rather a whole interface revamp including menus, filters, lists and forms that particularly affects usability. Since such dramatic changes were made, we wanted them to be released two versions prior to the LTS one, to smoothen out the unavoidable bugs arising from such a revolution for the product.
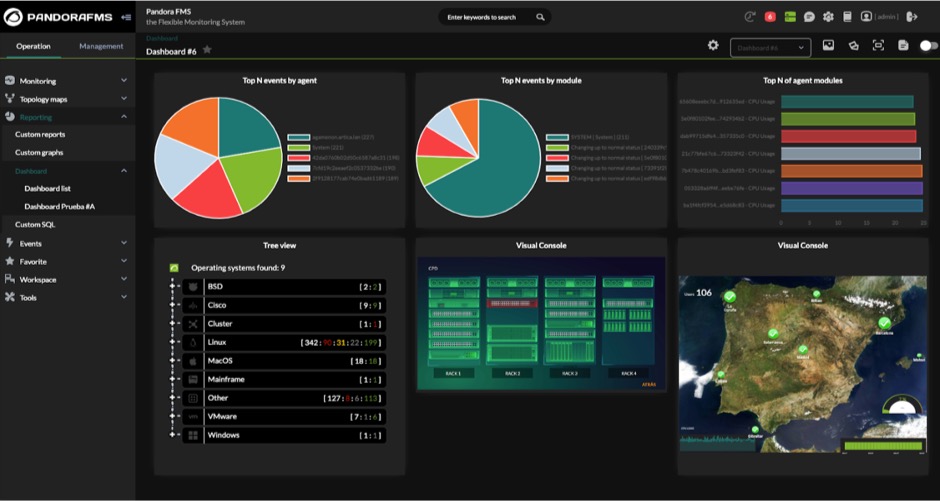
Those changes apply to the whole Pandora FMS, including the Command Center, from home screens to each and every one of the screens shown by the system. It should be noted that the home page has new options (such as rotative backgrounds, configurable opacity and its different white color version, compared to the dark mode).
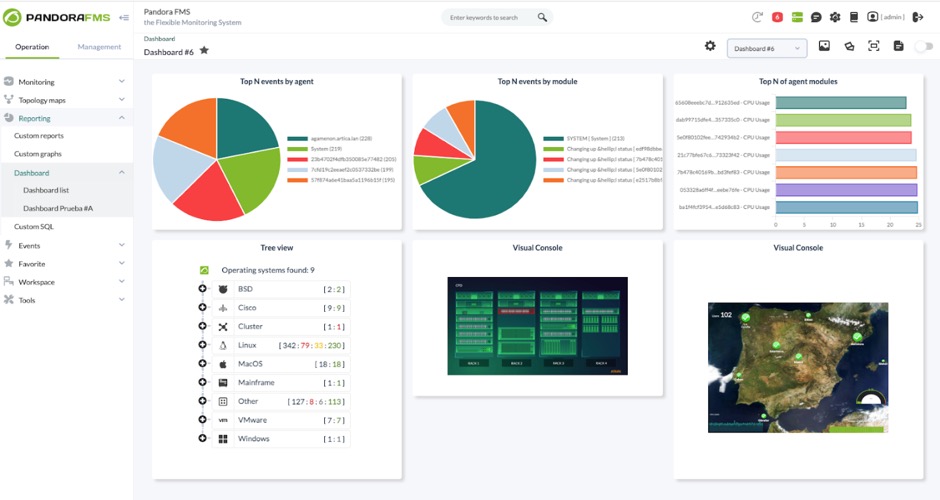
Dashboard and PDF report visuals have been specifically revised so that the enhancements affect all of Pandora FMS areas.


Netflow monitoring
A new general configuration feature will allow you to enter data coming from applying netflow filters on traffic in real time as monitoring data. It will also enable finding out when the traffic exceeds what was foreseen as well as showing the top 10 list of the IPs with the most traffic in each flow. This allows assigning alerts in real time based on the traffic volume, creating reports and specific graphics for each defined filter.
Choosing the server that executes a scheduled task
In case of having lots of recognition tasks and having a Discovery server cluster, from now on you may choose which server you want to execute a specific recognition task and therefore make sure the load is evenly distributed if needed.
New HA system
With version 770 we launch a new HA system for the database that allows Pandora FMS to be 100% distributed geographically. The database redundant nodes can be in different networks, separated by a long distance. The new 100% interface-integrated HA system is managed right away from the console (switchover) and detects automatically events such as failures, synchronizations and even allows overcoming a split brain event with the ensuing merging of data from locations that kept on working even after their desynchronization, which makes Pandora FMS keep working independently even after a global network fallout.
The new system can be selected in the setup and fully replaces the old system, not using third-party software solutions such as corosync and pacemaker, dramatically simplifying its operation.

Support for the sFlow protocol
In version 770 the sFlow protocol works together with the NetFlow® protocol in specialized network device monitoring, given its similarities.
Its activation and configuration is carried out by means of the general settings and shares its display in a separate and differentiated way in the menu Monitoring -> Network.

Improved agent search system
Now it is possible to look for agent custom filters, operating system and many more fields thanks to filters. Said filters can be loaded/recovered, making data navigation much easier and customizable.

Favorites system
Certain display elements (agent view, group view, visual console, dashboard or report) can be checked as favorites and displayed in a new menu section.

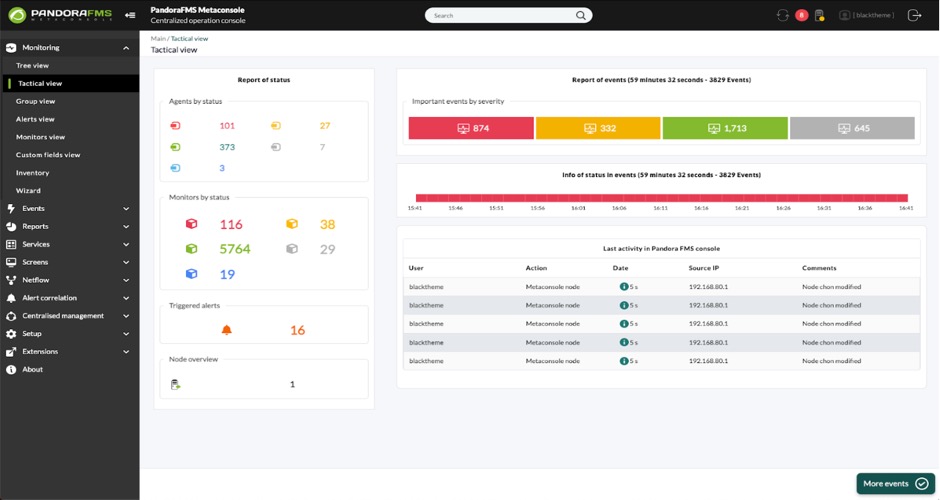
New group tactical view
The new group summary view allows you to better see the details from each group when there are several of them:

Additional indexes in the database
New indexes have been added to the database, particularly useful for very large environments with lots of data. Although indexes add very little additional work in databases when saving records, they streamline queries, which are always frequent and repetitive. These new indexes improve Pandora FMS performance.
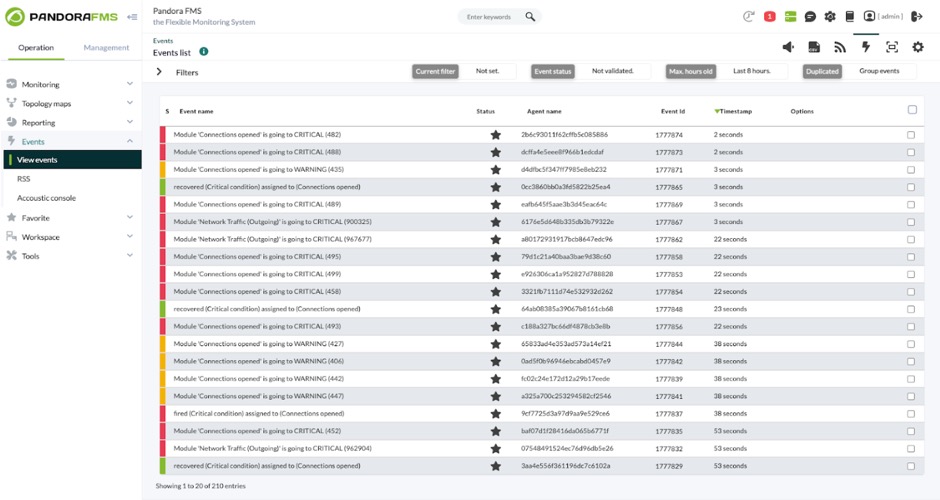
Event cardboard widget
It allows to obtain event counting, both in the nodes and in the Command Center (Metaconsole), according to filtering rules based on type of events, event status, criticality and/or severity, groups, etc. (and by servers and/or nodes if requested by the Command Center).

Widget Heatmap
Similar to the Heatmap view, it allows embedding in a variable-size widget information in pixel maps on the status of groups, agents or modules that have been previously filtered by group.

Avg|Sum|Max|Min Module data widget
It displays the average, maximum or minimum value (AVG, MAX, MIN) of a module or the sum (SUM) of an incremental module, accompanied or not by its measurement Unit and descriptive label in a time period (by default the last 30 days).

Welcome tips system
Tips are short messages, accompanied or not by a web link to get more details on the advice shown when logging into PFMS web console (Welcome tips). Within this version you may also find a set of tips by default that can be modified by the administrator. Specific messages may also be created for the organization, made up by a message (multi language) and an image.
You may set the language of each one of them and edit them through a filter that allows you to search by keyword in the title of each tip.
Through the Profile classification included in PFMS you may configure the welcome tips in the drop-down list in Profile, according to the profiles they are granted users they may or may not see them.
Each user will be able to set their own user settings:

Modules by status widget
The Modules by status widget, both for nodes and for the Command Center (Metaconsole) allows to display modules by status (by default those in critical status) grouped by page (five by default). They are sorted by their Last status change, the most recent first, for example:


New feature for the plugin for VMware®
Added snapshots taken from virtual machines to the plugin for VMware®. It is an Enterprise feature that has been improved and updated in Pandora FMS online library.

SingleStore plugin
Since 2020, the SingleStore database engine (previously MemSQL) stopped focusing on speed based on the RAM memory to take an approach aimed at online storage (Cloud native), therefore becoming a powerful cluster database.
This new Pandora FMS plugin for SingleStore works for both global monitoring (for example the maximum amount of connections, current connections, bytes sent and received through an agent for the database engine) as well as for monitoring each database (online database, connection, etc.).
The SingleStore plugin for Pandora FMS is an Enterprise feature and can be downloaded from the online library, its specific documentation is available for everyone in Pandora FMS Guides.
Pandora FMS NG 770 RRR
Mejoras destacadas
Nueva interfaz
Comenzamos con un cambio global y muy importante. No es solo un nuevo aspecto, es un cambio completo en la interfaz: menús, filtros, listados, formularios que afecta sobre todo a la usabilidad. Al ser un cambio tan radical hemos querido que fuera dos versiones antes de la LTS para limar los inevitables fallos que surgirán de semejante revolución.
Todo Pandora FMS, incluido el Command Center han sufrido estos cambios, desde las pantallas de inicio a cada una de las pantallas del sistema. Cabe destacar que la pantalla de inicio tiene nuevas opciones (como fondos de pantalla rotativos, opacidad configurable, y que es diferente en su versión de colores blancos respecto a la versión de colores oscuros.
Se han revisado especialmente el aspecto de los dashboards, y de los informes en PDF para que la renovación afecte a todas las áreas de Pandora FMS.
Monitorización de netflow
Un nuevo elemento de configuración general nos permitirá introducir como datos de monitorización los datos resultantes de aplicar los filtros de netflow sobre el tráfico en tiempo real. Nos permitirá saber cuando el tráfico excede lo previsto y mostrar la lista de las diez IP con más tráfico en cada flujo. Esto permite asignar alertas en tiempo real sobre volumen de tráfico, crear informes y gráficas específicas por cada filtro definido.
Poder escoger el servidor que ejecute una tarea programada
En caso de tener muchas tareas de reconocimiento y tener un cluster de servidores discovery, ahora se podrá escoger qué servidor queremos que ejecute una tarea de reconocimiento concreta, y así poder asegurarnos un reparto de la carga en caso de necesidad.
Nuevo sistema de HA
Con la versión 770 estrenamos un nuevo sistema de HA para la BBDD que permite a Pandora FMS estar 100% distribuido geográficamente. Los nodos redundantes de BBDD pueden estar en redes diferentes, separadas a muchos kilómetros. El nuevo sistema de HA integrado 100% en la interfaz se gestiona directamente desde la consola (switchover) y detecta automáticamente eventos como caídas, sincronizaciones y permite incluso superar un evento split Brain con fusión posterior de los datos de ubicaciones que han seguido funcionando incluso después de desincronizarse, lo que hace que Pandora, aun en caso de caída general de redes, siga funcionando de manera independiente.
El nuevo sistema se puede seleccionar en el setup y reemplaza totalmente al antiguo sistema, dejando de utilizar soluciones de terceros como corosync y pacemaker, lo que simplifica enormemente su funcionamiento.
Soporte para protocolo sFlow
En esta versión 770 el protocolo sFlow viene a acompañar, dada su gran similitud, al protocolo NetFlow® en las tareas de monitorización de dispositivos de red especializados.
Su activación y configuración se realiza por medio de la configuración general y comparte visualización, de forma separada y diferenciada, en el menú Monitoring -> Network.
Mejorado el sistema de búsqueda de agentes
Ahora es posible, mediante el uso de filtros, buscar entre campos personalizados del agente, sistema operativo y otros muchos campos. Dichos filtros se puede cargar/recuperar, haciendo muchísimo más cómodo y personalizable la navegación entre los datos.
Sistema de favoritos
Ciertos elementos de la visualización (vista de un agente, vista de un grupo, consola visual, dashboard o informe) puede ser marcado como favorito y visualizado en una nueva sección del menú.
Nueva vista táctica de grupos
Una nueva vista resumen de grupos nos permite ver mejor los detalles de cada grupo cuando tenemos varios.
Índices adicionales en la base de datos
Se han añadido nuevos índices para la base de datos, especialmente útil para entornos muy grandes con grandes volúmenes de datos. Los índices en las bases de datos, aunque añaden un muy pequeño trabajo adicional al momento de guardar los registros, aceleran las consultas las cuales son siempre frecuentes y repetitivas. Estos nuevos índices mejoran el desempeño de Pandora FMS.
Widget “Event cardboard”
Permite obtener un conteo de eventos, tanto en los nodos como en Command Center (Metaconsola), según reglas de filtrado basadas en tipo de eventos, estado de eventos, criticidad y/o severidad, grupos, etc. (y por servidores y/o nodos en el caso de ser solicitado por Command Center).
Widget Heatmap
Similar a la vista “Heatmap”, permite empotrar en un widget de tamaño variable la información en mapas de pixeles del estado de grupos, agentes o módulos filtrados previamente por grupo.
Widget “Avg|Sum|Max|Min Module data”
Permite mostrar el valor promedio, máximo o mínimo (AVG, MAX, MIN) de un módulo o la suma (SUM) de un módulo de tipo incremental, acompañado o no de su unidad de medida (Unit) y etiqueta descriptiva en un período de tiempo (por defecto los últimos 30 días).
Sistema de tips de bienvenida
Los tips o consejos son mensajes cortos, acompañados o no de un enlace web para obtener más detalles del consejo mostrado al iniciar sesión en la Consola web PFMS (Welcome tips). Puede establecer el idioma de cada uno de ellos y para editarlos cuenta con un filtro que permite buscar por palabra clave en el título de cada consejo.
Mediante la clasificación de Perfiles establecida en PFMS puede configurar los consejos de bienvenida en la lista desplegable en Profile, según el perfil permitido a cada usuario podrá o no visualizarlos.
Cada usuario podrá establecer su propia configuración de usuario:
Widget “Modules by status”
El widget Módulos por estado (Modules by status), tanto para nodos como para Command Center (Metaconsola) permite exhibir los módulos por su estado (de manera predeterminada los que estén en estado crítico) agrupados por página (por defecto cinco). Son ordenados por su último cambio de estado (Last status change), los más recientes primeros, por ejemplo:
Novedad en el plugin para VMware®
Añadida fecha de las copias instantáneas de volumen tomadas de las máquinas virtuales (snapshots), en el plugin de VMware®. Es una funcionalidad Enterprise que ha sido mejorada y actualizada en la biblioteca en línea de Pandora FMS.
Plugin “SingleStore”
Desde el año 2020 el motor de base de datos SingleStore (antes conocido como MemSQL) dejó a un lado su enfoque de rapidez radicado en memoria RAM, para dedicarse de lleno al almacenamiento en línea (cloud native) resultando en una poderosa base de datos en racimos (clúster).
Con este nuevo plugin de Pandora FMS para SingleStore se puede monitorizar tanto de manera global (por ejemplo número máximo de conexiones, conexiones actuales, bytes enviados y recibidos con un agente para el motor de base de datos) como con cada base de datos (base de datos en línea, conexión, etcétera).
El plugin SingleStore para Pandora FMS es una funcionalidad Enterprise y puede ser descargado de la biblioteca en línea, su documentación específica está de manera libre en Pandora FMS Guides.


Responses