
Parameters and configuration
Parameters
| --generate_password | To generate an encrypted password (if this password is to be used later for connection, it must be entered in the configuration option "password" and the option "use_encrypted_password" must also be activated in the configuration file with 1. |
| --as_discovery_plugin | Option to use it in discovery mode. |
Configuration blocks
The configuration file is divided into the following blocks
- Configuration
- Datacenter
- Datastore
- ESX
- VM
- Rename
- Reject
- Header
Each of the blocks is specified in the configuration file by entering its parameters below these blocks, for example :
Configuration
server 192.168.100.105
user pandorafms
pass P@$5w0rd!
datacenter ha-datacenter
Each block and its options are detailed below:
Configuration
Under the configuration block you can specify the following parameters
Global configuration
| server | Name or IP of the server to monitor |
| user | Account user |
| pass | Account password |
| datacenter | Datacenter where the plugin will point to |
| temporal | Path where temporary files will be stored |
| logfile | Path where the log file will be stored |
| entities_list | Path where the entities_list file will be created (more information about this file below) |
| transfer_mode | Execution mode, the two possible options are local or tentacle |
| local_folder | Path of the folder where the XML of the agents will be created for the local transfer mode (transfer_mode = local) |
| pandora_url |
pandora URL (only if required to use the event mode of the plugin) |
| api_pass | pandora api password (only if required to use the plugin event mode) |
| api_user | pandora api user (only if required to use plugin events mode) |
| api_user_pass | Pandora api user password (only if required to use plugin event mode) |
| event_mode | To activate the vCenter event monitoring, it is activated with 1. The events are copied to the Pandora FMS event list and become part of its normal flow (requires connectivity with the Pandora FMS console API). This option is only available for vCenter. |
| event_pointer_file | Path where the event_pointer_file file will be saved. |
| tentacle_ip | tentacle IP, required if the plugin is executed in transfer_mode tentacle |
| tentacle_port | Tentacle port, default is 41121 |
| tentacle_opts | Additional options for file transfer to the specified Tentacle server |
| virtual_network_monitoring | Enables monitoring of virtual switches with value 1 |
| use_encrypted_password | Enables use of an encrypted password with value 1 |
| threads | Number of threads to be used by the plugin in agent creation |
| interval | Interval in seconds in which the plugin agents are created |
| recon_interval | Interval in seconds after which the temporary entity cache file will be automatically deleted to rescan the VMware® infrastructure. |
| enable_recon_interval | Set recon_interval to 1. |
| group | Group where the agents will be created |
| use_ds_alias_as_name | Triggers the use of datastore agent alias as agent name with value 1 |
| statsinterval | Interval in seconds for statistics taken using the "custom_performance" option |
| flat_datastore_agents | Triggers creation of a single agent for datastores with name "VMWareDatastores" with value 1 |
| use_ds_entity_name | Enables use of Datastore name as agent name with value 1 |
| discard_empty_adapters | If set to 1, monitoring of ESX HBAs with destinations, devices, and paths set to 0 will be disabled. |
Control parameters of monitorable elements
| monitor_exclusive_agents | Enable the monitoring of specific agents (these are specified in the parameters below) with value 1 |
| exclusive_esx | If monitor_exclusive_agent is enabled, it is used to specify the esxi to monitor. Its value will be an array JSON with the agents to monitor |
| exclusive_datastores | If monitor_exclusive_agent is enabled, it is used to specify the datastores to monitor. Its value will be an array type JSON with the agents to monitor |
| exclusive_vm | If monitor_exclusive_agent is enabled, it is used to specify the vm to monitor. Its value will be an array type JSON with the agents to monitor |
| exclusive_rp | If `monitor_exclusive_agent` is enabled, it is used to specify the resource groups to be monitored. Its value will be a JSON array containing the agents to be monitored |
| scan_datastore | Activates datastore scanning with value 1 |
| scan_datacenter | Triggers datacenter scan with value 1 |
| scan_esx | Triggers esx scan with value 1 |
| scan_vm | Triggers virtual machine scan with value 1 |
| scan_rp | Triggers resource pools scan with value 1 |
Datacenter
Module activation or deactivation parameters
The following modules can be enabled or disabled in the configuration file using "enabled" or "disabled".
| ping | Checking ping to the machine that supports vCenter |
| check443 | Checking port 443 on the machine that supports vCenter |
Datastore
Module activation or deactivation parameters
The following modules can be enabled or disabled in the configuration file using "enabled" or "disabled".
| capacity | Maximum capacity of the datastore in bytes |
| freeSpace | Percentage of free space on the datastore |
| overallocation | Percentage of disk overallocation |
| freeSpaceBytes | Amount of free disk space in bytes |
| dsPathStatus | Datastore path status |
ESX
Module activation or deactivation parameters
The following modules can be enabled or disabled in the configuration file using "enabled" or "disabled".
| diskRead | Kb/s disk read rate |
| diskWrite | Rate of Kb/s written from disk |
| kernelReadLatency | Disk read latency in milliseconds |
| kernelWriteLatency | Disk write latency in milliseconds |
| deviceReadLatency | Time it takes for a storage device to respond to a data read request |
| deviceWriteLatency | Time it takes for a storage device to respond to a data write request |
| cpuInfo | General CPU information (creates a module for each ESXi CPU) |
| pciDevice | Number of assigned PCI devices |
| hbaDevice | Number of HBA (Host Bus Adapter) devices assigned to a virtual machine |
| pnicInfo | Information related to the physical network adapters (PNICs) that are configured on the ESXi host |
| vnicInfo | Information about the virtual network interfaces of the host |
| cpuUsagePercent | Percentage of current CPU usage on the host |
| memoryUsagePercent | Percentage of current RAM usage on the host |
| diskRate | Read and write data transfer rate on the host virtual disk |
| maxDiskLatency | Maximum I/O latency time on the virtual disk of the host |
| netUsage | Network data transfer rate on host virtual disk |
| systemHealthInfo | Information about the general health status of the system |
| netReceived | Amount of data received through the host network interface. netTransmitted Amount of transmitted data |
| netTransmitted | Amount of data transmitted over the host network interface |
| netPkgRx | Number of network packets received over the host network interface. netPkgTx Number of network packets received over the host network interface |
| netPkgTx | Number of network packets transmitted over the host network interface |
| pathStatus | Paths state |
VM
Module activation or deactivation parameters
The following modules can be enabled or disabled in the configuration file using "enabled" or "disabled".
| virtualImagePath | Path of the virtual disk image associated with a particular virtual machine |
| toolsRunningStatus | Running status of VMware Tools on a virtual machine |
| host | hosting the virtual machines in a virtualization environment |
| connectionState | Connection status between a virtual machine and its ESXi host in a virtualization environment |
| guestState | State of the virtual machine in terms of its operating system and running applications |
| guestOS | Operating system running on the virtual machine |
| hostName | Name of the physical host on which the virtual machine is running |
| powerState | Displays whether the virtual machine is powered on or off |
| triggeredAlarmState | Displays the status of the alarms triggered in the virtual machine |
| bootTime | Displays the date and time the virtual machine started |
| vcpuAllocation | Number of virtual CPUs allocated to the virtual machine |
| cpuAllocation | Number of CPU resources assigned to the virtual machine |
| consumedOverheadMemory | Amount of memory used by the host to perform tasks related to the virtual machine |
| hostMemoryUsage | Amount of memory used by the host to perform tasks related to the virtual machine |
| maxCpuUsage | Maximum CPU usage in the virtual machine |
| maxMemoryUsage | Maximum memory usage in the virtual machine |
| memoryMBAllocation | Amount of RAM memory allocated to the virtual machine |
| memoryAllocation | Amount of memory allocated to the virtual machine |
| uptimeSeconds | Total time that the virtual machine has been running |
| memoryOverhead | Amount of memory used by the host for monitoring and management tasks of the virtual machine |
| overallCpuDemand | Total number of CPU resources requested by the virtual machine |
| overallCpuUsage | Total amount of CPU resources used by the virtual machine |
| privateMemory | Amount of memory used by the virtual machine for its private processes |
| sharedMemory | Amount of memory shared between the virtual machine and the host |
| diskUsed | Amount of space used on the virtual disk of the virtual machine |
| provisioningUsed | Amount of space used in the virtual machine's provisioning storage |
| macAddress | MAC address assigned to the virtual machine's network interface |
| ipAddress | IP address assigned to the virtual machine's network interface |
| heartbeat | State of the virtual machine's heartbeat |
| cpuReady | Amount of time the virtual machine is waiting for the CPU |
| snapshotCounter | Number of snapshots created for the virtual machine |
| totalReadLatency | Total latency time for reading the virtual disk of the virtual machine |
| totalWriteLatency | Total write latency time of the virtual disk of the virtual machine |
| cpuUsagePercent | Percentage of current CPU usage in the virtual machine |
| memoryUsagePercent | Percentage of current RAM memory usage in the virtual machine |
| diskRate | Data transfer rate of reading and writing data on the virtual disk of the virtual machine |
| maxDiskLatency | Maximum I/O latency time on the virtual disk of the virtual machine |
| netUsage | Network data transfer rate in the virtual machine |
| systemHealthInfo | Information about the overall system health status |
| netReceived | Amount of data received through the virtual machine's network interface |
| netTransmitted | Amount of data transmitted through the virtual machine's network interface |
| netPkgRx | Number of network packets received through the virtual machine's network interface |
| netPkgTx | Number of network packets transmitted over the virtual machine's network interface |
| snapshotCounter | Number of snapshots of the virtual machine |
| snapshotDate | Date of each snapshot |
RP
Module activation or deactivation parameters
The following modules can be enabled or disabled in the configuration file using "enabled" or "disabled".
| cpuUsageMhz | CPU usage in MHz of the Resource Pool. |
| memActive | Active memory in use. |
| memGranted | Memory assigned to the Resource Pool. |
| memShared | Memory shared between virtual machines. |
| memSwapped | Memory swapped to disk. |
| memVmmemctl | Memory reclaimed through ballooning. |
| memOverhead | Memory used by VMware for management. |
Rename
The renaming of entities is done through the RENAME token and allows to rename the entities discovered by the plugin. When using this functionality, the agents created in Pandora FMS will appear with the new assigned name. The structure of this section is as follows:
<current name> TO <new name>An example of a configuration in this section could be the following:
 #Rename entities
 Rename
 Debian 11 TO Virtual Machine 1
 RedHat 12 TO Web server
 ESX Workstation TO Host Work Sales
Header
In header you can add a prefix to each agent name, which can be useful for a faster identification of these in pandora. The syntax of each block is :
dc <prefix>
ds <prefix>
esx <prefix>
vm <prefix>
rp <prefix>
An example may be the following :
dc DC_
ds DS_
esx ESXi_
vm VM_
rp RP_
In this example, all virtual machine agents would have a name with the following structure:
VM_<agent_name>Reject
It is used to discard the monitoring of specific virtual machines or ESX, each entity to disable monitoring must be specified in the configuration file, below this block, in a different line for each entity.
An example can be the following:
Reject
gridNode
Vm_apx
Vm_acr
It is also used to disable the IP scanning of the agents, it is used with this parameter.
| all_ipaddresses | Disables scanning of IP addresses with value 1 |
Example configuration file
Configuration
server 192.168.80.36
datacenter ha-datacenter
user pandora
group Applications
use_encrypted_password 0
interval 300
pass HhVGFJk!H
threads 5
event_mode 0
retry_send 0
virtual_network_monitoring 0
recon_interval 300

monitor_exclusive_agents 0
exclusive_esx []
exclusive_datastores []
exclusive_vm []
exclusive_rp []

scan_datastore 1
scan_datacenter 1
scan_esx 1
scan_vm 1
scan_rp 1

logfile /tmp/tmp_discovery.taskMD5.log
entities_list /tmp/tmp_discovery.taskMD5.entities
event_pointer_file /tmp/tmp_discovery.taskMD5.events
temporal /tmp
transfer_mode tentacle
tentacle_ip 127.0.0.1
tentacle_port 41121
tentacle_opts
local_folder /var/spool/pandora/data_in
pandora_url http://127.0.0.1/pandora_console/
api_pass pandora
api_user admin
apipandorapass 1234

Rename
venger TO esx_venger
SSD100GB TO disk_store_1

Reject
gridNode
Vm_apx
Vm_acr
About monitoring:
Entity scan
Due to the size of the VMware® infrastructures of the enterprise client, a general scan of all available entities in each run could trigger performance issues.
To avoid this situation, the VMware monitoring plug-in has the entity file ( entities_list)where it stores the list of entities scanned in the first run).
As long as this file exists, monitoring will be limited to the entities indicated in the file.
Monitoring configuration
The following sections of the file configure the modules created for each type of entity. These sections use the Datacenter, Datastore, ESX and VM sections. In these sections you can enable and disable the modules to be monitored. The following example contains a configuration according to the modules that would be created for ESX and virtual machines.
 ...
 #ESX Modules
 ESX
 cpuUsagePercent disabled
 diskRead enabled
 diskWrite enabled

 #VM Modules
 VM
 diskReadLatency disabled
 diskWriteLatency disabled
 diskRate enabled
 ...
Each configuration line is a module. Although in the example above, all modules are created with default values. You can configure the following values: 'Name', 'description' and 'limits' for the 'warning' and 'critical' states. An example of this type of configuration would look like the following:
 ...
 #VM Modules
 VM
 diskReadLatency disabled
 diskWriteLatency disabled
 diskRate name = Disk Rate; desc = Lec Rate/Esc disk; limits_warn = 5 10; limits_crit = 0 4
 ...
The available options for the module configuration are these:
<module> disabled: The module will NOT be created.
<module> enabled: The module WILL be created (with default values)
<module> name = <name>; desc = <description>; limits_warn <lim_warn>; limits_crit <lim_crit>"
Some modules when enabled in the plugin can generate multiple modules within their agents. For those cases when specifying a custom name for the module you can use the string "%s" to be replaced by an identifier of the element in each case. These modules and their identifiers are:
- ESX:
- cpuInfo: Index.
- pciDevice:Device name
- hbaDevice: Device name
- pnicInfo: Device name
- vnicInfo: Index.
- systemHealthInfo: Sensor type and name
- disksState: Device name
- VM:
- diskUsed: Disk name (if any) or index
- macAddress: Index.
- ipAddress: Index.
- snapshotDate: Snapshot name.
Use example
#VM Modules
VM
diskUsed name = Disk %s Used Percentage ; desc = Disk Used %; limits_warn = 80 90; limits_crit = 90 100
The module will be created with the given name and description. The module will define thresholds for 'maximum' and 'minimum' for critical and warning states.
It is also possible to configure text strings for the limits of the Warning and Critical states of the Modules. The configuration would look like the following:
powerState name = Operating Status; desc = Operating Status VM; limits_warn = .*suspended.*; limits_crit = .*poweredOff.*Custom Performance Metrics
It is possible to configure new modules related to Performance Counters for virtual machines and ESX. To configure a new performance module you will need to use the following structure within the ESC or VM blocks of the configuration file:
custom_performance type = mem; metric = swapinRate; module_type = generic_data; name = Swap In Rate; desc = Swap In Rate for host; limits_warn = 0 0; limits_crit = 0 0The parameters to be configured are:
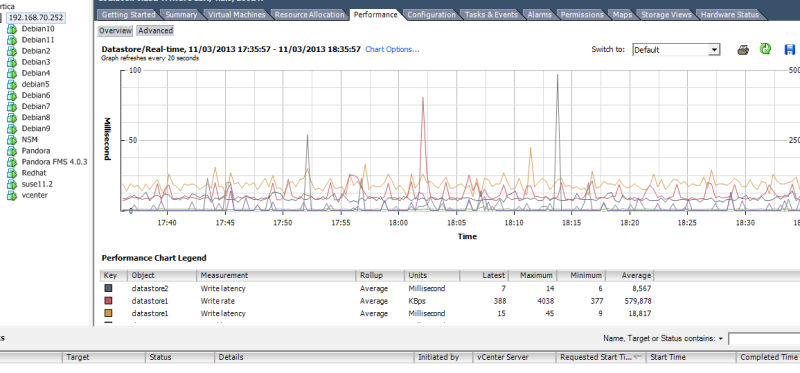
To see the complete list of all metrics according to their type you should click on the Advanced button and then on the Char option button. You will see a list with all the metric types and the respective metrics of each type:
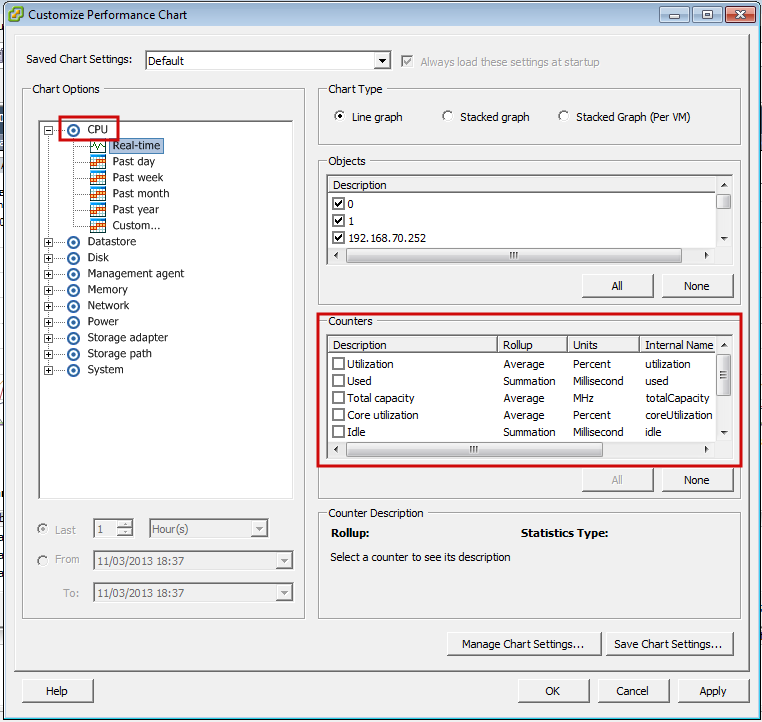
For each type of metric, a series of counters will appear, which are the variables that can be monitored with Pandora FMS. To monitor a variable we need its Internal Name. You should also make sure that the statistics level, configured in the vCenter, allows to show the variable we are looking for, comparing it with the Collection Level field of the metric.
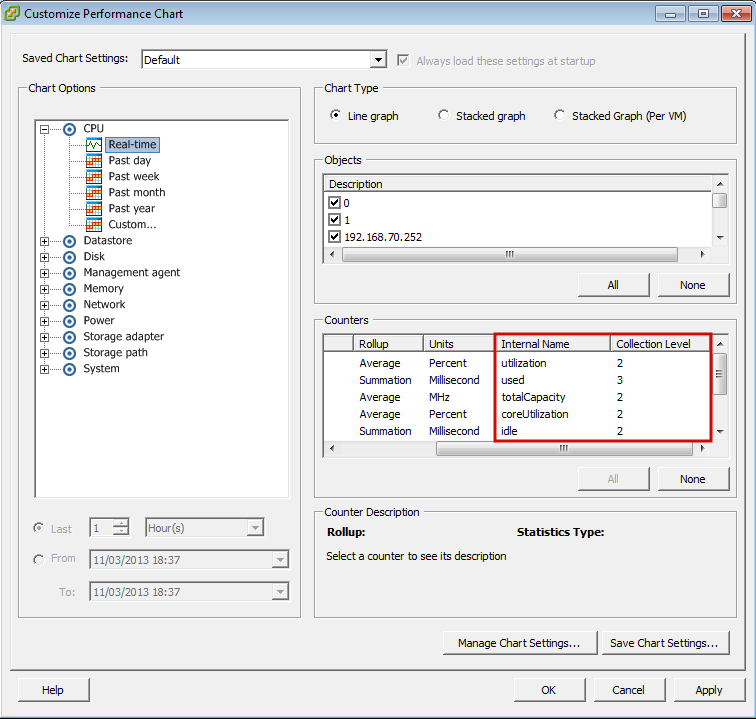
For example, if you need to see the CPU usage of an ESX host, we will look for the cpu type variables for an ESX and from the available ones we will choose utilization. The line you have to add to the configuration file (in this case inside the ESX section) will be the following:
custom_performance type = cpu; metric = utilization; module_type = generic_data; name = CPU Utilization; desc = CPU Utilization for ESX; limits_warn = 0 0; limits_crit = 0 0VMware® virtual architecture management and visualization
Two extensions are distributed together with the VMware® plug-in: VMware Manager® and VMware View®. VMware View® allows you to visualize all components of the VMware® architecture in a convenient way. In addition, with VMware Manager® you will be able to manage virtual machines by stopping, starting, resetting or suspending their activity from the Pandora FMS Console.
Using VMware View
To start using the VMware® architecture viewer go to Monitoring → VMware view.
If you do not have any device to monitor or you have not configured the vCenter® and ESXi VMware® API you will get something similar to the following image:
If the plugin is in operational state you will get this message (click the Show button):
The VMware View® extension will show you a map similar to the one below with the entire VMware® architecture.
The map contains the elements of the VMware® architecture (virtual machines, ESX, DataStores and DataCenters) with different icons that identify them, as well as the status of the Pandora FMS Agents that represent each element. In addition, the relationship between virtual machines, ESX and DataCenter is shown. In this way, at a glance you can see the status of the VMware® architecture in a simple way.
This extension has some options that help to improve the visualization of the architecture by hiding elements, increasing the font size and allowing to zoom in to see the elements in more detail.
Using the above options you can show only the DataCenter and ESX.
VMware View Dashboards
VMware View® provides two additional views in addition to the topology map view of the virtual architecture. The new tabs allow you to switch between the different views of the VMware View®.
The first view is a general dashboard where you can see at a glance the overall status of the virtual architecture in numbers, i.e. how many virtual machines, ESXi hosts or DataStores have problems. You will also be able to see general performance parameters thanks to graphs showing the 5 virtual machines that consume the most memory, CPU, disk and network of the entire virtual architecture.
The second view allows you to see the performance parameters of each ESX host. In this view you can choose an ESX host for which a dashboard will be loaded showing the status of the host and virtual machines, as well as performance metrics related to CPU, memory, disk and network usage of the ESXi host. In addition, this view also provides graphs showing the virtual machines that consume the most resources (CPU, memory, disk and network) on the selected host.
VMware View Options Tab
The VMWare extension is included together with Pandora FMS Console Enterprise. It has a configuration panel to set dashboard and map options:
You will be able to adjust the view thresholds (minimum - maximum) of the dashboard graphs.
You can adjust the default map view settings.
Contains a link to the configuration management system.
Accessible from the VMWare View® options tab:
Using the VMware Manager extension from Agents
To use the VMware® Manager extension you must go to the operation view of an Agent that corresponds to a virtual machine in that architecture. Within this view you will see an icon with the VMware® symbol that corresponds to the extension.
The VMware® Manager extension allows to manage virtual machines from the Pandora FMS Console. The extension shows the current status of the virtual machine with a color code:
Green = On (virtual machine running).
Orange = Suspended (virtual machine whose execution is paused).
Gray = Stopped (virtual machine is not running).
In addition, in a combo box it shows the available statuses and allows you to change the virtual machine status to the selected one by clicking on the Change Status button.
Selecting the Stop status and pressing Change status:
This will cause the virtual machine execution to stop and the VMware Manage extension view will change, thus showing that the virtual machine is now stopped:
If you have configured monitoring using RENAME this utility will not work against renamed targets.