
Introduction
This document aims to describe the monitoring of datacenters, datastores, exsi hosts and virtual machines with Pandora FMS using the pandora Vmware plugin through discovery.
VMware architecture monitoring
With this system, it is possible to monitor architectures such as the following.
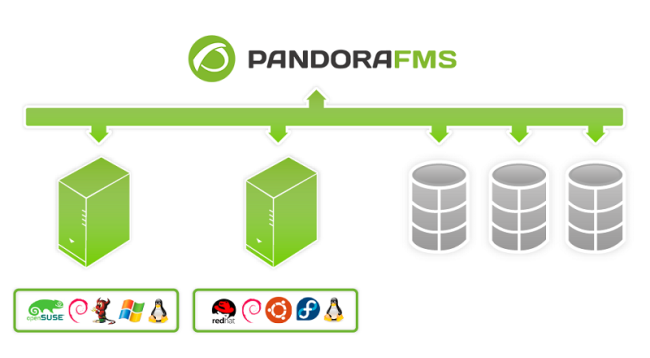
Pandora FMS can monitor VCenter, ESXi servers and the components that virtualize Datastores and Virtual Machines. Pandora FMS is based on the API provided by the pyvm library and one of the official Vmware SDKs for data collection.
The monitoring of a VMware environment can be divided into several important aspects to have a complete view of the performance and health of the environment.
Main aspects of monitoring a VMware environment
Monitoring of virtual machines (VMs)
Virtual machines are the foundation of the VMware virtualization environment. Monitoring VMs is important to gain insight into VM resource usage, availability and performance. Some of the important metrics to monitor are CPU, memory, storage and network usage.
ESXi Monitoring
ESXi is the VMware hypervisor that runs on the physical server and provides the virtualization capability. ESXi monitoring is important to gain insight into resource utilization, host health and performance capability. Some of the important metrics to monitor are CPU, memory, storage, network, and host load utilization.
Datastores Monitoring
Datastores are the storage spaces on the ESXi hypervisor that store VM images and configuration files. Monitoring datastores is important to gain insight into storage usage, storage health, and performance capacity. Some of the important metrics to monitor are space usage, read and write transfer rate, and CPU and memory usage on storage.
Datacenter Monitoring
Datacenters are logical groups of virtualization resources that include ESXi hosts, clusters, networks and storage. Datacenter monitoring is important to gain insight into resource utilization, environment health and performance capacity. Some of the important metrics to monitor are resource availability, CPU, memory, storage and network utilization in the datacenter.
Advanced Statistics
By installing VMware Tools on a virtual machine, you enable the collection of advanced VM statistics. VMware Tools are a set of drivers and services that are installed on a virtual machine to improve its performance and manageability in a VMware virtualization environment.
Advanced VM statistics are detailed metrics that can be collected to monitor and optimize virtual machine performance. Some of the advanced statistics that can be collected include:
Hardware information.
VM hardware information includes details about the virtual machine's processor, memory, storage, and network. These details can be useful for identifying resource bottlenecks and optimizing VM configuration.
Performance information: Performance statistics include detailed metrics about the VM's CPU, memory, disk and network usage. These metrics can be useful for identifying performance bottlenecks and optimizing the VM configuration.
Event information
Event statistics include detailed information about events occurring in the VM, such as starts and stops, reboots, hardware and software errors, and more. This information can be useful for troubleshooting VM problems and improving VM stability and reliability.
To enable advanced VM statistics, VMware Tools must be installed on the virtual machine. Once VMware Tools are installed, you can enable advanced statistics in the VM configuration. To do this, follow the steps below:
Right-click on the virtual machine and select "Edit Settings".
Select "Advanced options" and click "Edit settings".
Select "Enable advanced statistics collection" and click "OK".
Once advanced VM statistics are enabled, you can view and analyze these statistics using VMware monitoring tools such as vCenter Server, vRealize Operations Manager, among others. This will allow you to gain a better understanding of VM performance and health and help you make informed decisions on how to optimize VM configuration to maximize VM performance and efficiency.
Configuring vCenter for monitoring
Discovery Applications VMware makes use of the metrics provided by the vCenter® and ESXi VMware® API. The availability of these metrics depends on the levels configured for statistics collection.
These levels can be changed in the vCenter Server Settings menu and in the Statistics option. For each time option and each level you will get the description of the counters collected by vCenter. The minimum level to monitor with the Pandora FMS plugin is Level 2.
Depending on the vCenter configuration, it is possible that some modules do not report data in Pandora FMS. This could be because:
Some plugin is missing to be installed in the vCenter.
It is necessary to install a VMware® agent (vmware-tools) in the entity.
Simply because the entity is turned off (virtual machine or ESXi).
To solve these problems you should consult the VMware documentation.
Some solutions, such as Hardware Status monitoring, may require advanced configuration of both vCenter and ESX-supporting hosts.