
Welcome to Pandora FMS Community › Forums › Community support › “Custom Graphs” – to show several graphs on one page
-
“Custom Graphs” – to show several graphs on one page
Posted by macach on May 19, 2019 at 22:20Hello
I need to show on “Custom Graphs” report several graphs.
Because all in one doesn’t look informative, cause I cant combine memory usage and host availability, for exampleHow to show few graphs in “Custom Graphs” report?
Thank you
macach replied 5 years, 7 months ago 2 Members · 5 Replies -
5 Replies
-
 ::
::Hello
I need to show on “Custom Graphs” report several graphs.
Because all in one doesn’t look informative, cause I cant combine memory usage and host availability, for exampleHow to show few graphs in “Custom Graphs” report?
Thank you
Good morning, macach
You can display the info you need by selecting the modules you want after creating your custom graph.
You’ll see a tool icon in the superior right corner of your custom graph view. With that option you’ll be able to choose any module you want for the graph to display.
Kind regards,
Eduardo.
-
::
Hello
I need to show on “Custom Graphs” report several graphs.
Because all in one doesn’t look informative, cause I cant combine memory usage and host availability, for exampleHow to show few graphs in “Custom Graphs” report?
Thank you
Good morning, macach
You can display the info you need by selecting the modules you want after creating your custom graph.
You’ll see a tool icon in the superior right corner of your custom graph view. With that option you’ll be able to choose any module you want for the graph to display.
Kind regards,
Eduardo.
Hello Eduardo.
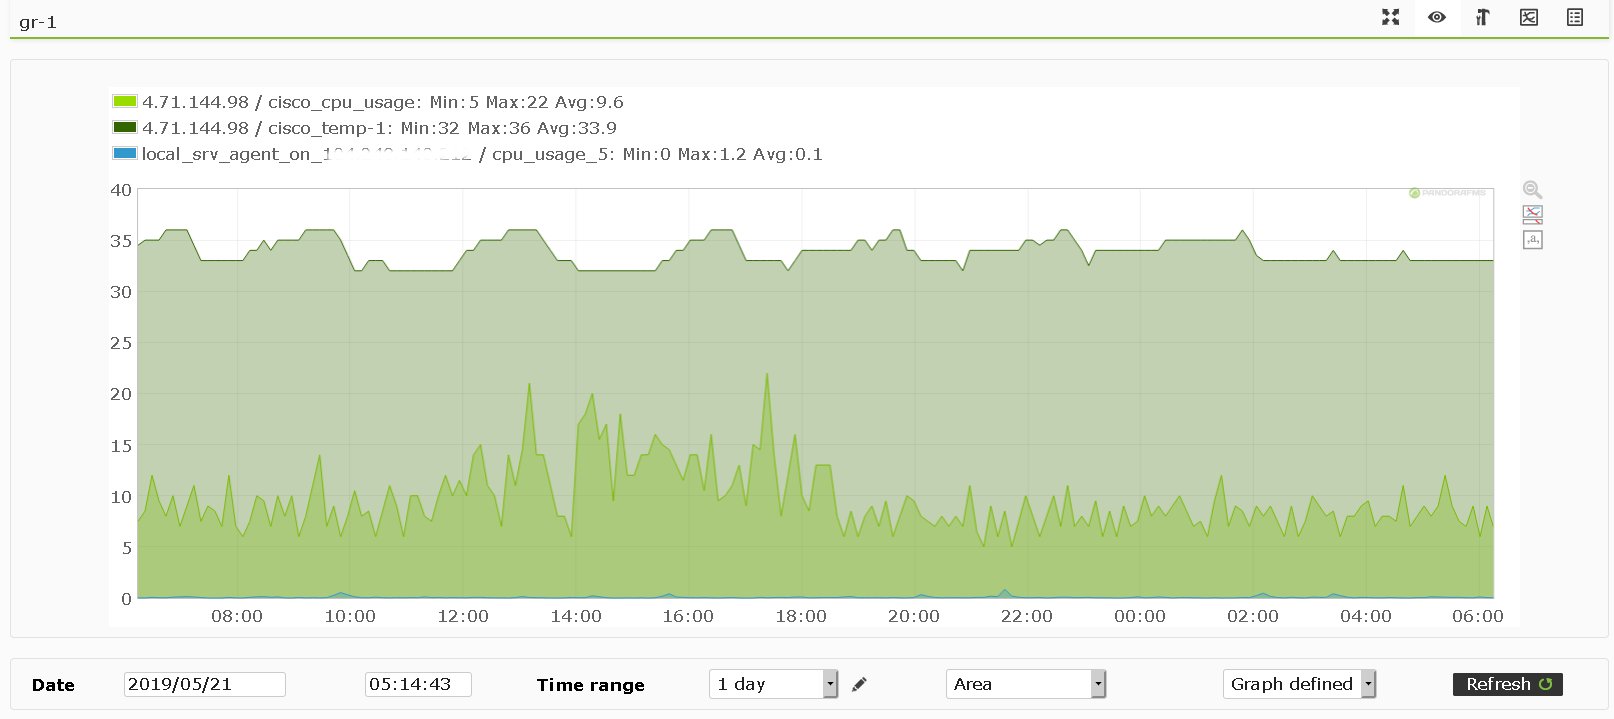
Yes that is true – I can choose modules, but within one report all data shows on the same graph.
I need to separate them
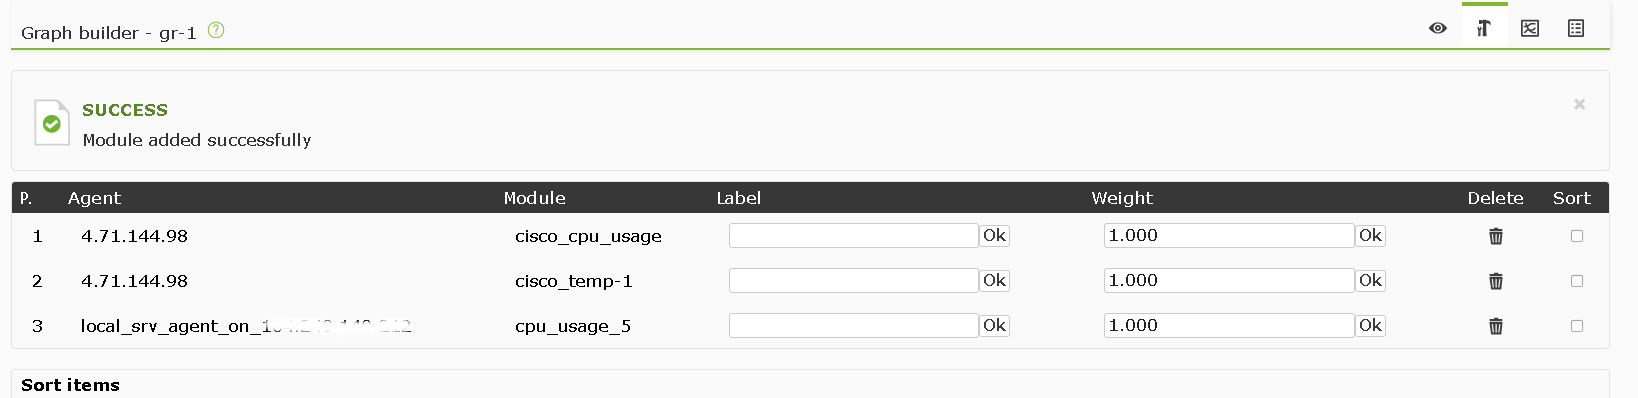
Look:
-
::
Hello
I need to show on “Custom Graphs” report several graphs.
Because all in one doesn’t look informative, cause I cant combine memory usage and host availability, for exampleHow to show few graphs in “Custom Graphs” report?
Thank you
Good morning, macach
You can display the info you need by selecting the modules you want after creating your custom graph.
You’ll see a tool icon in the superior right corner of your custom graph view. With that option you’ll be able to choose any module you want for the graph to display.
Kind regards,
Eduardo.
Hello Eduardo.
Yes that is true – I can choose modules, but within one report all data shows on the same graph.
I need to separate them
Look:
Greetings, macach
Our team is working to fix the possibility to display graphs in a more customized way via Graph Containers.
Please keep an eye into future updates to see this feature enabled.
However, you always have the option to create different graphs and display them together creating a custom report adding every one of them. Then you’ll be able to see all your custom graphs in the same report, each of one returning a different value.
Best regards,
Eduardo.
-
-
::
Hello
I just updated to latest version.
Pandora FMS Build PC190429
Pandora FMS Version v7.0NG.734And again, there is not any possibility to create few graphs in the “Custom Graphs” report.
Developers, we can not put CPU usage and interface utilization in one graph.
You need to add, the possibility to make different graphs
Thank you

