
3. Detecting and monitoring new systems with Discovery
Pandora FMS Discovery tool provides a set of tools to simplify monitoring through wizards, including Discovery's Network Scan feature.
To use it, follow these steps. In the side menu go to "Discovery ->→ Host&Devices ->→ Network Scan"Scan section.
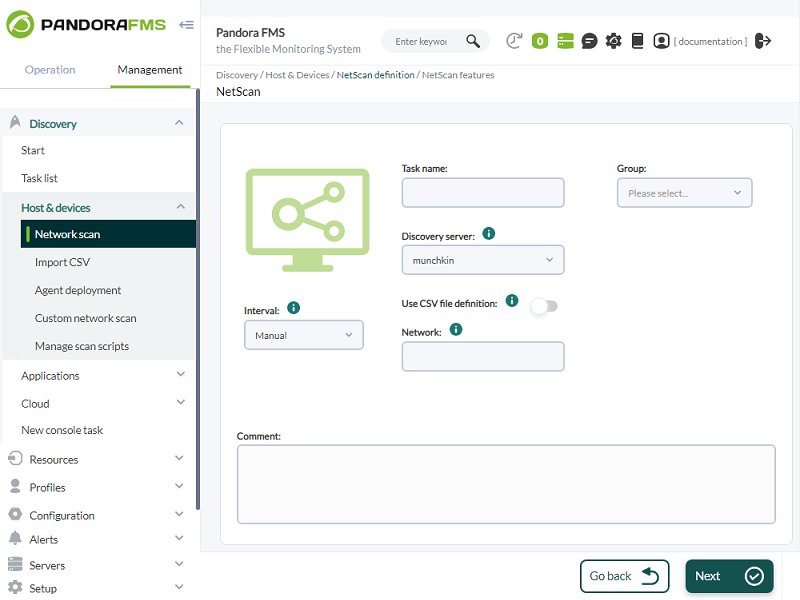
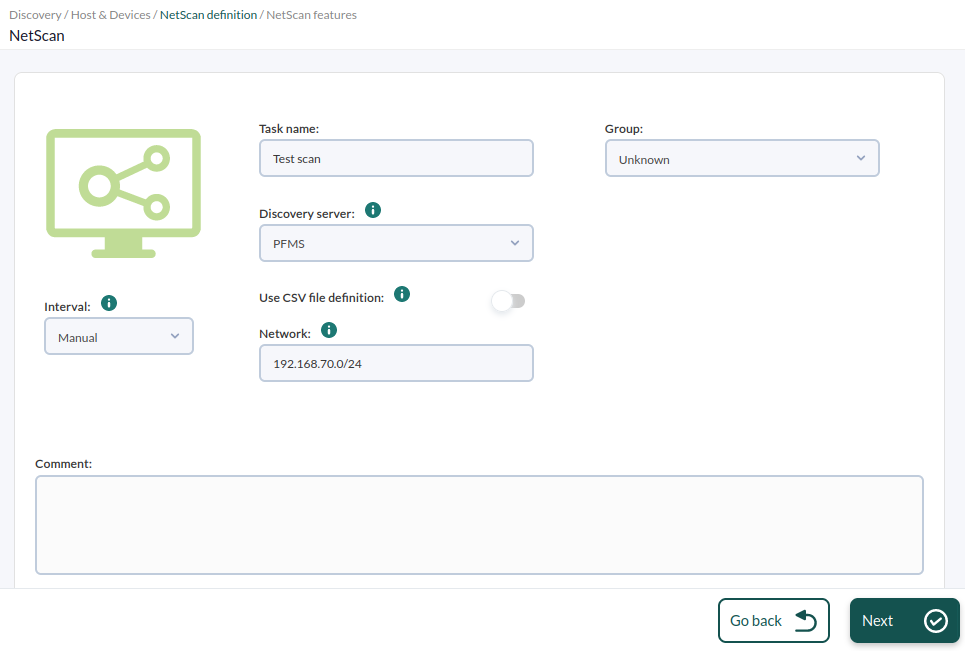
Create the task as follows: modify only the network range to be scanned, in this screenshot it is 192.168.70.0/24, which means that all hosts on the network 192.168.70.xx will be scanned. Select the "Unknown" group, which will be used to contain the devices you detect in that group. From now on we will overall call "agents" the devices managed and/or monitored by Pandora FMS.FMS will be called "agents".
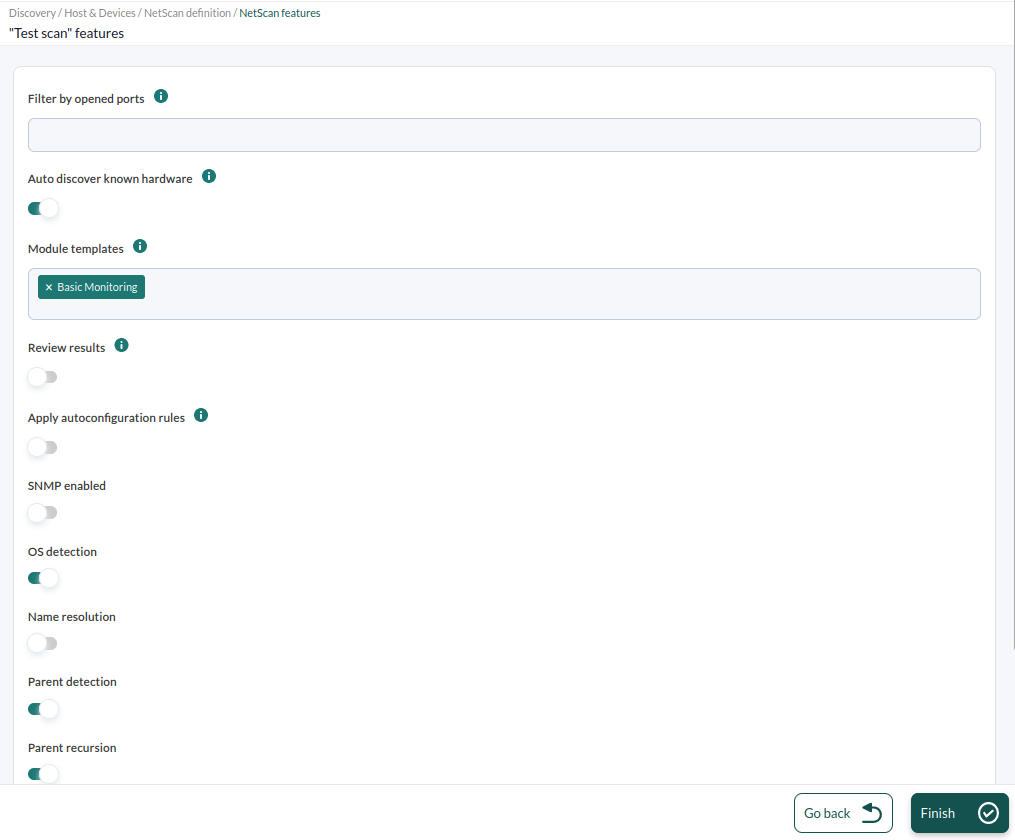
You may select different aspects of the initial monitoring that will be applied to the discovered devices. You may define different pre-configured templates, as you can see in the image. Choose the option "BASIC MONITORING" and leave unchecked the option "Review results". unchecked.
Once the recognition task is created, as it has been created with manual interval, start it manually. For that, force its execution in the discovery task list:
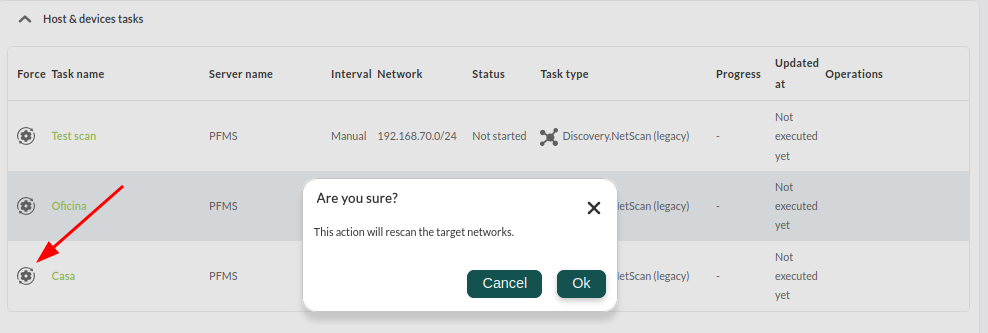
Its progress will be updated:
![]()
At any time, you may click on the magnifying glass icon to see the task details:
![]()
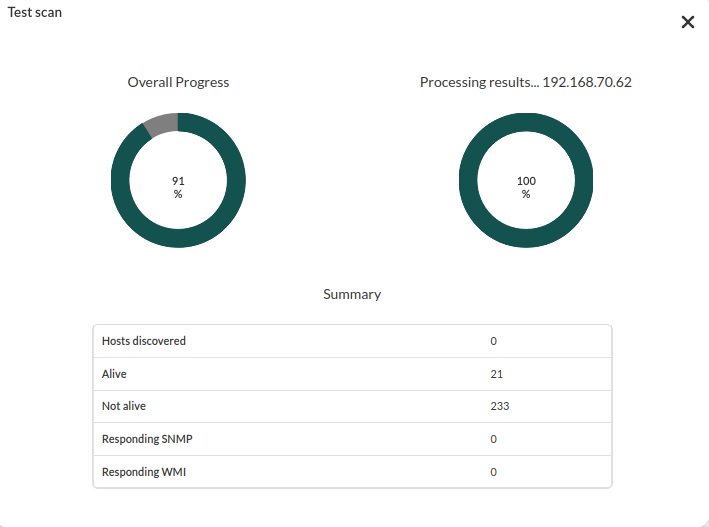
At this pointpoint, it is better to wait until the entire network hasis been detected.scanned. When it is finished, go to the agent detail view to see all the detected systems. Menu "Monitoring" > "Views" > " "Agent detail", as seen in the image:
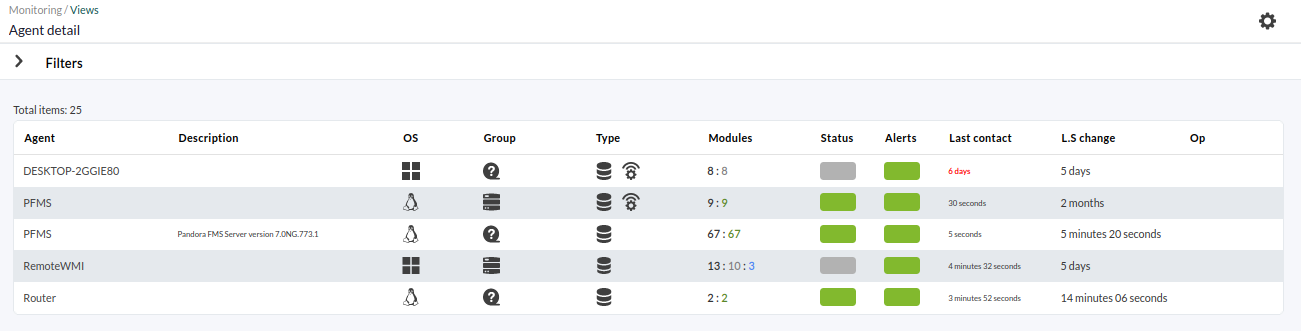
You will see several systems that have beenwere detected. In some cases, the name of the system will have been resolvedsolved (if it was possible by DNS) and in othersothers, the type of Operating System will have been detected, according to the options selected in the network scan carried out with Discovery. Clicking on the name will lead you to the agent detail view, which will show all the system information. In this case, the agent has only one module, the "Host alive" module, a check that verifies thatwhether the machine is "alive" and responds from the network, and the "Host Latency" module, which calculates the time it takes for the server to communicate with the machine:

If you do not need more monitoring or configuration, go to the metric alert here
Did you not achieve the results explained in this chapter? Go to help or support