
Introduction
This document aims to describe the monitoring of XenServer servers with Pandora FMS. Based on our experience in system monitoring, a series of parameters have been chosen to be monitored by default; later modifications can be made according to the needs of each client.
To broadly describe the XenServer architecture we can talk about three elements:
● The XenServers or hosts (Citrix calls the XenServers “hosts”, do not confuse VMs with hosts).
● The virtual machines or VMs that will be installed on a given host.
● The Storage Repositories or SRs that will also be associated with a specific host.
The information of these elements will be extracted through queries to the XenAPI and RRD queries. More information at https://pypi.org/project/XenAPI/.
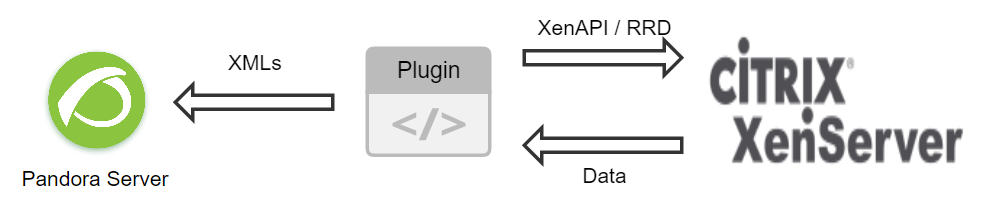
The plugin will make the queries to extract the information, select the required information and generate an XML document for each VM, for each host and for each SR. Each XML will contain the data of the parameters that we have decided to monitor for each element. These xml will be sent by Tentacle to Pandora server. Once these xml arrive at the server, in the web console we will see how a new agent is generated for each xml, and how in these agents a module is generated for each parameter that we are monitoring.
On the XenServer, port 443/TCP must be enabled so that API queries can be made. In addition, port 80/TCP (or the port through which http connections occur) must be enabled, so that the
DRR consultations.