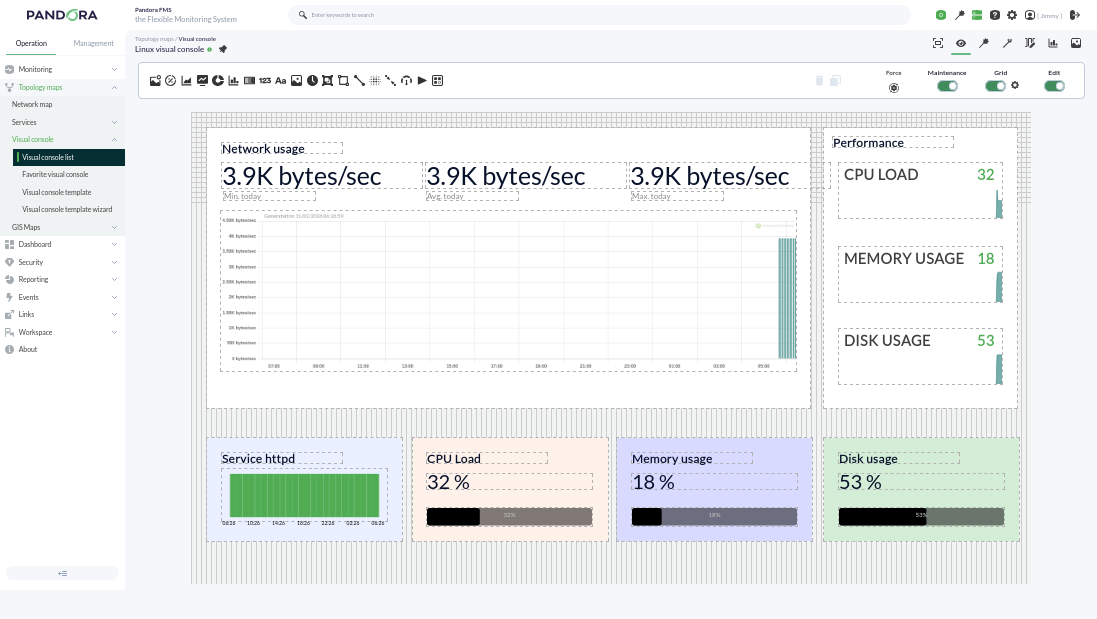
Visual Consoles
Pandora FMS offers the possibility of customizing how the monitoring carried out by the tool is visually represented. Within a Visual Console (Visual Console or simply VC), the following elements can be found:
- Static image: Image associated with a module/agent to view its status.
- Percentile element: In monitoring modules for finite resources (such as RAM, cache memory, etc.), where the resource is represented as 100 percent, it represents the checks of a module as a progress bar, although circular graphs can also be chosen.
- Module graph: Allows the visualization of an existing module's graph.
- Basic chart: Using the values received in the last hour, it shows a simple chart accompanied by the value and name of the corresponding module. Through the use of macros, more information such as the agent name or its IP address can be included.
- Serialized pie chart: Allows visualizing data from a module with up to 6 different elements, such as the number of times a module has gone through different statuses in the last day. Ideal for use with Agent plugins.
- Bar chart: You can select an agent and then one of its modules to show a simple graph with the values and data collected during monitoring.
- Event history graph: Allows visualizing the event histogram for a configured interval.
- Simple value: Allows visualizing a module's data in real time.
- Text label: Notice without content associated with an agent or modules.
- Icon: Simple image that can represent something (company logo, visual element like arrows, etc.).
- Progress: Allows visualizing the monitoring progress of a module.
- Clock: Allows adding a dynamic clock that displays the exact time at all times without having to reload the page.
- Group: Allows visualizing the status summary of a group of agents (statistics can be included).
- Box: If set with a transparent fill, it can be used to logically group other elements or used to highlight one or several of them with a different color.
- Line: Logically joins several elements (can be anchored to other elements).
- Color cloud: Allows representing heat maps depending on the data of an assigned module.
- Network link: Some elements need more than just a line; this link attaches to other elements and moves along with them, forming a bond.
- Odometer: Shows the current value of a module in the style of a speedometer.
- Action: Used as a button for the user for two purposes:
- Performing an API query to any other system that responds in JSON format for its graphic representation.
- Executing and validating alerts associated with modules.
- Service: Allows visualizing the status of a configured service.
Each element can be linked to another Visual Console for calculation purposes and final availability, and also to quickly access linked visual consoles. They also optionally include a grid to align elements:
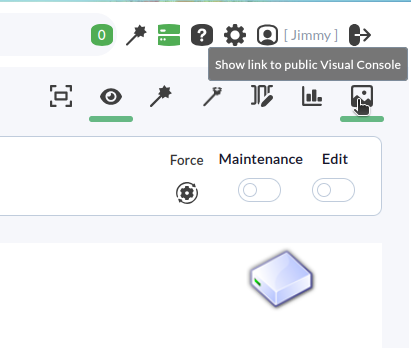
Visual Consoles have an additional functionality to share them via a public URL with any user outside of Pandora FMS: