
Presentation
Pandora FMS is a monitoring software that collects data from any system, generates alerts based on that data, and displays graphs, reports, and maps of our environment.
It is possible to monitor systems, servers, applications, networks, events, and a long list of devices. Pandora FMS collects the information that needs to be monitored, compiles it, and saves it for visual representation, with the goal of performing actions required by the systems. This tool can run on different GNU/Linux® operating systems, including popular ones like Ubuntu® and Rocky Linux®, the latter being the recommended operating system.
Pandora FMS consists of different elements for its proper operation:
- Database (DB): The place where the servers store the information collected by the different monitoring tasks, as well as the tool's configuration.
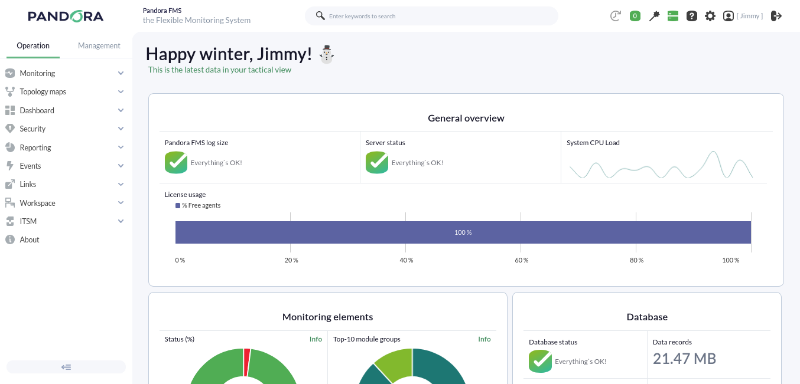
- Web Console (console): This is the web interface responsible for displaying the collected data and the primary method for user interaction with the tool.
- Servers (* Server): These are responsible for collecting and processing data. All or part of them, when located on the same real or virtual device, are referred to as Pandora FMS Server or simply PFMS Server.
In Pandora FMS version 800 LTS, there are more than ten different servers specialized in various monitoring tasks; from network servers for remote checks to web servers used for monitoring user navigation. The following servers exist:
- Data Server: Responsible for processing local monitoring information.
- Network Server: Responsible for executing remote monitoring tasks through network checks. Monitoring of MS Windows® environments. Responsible for determining if a piece of data, at the current moment and based on its history, is anomalous. It also performs full web checks.
- SNMP trap Server: Responsible for collecting and processing SNMP traps.
- Discovery Server: Responsible for exploring the network and detecting new systems in operation. Monitoring through DISCO packages with an extensive catalog of monitoring options.
- Heavy Server: Responsible for performing more complex remote monitoring using custom scripts (plugins). It carries out data export for replication purposes. It obtains and displays both software and hardware information from monitored systems (inventory).
- Event Server: Responsible for collecting events occurring in the system.
- Satellite Server: A server installed separately to explore and remotely monitor new systems unreachable by the main server.
- WUX Server: Responsible for performing complex web transactions in a distributed manner.
The Pandora FMS Web Console allows different users with various profiles to manage and operate the tool. With this web tool, you can monitor the status of current monitoring, view statistical information through graphs or reports, and manage incidents generated by monitoring.
Pandora FMS is governed by the use of ACL profiles, through which a user can only access information related to the profile they belong to. For example, an administrator will be able to access all information contained in Pandora FMS, while a user may only have access to data belonging to a specific group. If necessary, advanced ACL functionality can be activated.
All the elements described above that make up Pandora FMS (Web Console, PFMS Server, and database) are included in a single software package—except for the Satellite server—which makes the installation of the tool practical.
This package is updated every month with the release of new versions that may include new functionalities, bug fixes, and security improvements.
Next, we will provide a general description of some elements that make up Pandora FMS, as well as certain functionalities to help you learn more about the tool.