
Discovery
This plugin can be integrated with Pandora FMS Discovery.
To do so, you must load the ".disco" package that you can download from the Pandora FMS library:
https://pandorafms.com/library/
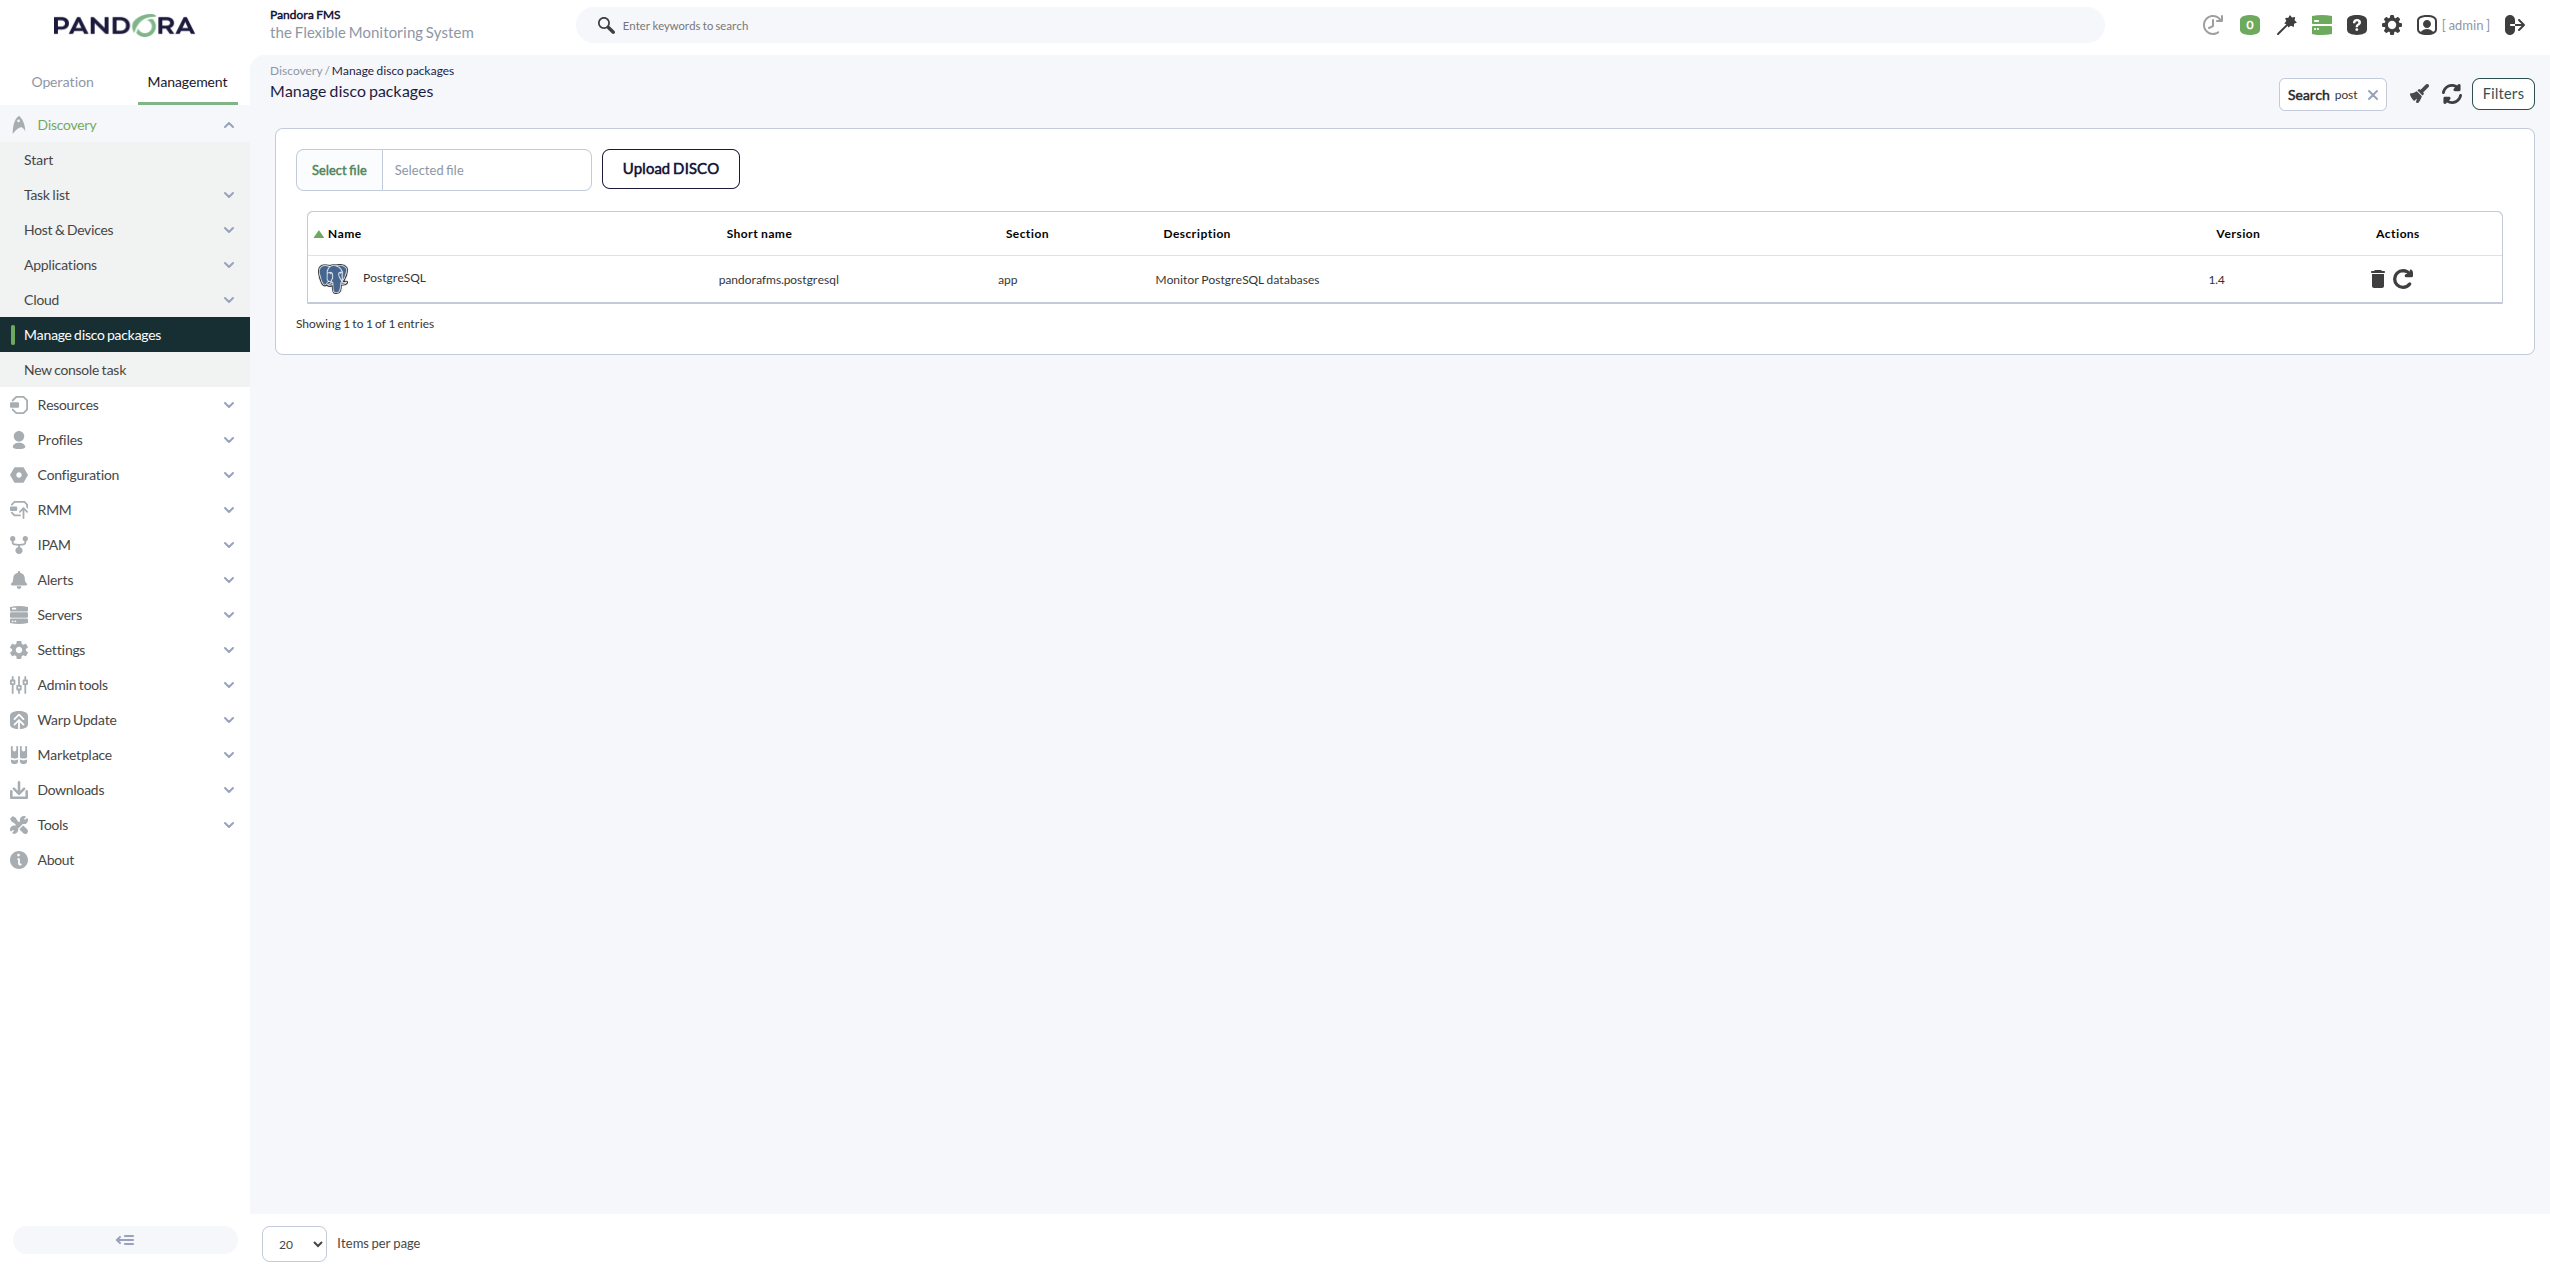
Once loaded, PostgreSQL environments can be monitored by creating Discovery tasks from the Management > Discovery > Applications section.
The following minimum data will be requested for each task:
- PostgreSQL target strings: List of PostgreSQL targets to be monitored by the task. It will be a
commacomma-separated orlineline-separated list. Each PostgreSQL targetdatabasecan be definedwithusing the format IP:PORT or IP. UserPostgreSQL Credentials:User ofCustom connection credentials used to access thetargetPostgreSQLdatabases.targets. Password:APasswordcredentialofpreviouslythecreatedspecifiedinuser.Management > Configuration > Credential store must be selected.
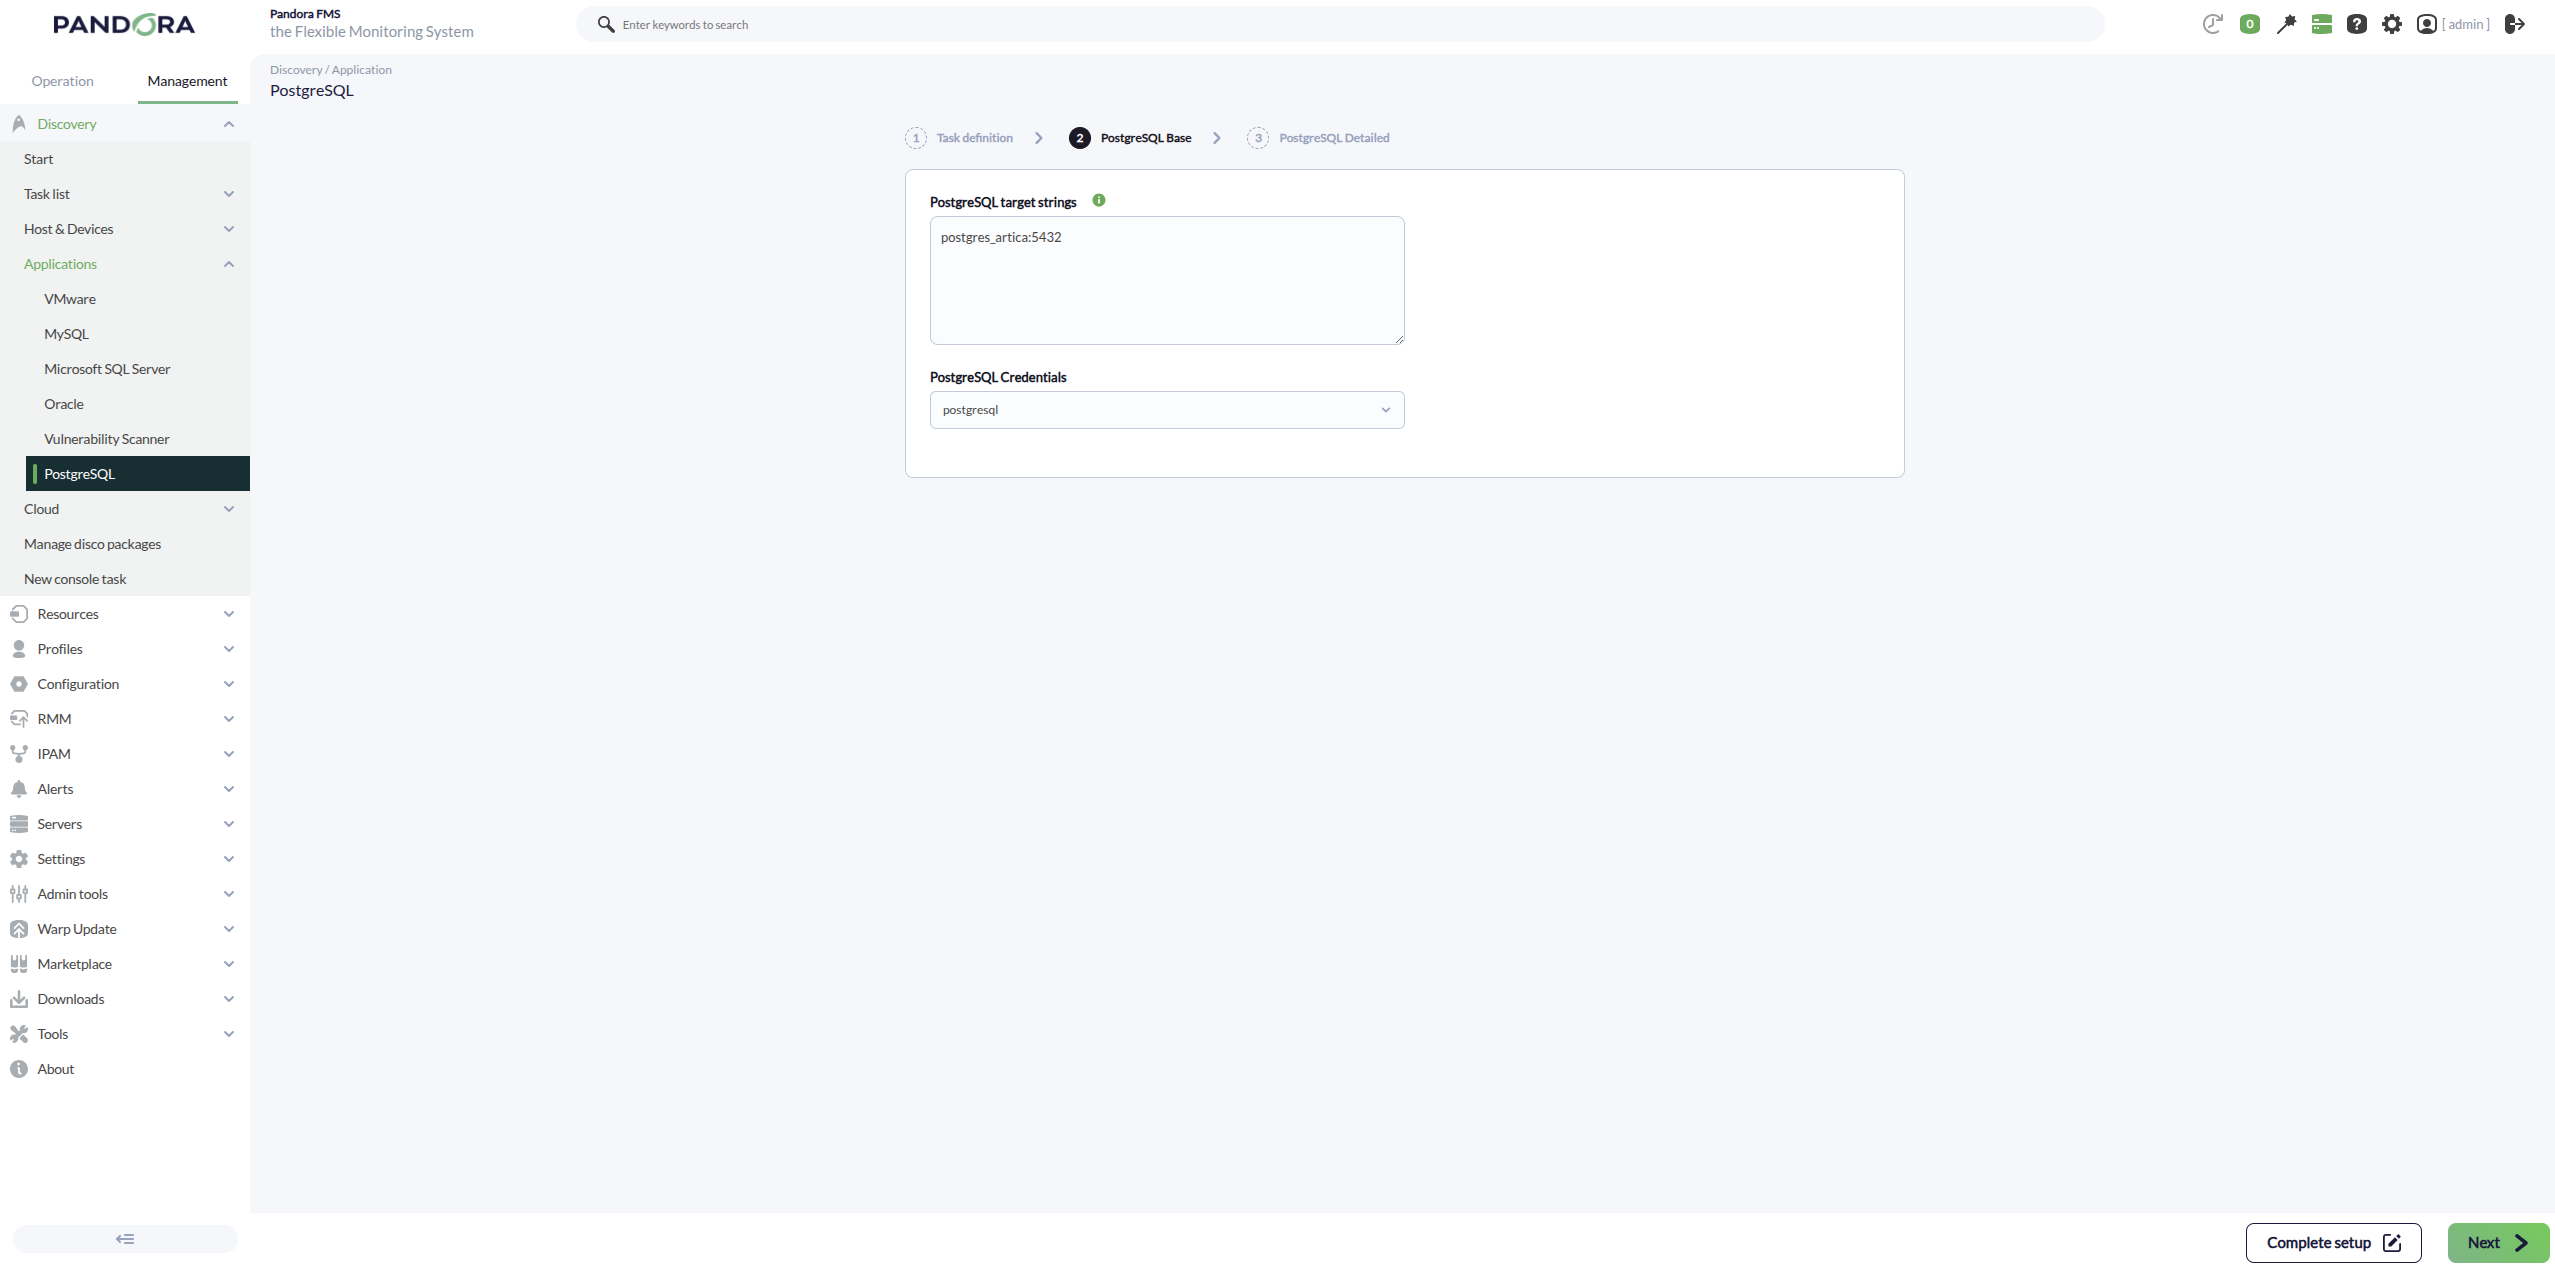
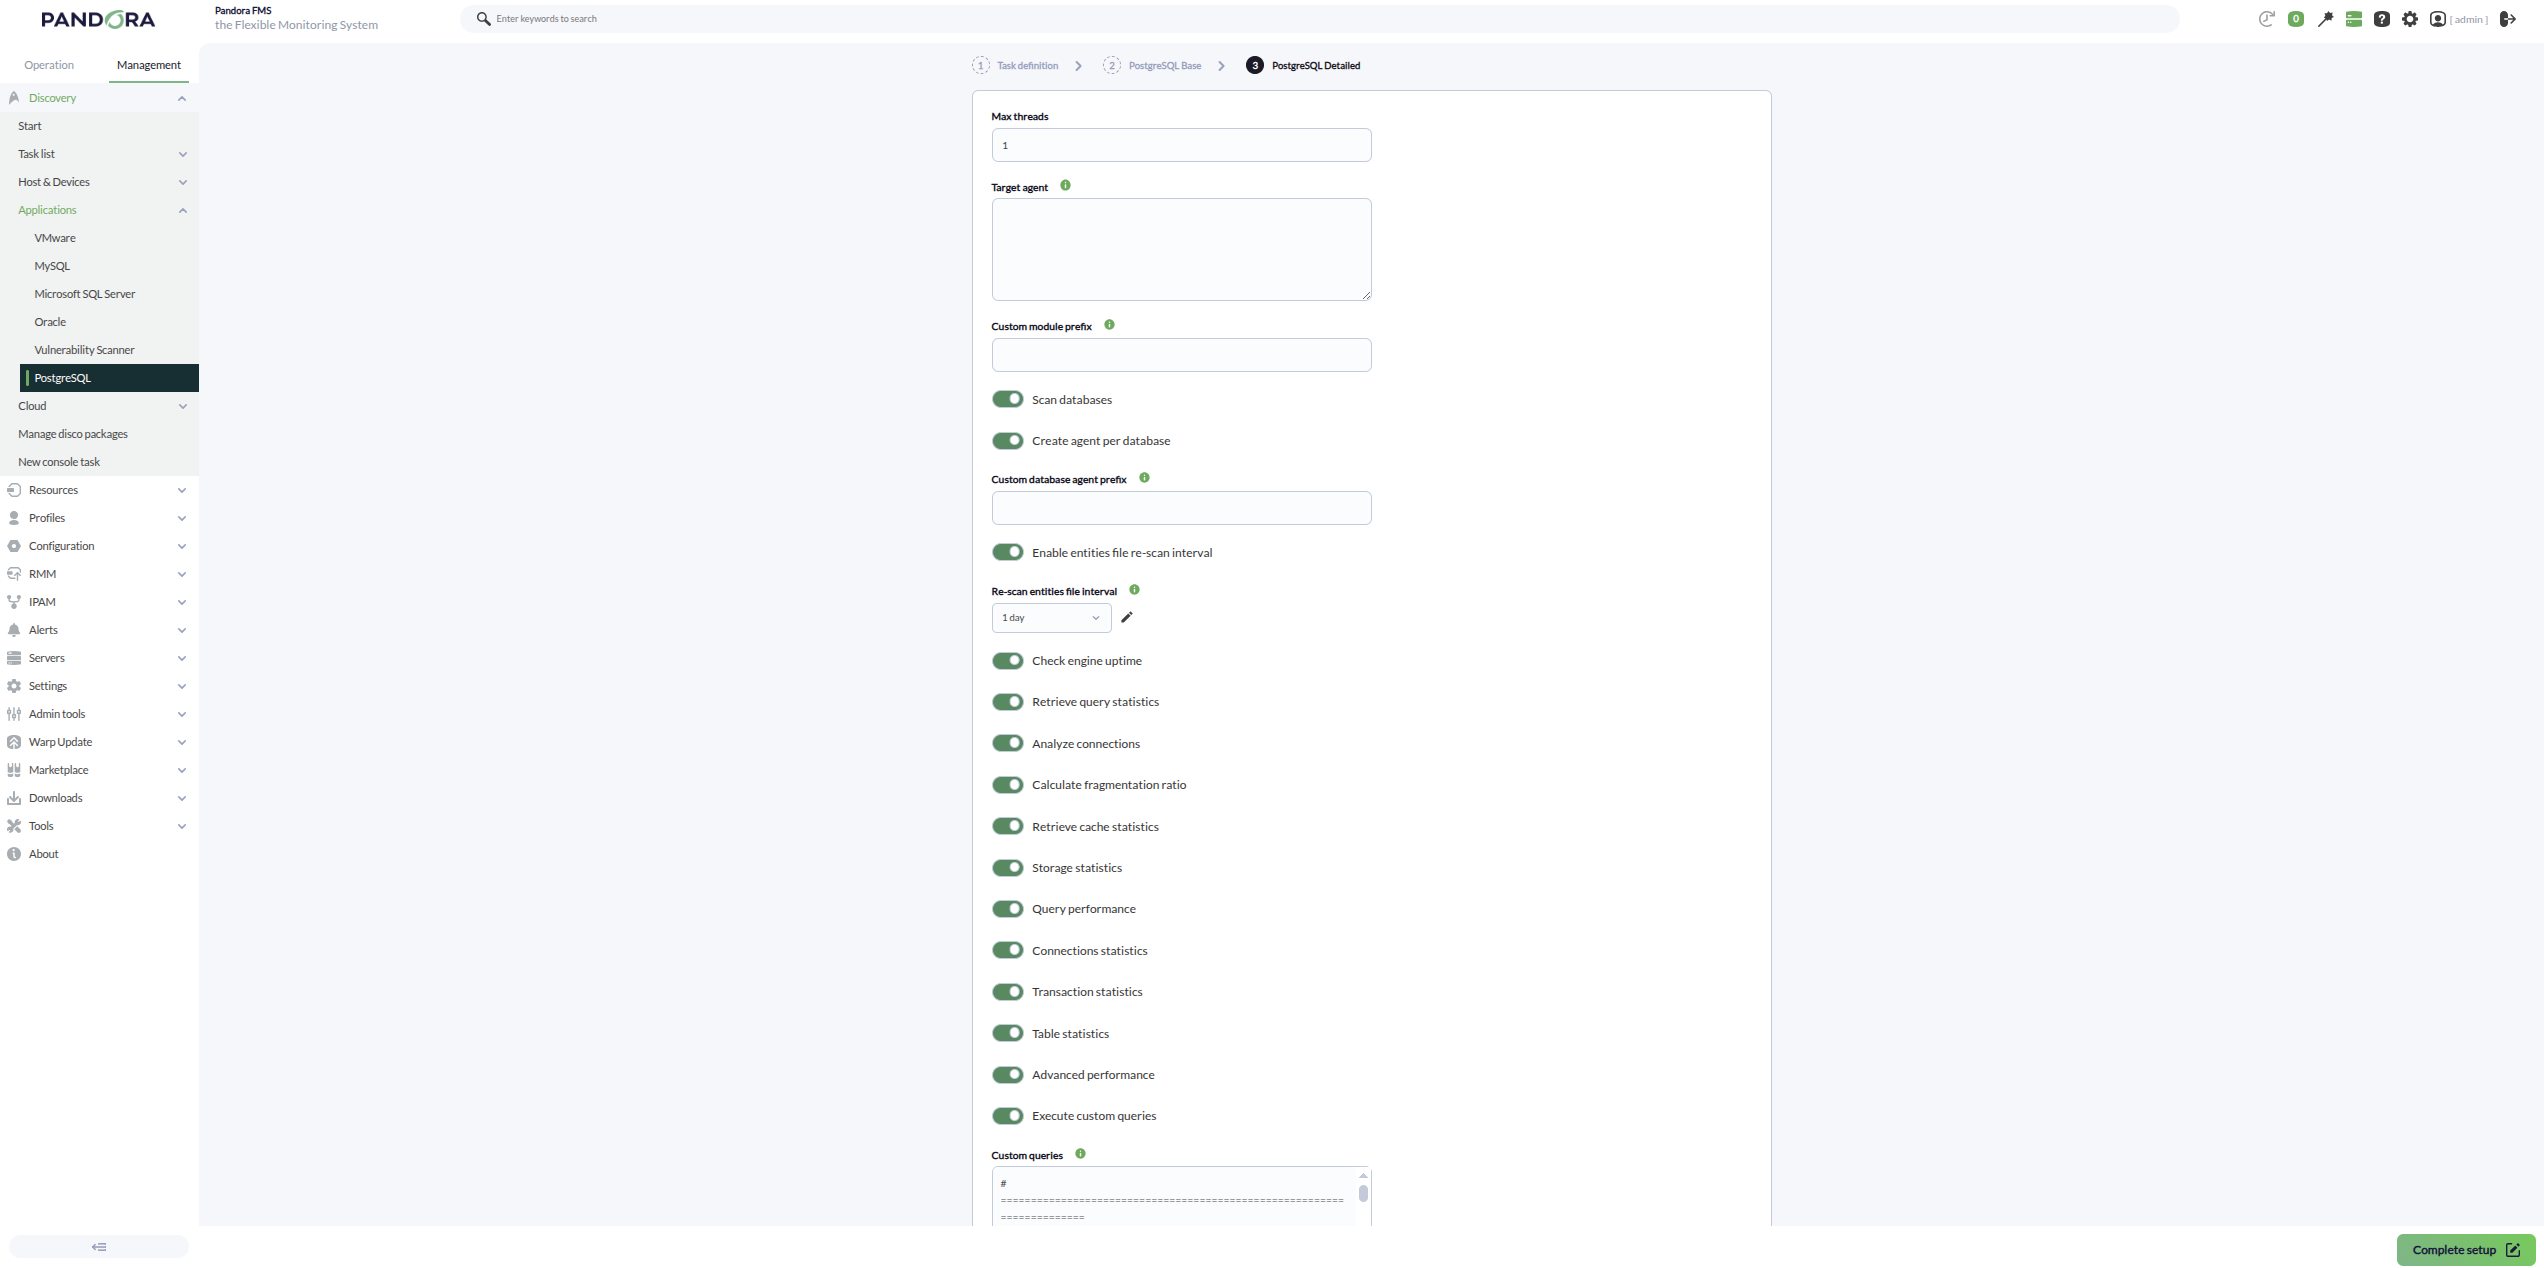
You can also adjust the task configuration to customize the desired monitoring:
- Max threads: To optimize execution time, multiple threads can be configured to monitor the task agents. Keep in mind that setting
upmultiple threadscanmay increasetheCPUusage of the task.
usage. - Target agent: List of target agents for the PostgreSQL targets to monitor.
That is, the names with which the agents of each objective defined in the task will be generated. It will be a list separated by commas or lines. The position of the names in the list should match the position of the PostgreSQL targets in your list, that is, the first name will be used for the first target and so on. If the list is separated by lines, blank lines will be ignored.If an agent name is not specified for a target, its IP or FQDN will be used as the agent name. - Custom module
prefixprefix::Text included as a prefix for all generated module names.It is useful to locate the modules generated by the task or distinguish them from others. - Scan databases: If
activated,enabled, thedifferentplugin will discover the databasesofavailable on each PostgreSQLtarget will be monitored.
target. - Create agent per database: If
activated,enabled, adifferentseparate agent will be created for eachdatabasediscoveredof each PostgreSQL target. Database monitoring needs to be enabled for it to work.
database. - Custom database agent
prefixprefix::Text included as a prefix for generated database agent names. - Enable entities file re-scan interval: If enabled, the
names thatplugin willbeusegeneratedaforpersistent discovered entities file to validate previously detected databases, even if they are no longer present in theindividualcurrentagentsscan. - Re-scan
eachentitiesdatabasefileofinterval:eachIntervalPostgreSQL target. It is usefulused tolocaterevalidate theagentsdiscoveredgeneratedentitiesby the task or distinguish them from others.
file. - Check engine uptime: If
activated,enabled,itengine uptime monitoring willmonitorbethe uptime of the objectives.
performed. - Retrieve query
statisticsstatistics::If enabled,itinstance-level query statistics willmonitorbequery statistics.
monitored. - Analyze
connectionsconnections::Ifactivated,enabled,itinstance connection usage willmonitorbethe connections.
monitored. - Calculate fragmentation ratio: If
activated it will monitor theenabled, fragmentation ratiostatistics.
statistics will be monitored. - Retrieve cache
statisticsstatistics::If enabled,itinstance cache statistics willmonitorbe monitored. - Storage statistics: If enabled, storage metrics for discovered databases will be monitored:
database size: Total database size.tables size: Total space used by tables.indexes size: Total space used by indexes.temp bytes: Temporary data written to disk.temp files: Number of temporary files created.
- Query performance: If enabled, query performance statistics will be monitored:
long queries: Long-running active queries.oldest query age: Execution time of the oldest active query.sequential scans: Number of sequential scans.index scans: Number of index-based scans.cache hit ratio: Database cachestatistics.
hit ratio.
- Connections statistics: If enabled, per-database connection statistics will be monitored:
active connections: Number of active connections.idle connections: Number of idle connections.total connections: Total number of open connections.
- Transaction statistics: If enabled, transaction activity will be monitored:
transactions: Total executed transactions.commits: Committed transactions.rollbacks: Rolled back transactions.rollback ratio: Rollback ratio.deadlocks: Detected deadlocks.conflicts: Detected database conflicts.
- Table statistics: If enabled, structural table statistics will be monitored:
table count: Total number of user tables.index count: Total number of user indexes.live tuples: Estimated active rows.dead tuples: Estimated obsolete rows pending cleanup.fragmentation ratio: Estimated table fragmentation ratio.
- Advanced performance: If enabled, advanced performance metrics will be monitored:
blocks read: Blocks read from disk.blocks hit: Blocks retrieved from cache.
- Execute custom queries: If
activated, it will allow you to executeenabled, custom queriestocaneachbe executed against the PostgreSQLtargetinstance andeachdiscovereddatabase.
databases. - Custom
queriesqueries::Configuration block used to definethecustom queries to be executed.Each query will generate a new module for each agent in the task.
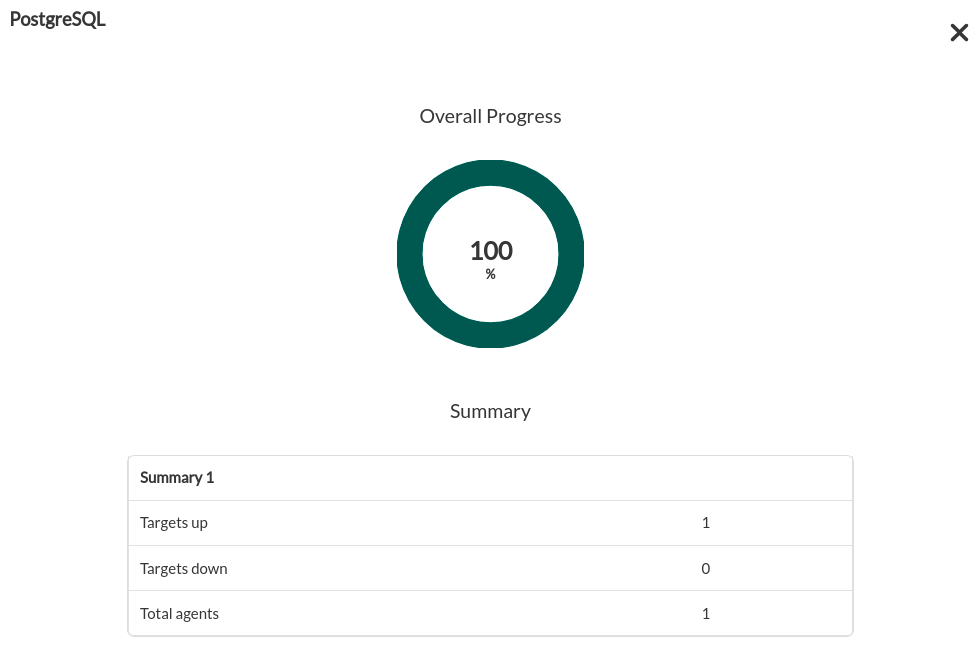
Tasks that are successfullySuccessfully completed tasks will haveprovide an execution summary with the following information:
- Total agents: Total number of agents generated by the task.
- Targets up: Total number of targets
tosuccessfullywhich it has been possible to connect.connected. - Targets down: Total number of targets
tothatwhich it hascould notbeenbepossible to connect.reached.
Tasks that are not completed successfully will have an execution summary recording the errors that occurred.