
Discovery
This plugin can be integrated with Pandora FMS Discovery.
To do so, you must load the ".disco" package that you can download from the Pandora FMS library:
https://pandorafms.com/library/
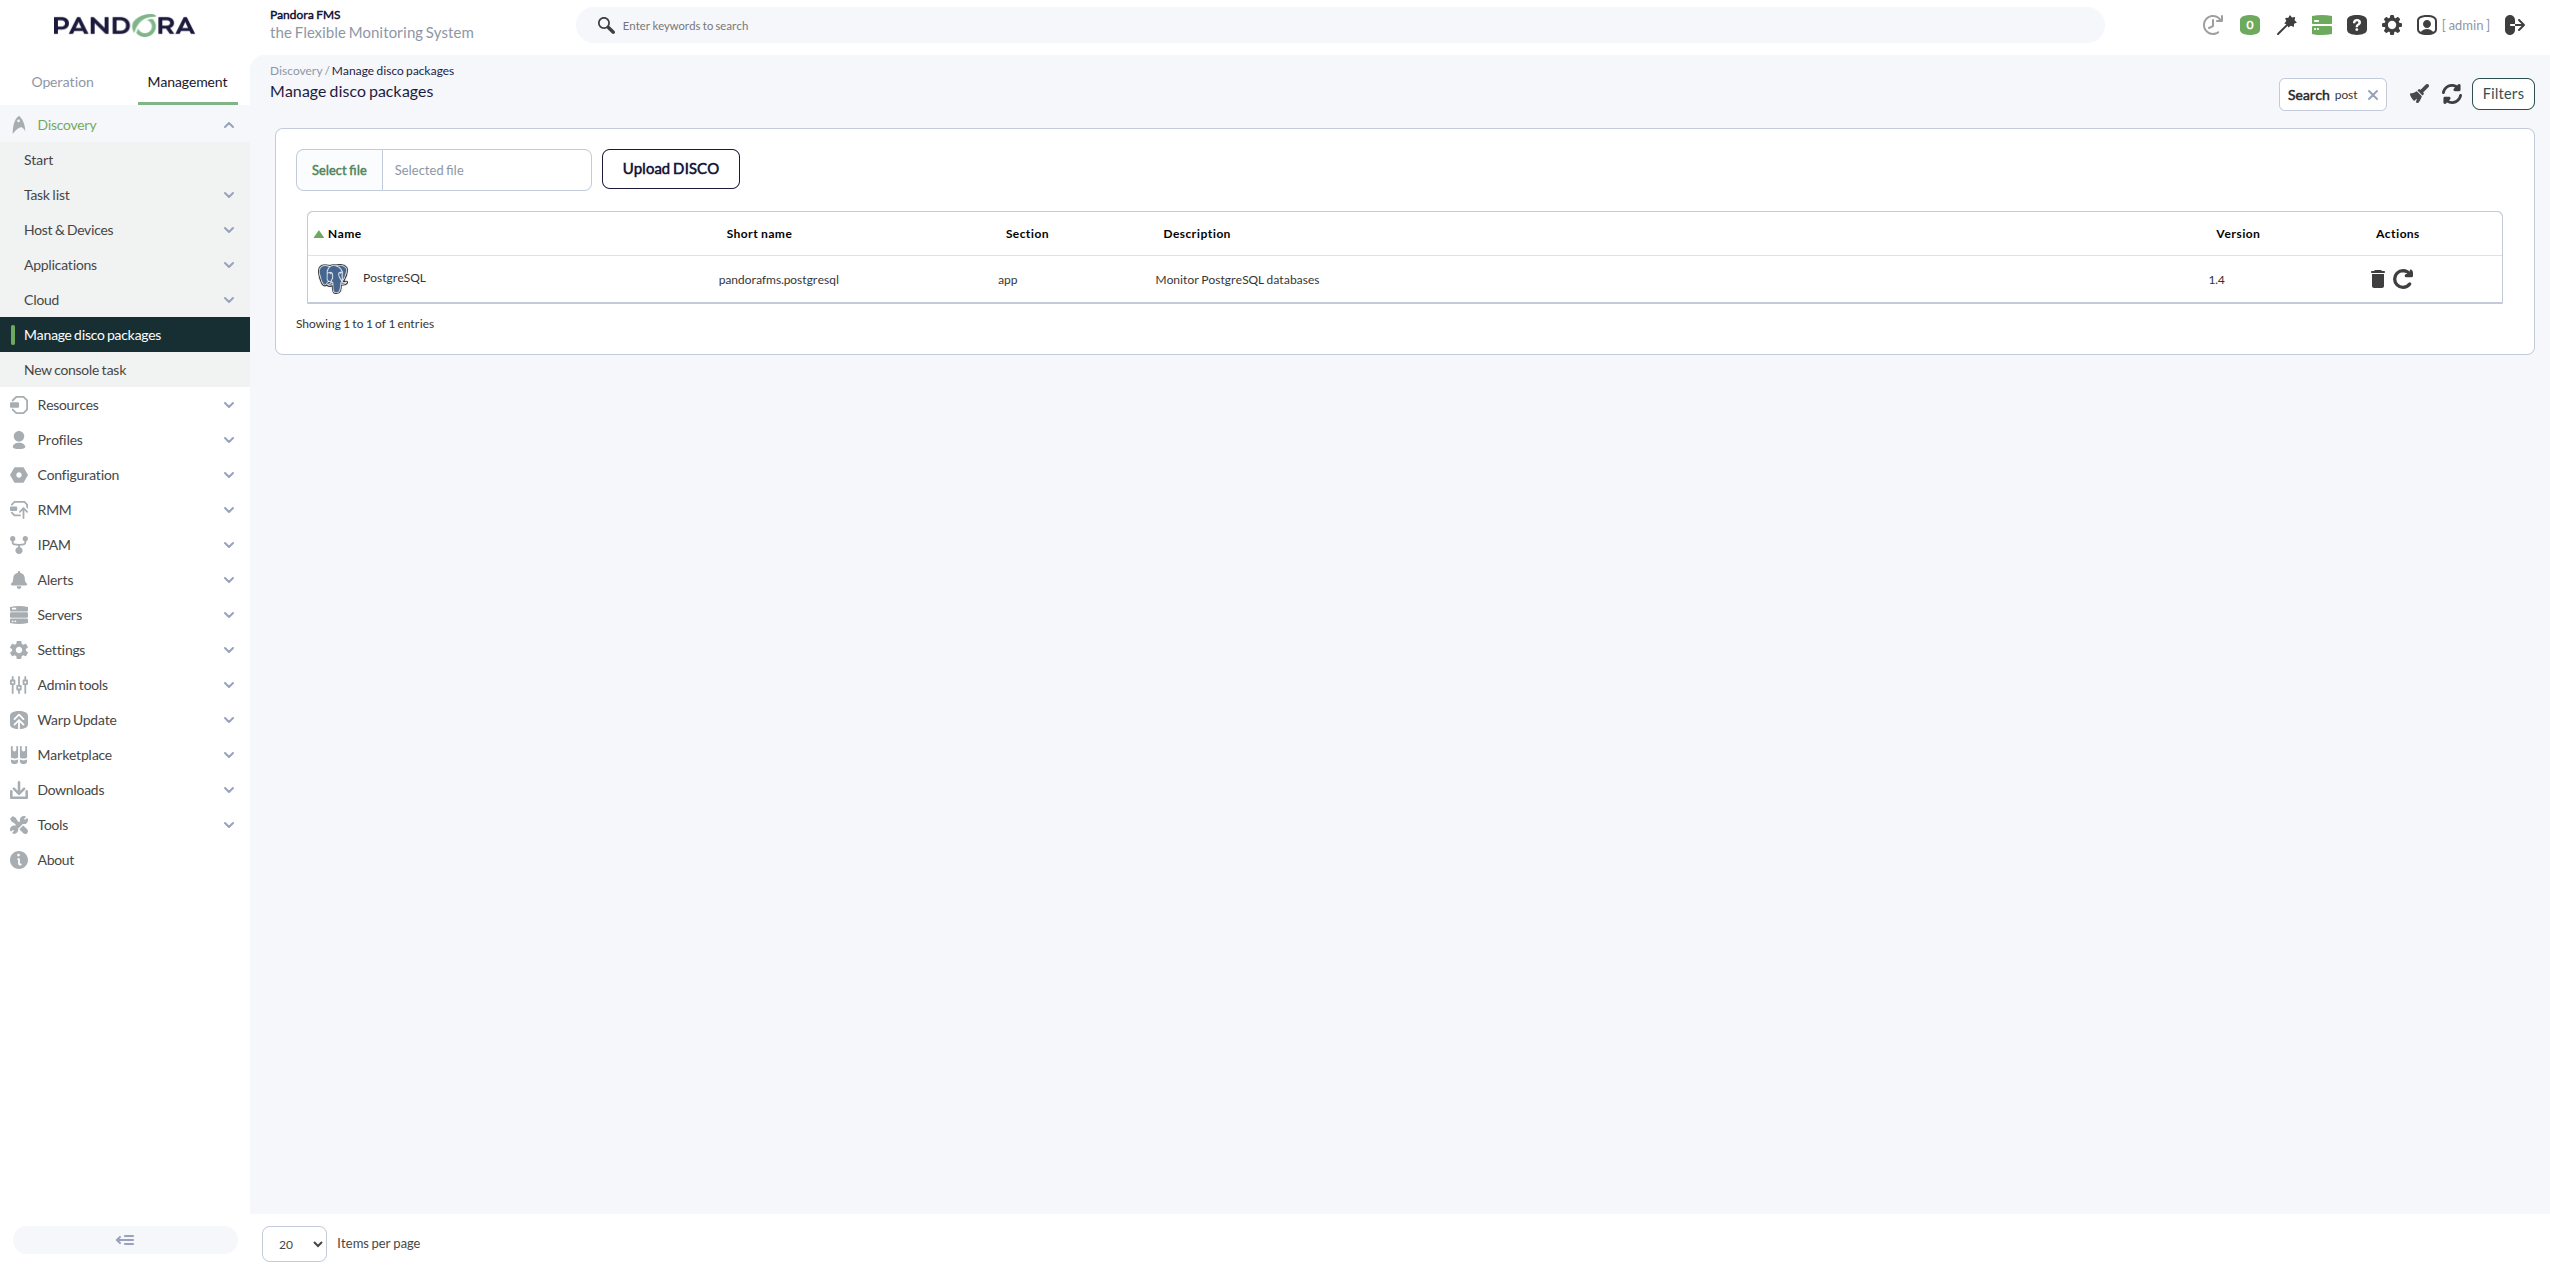
Once loaded, PostgreSQL environments can be monitored by creating Discovery tasks from the Management > Discovery > Applications section.
The following minimum data will be requested for each task:
- PostgreSQL target strings: List of PostgreSQL targets to be monitored by the task. It will be a comma-separated or line-separated list. Each PostgreSQL target can be defined using the format IP:PORT or IP.
- PostgreSQL Credentials: Custom connection credentials used to access the PostgreSQL targets. A credential previously created in Management > Configuration > Credential store must be selected.
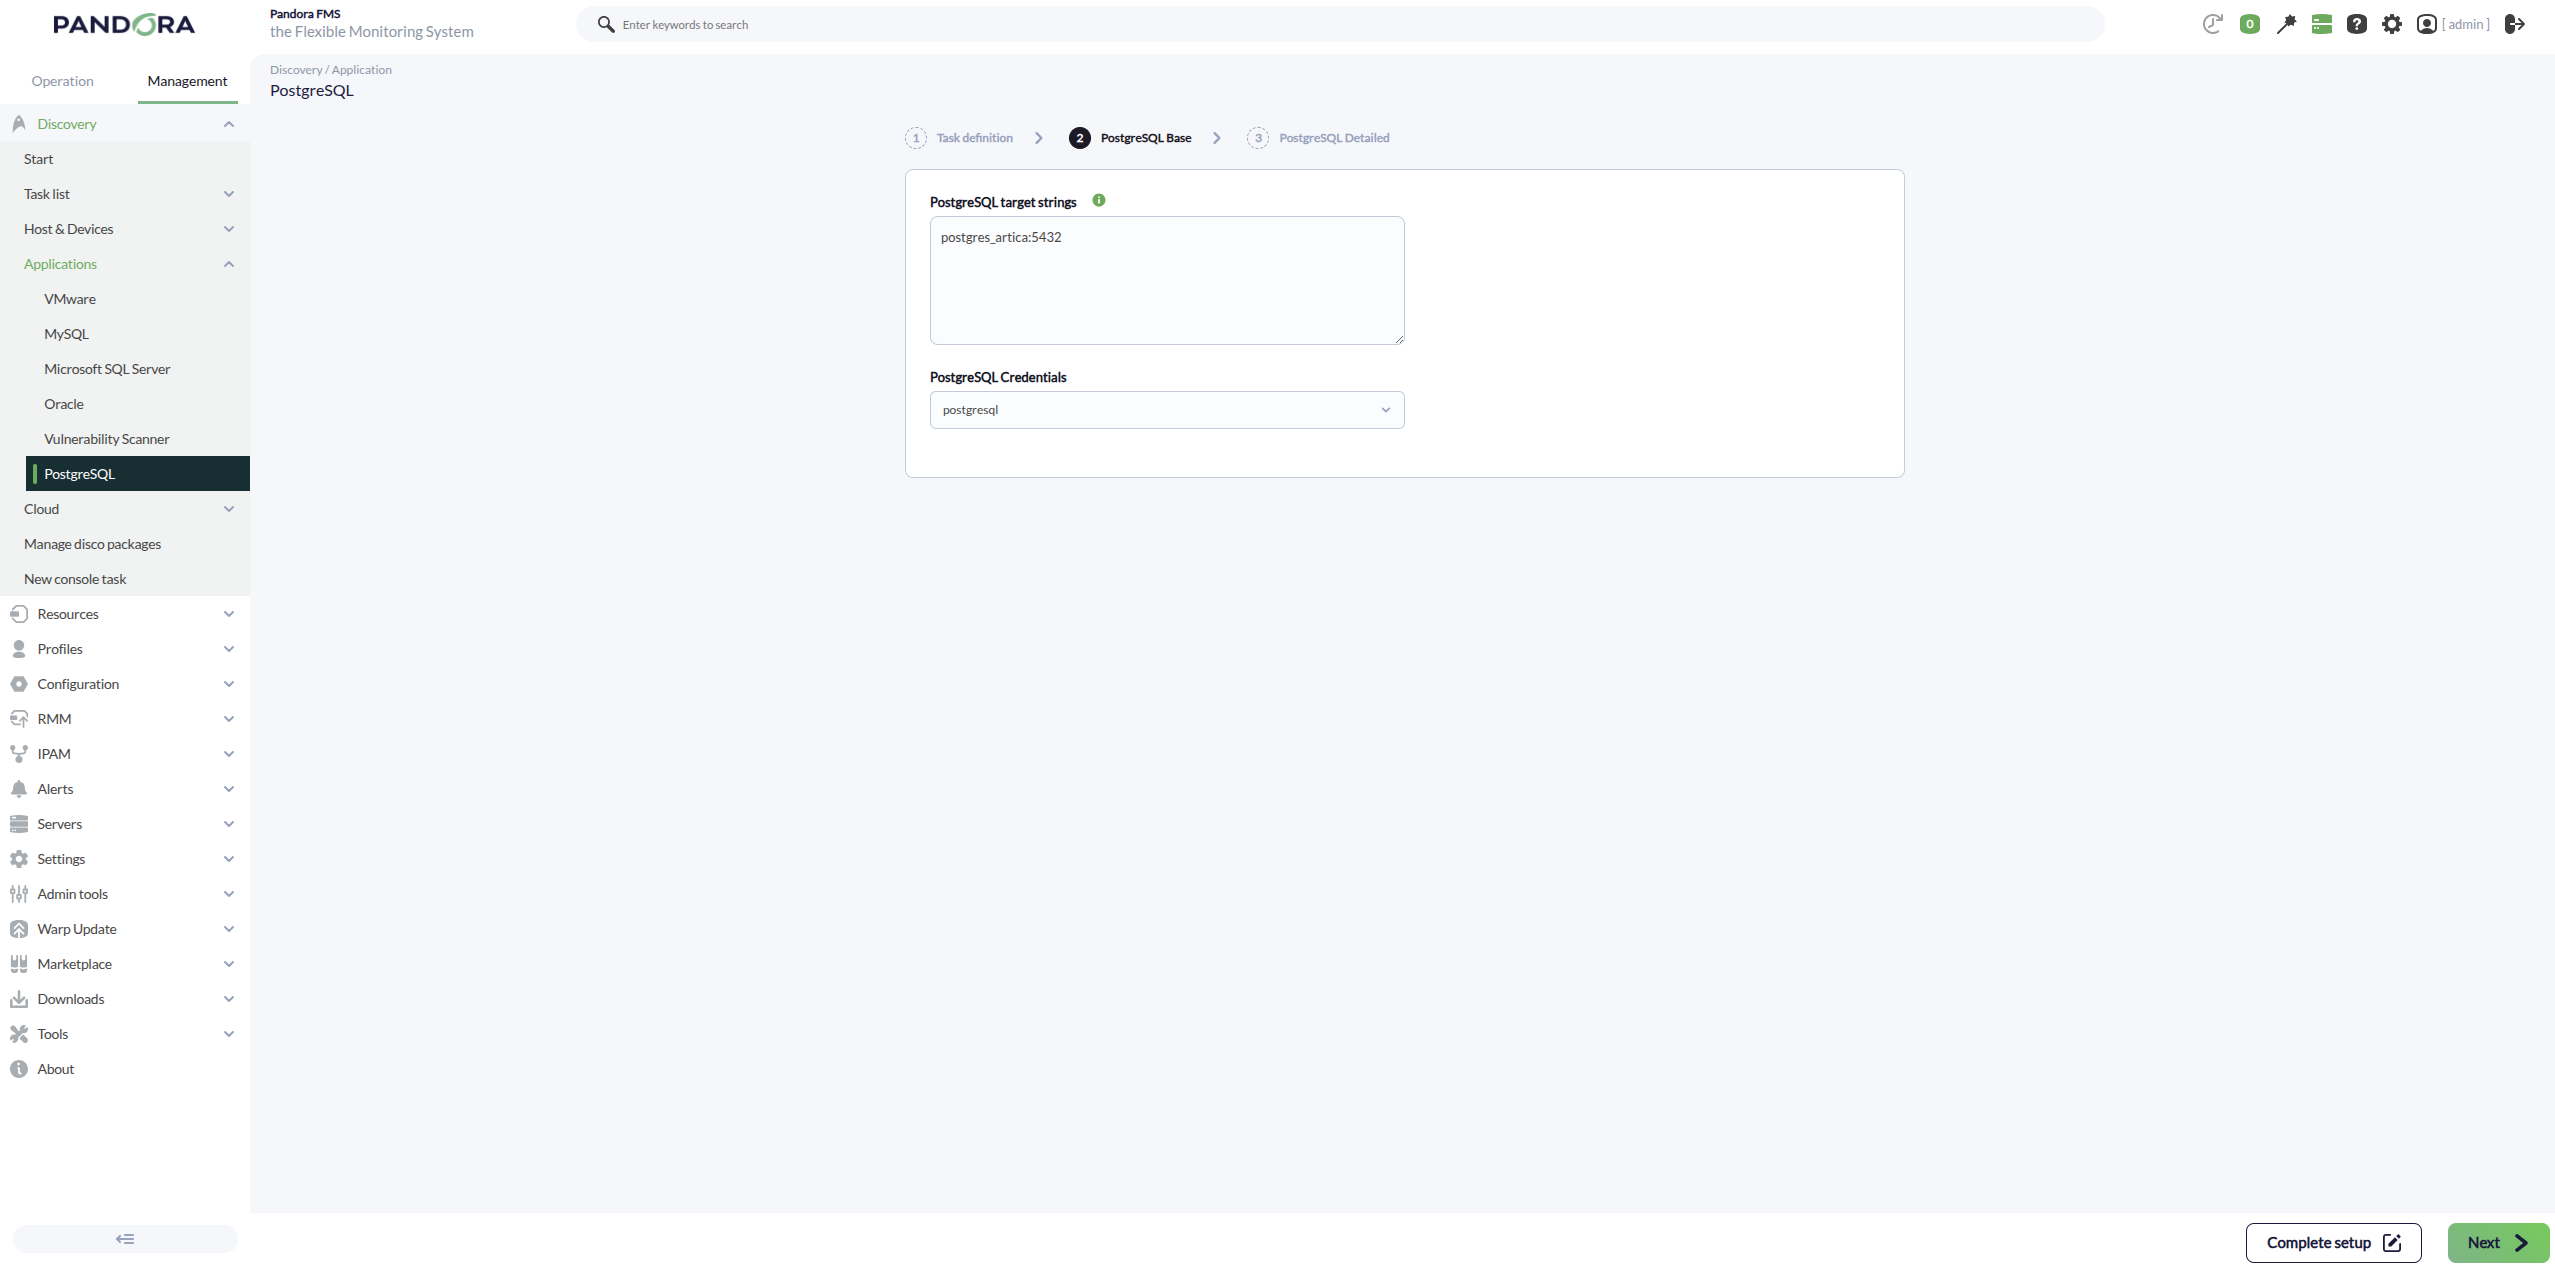
You can also adjust the task configuration to customize the desired monitoring:
- Max threads: To optimize execution time, multiple threads can be configured to monitor the task agents. Keep in mind that setting multiple threads may increase CPU usage.
- Target agent: List of target agents for the PostgreSQL targets to monitor. If an agent name is not specified for a target, its IP or FQDN will be used as the agent name.
- Custom module prefix: Text included as a prefix for all generated module names.
- Scan databases: If enabled, the plugin will discover the databases available on each PostgreSQL target.
- Create agent per database: If enabled, a separate agent will be created for each discovered database.
- Custom database agent prefix: Text included as a prefix for generated database agent names.
- Enable entities file re-scan interval: If enabled, the plugin will use a persistent discovered entities file to validate previously detected databases, even if they are no longer present in the current scan.
- Re-scan entities file interval: Interval used to revalidate the discovered entities file.
- Check engine uptime: If enabled, engine uptime monitoring will be performed.
- Retrieve query statistics: If enabled, instance-level query statistics will be monitored.
- Analyze connections: If enabled, instance connection usage will be monitored.
- Calculate fragmentation ratio: If enabled, fragmentation ratio statistics will be monitored.
- Retrieve cache statistics: If enabled, instance cache statistics will be monitored.
- Storage statistics: If enabled, storage metrics for discovered databases will be monitored:
database size: Total database size.tables size: Total space used by tables.indexes size: Total space used by indexes.temp bytes: Temporary data written to disk.temp files: Number of temporary files created.
- Query performance: If enabled, query performance statistics will be monitored:
long queries: Long-running active queries.oldest query age: Execution time of the oldest active query.sequential scans: Number of sequential scans.index scans: Number of index-based scans.cache hit ratio: Database cache hit ratio.
- Connections statistics: If enabled, per-database connection statistics will be monitored:
active connections: Number of active connections.idle connections: Number of idle connections.total connections: Total number of open connections.
- Transaction statistics: If enabled, transaction activity will be monitored:
transactions: Total executed transactions.commits: Committed transactions.rollbacks: Rolled back transactions.rollback ratio: Rollback ratio.deadlocks: Detected deadlocks.conflicts: Detected database conflicts.
- Table statistics: If enabled, structural table statistics will be monitored:
table count: Total number of user tables.index count: Total number of user indexes.live tuples: Estimated active rows.dead tuples: Estimated obsolete rows pending cleanup.fragmentation ratio: Estimated table fragmentation ratio.
- Advanced performance: If enabled, advanced performance metrics will be monitored:
blocks read: Blocks read from disk.blocks hit: Blocks retrieved from cache.
- Execute custom queries: If enabled, custom queries can be executed against the PostgreSQL instance and discovered databases.
- Custom queries: Configuration block used to define custom queries to be executed.
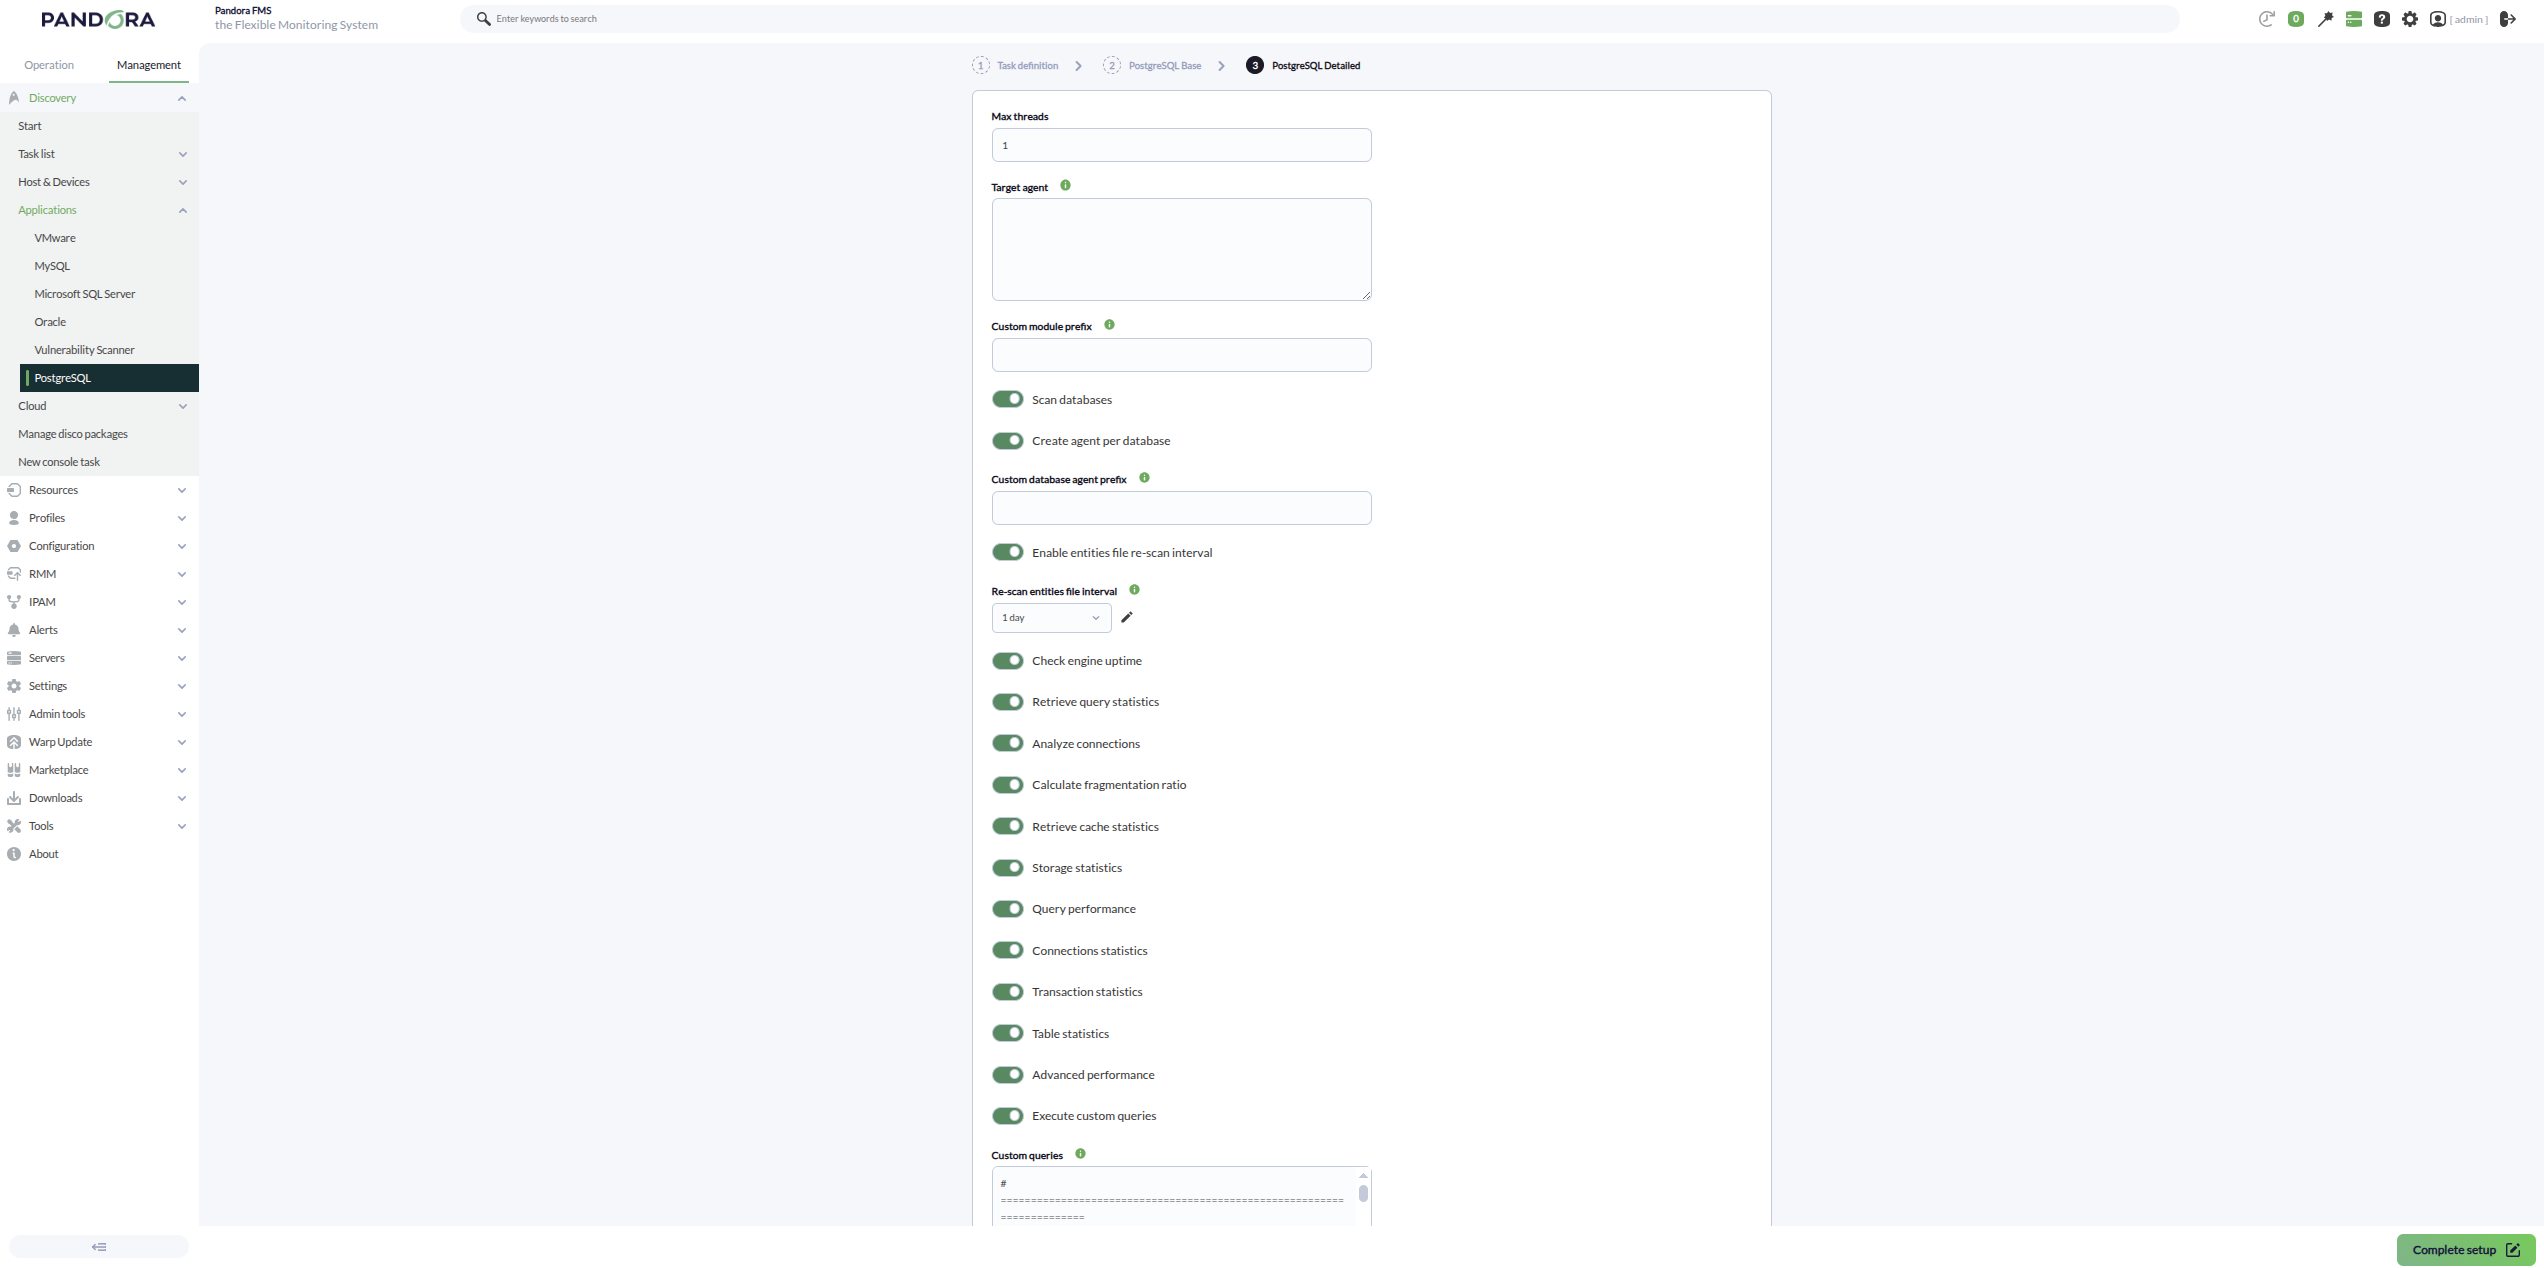
Successfully completed tasks will provide an execution summary with the following information:
- Total agents: Total number of agents generated by the task.
- Targets up: Total number of targets successfully connected.
- Targets down: Total number of targets that could not be reached.