
4. Detecting and monitoring new systems with Discovery
The Pandora FMS Discovery tool provides a set of toolsfeatures to simplify monitoring through wizards, including Discovery'sthe Discovery Network Scan feature.function.
To use it, followthe thesefollowing steps.steps must be followed. In the side menu, go tomenu: DiscoveryManagement → Discovery → Host&Devices → Network Scan section..
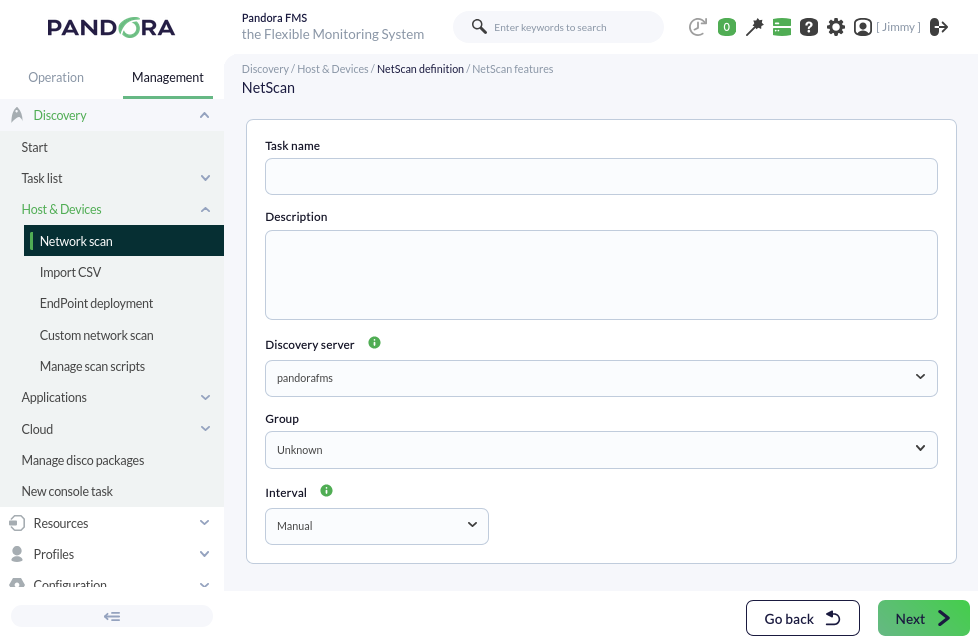
Createwill create the task as follows: Modify only the network range to be scanned, in this screenshot it is 192.168.70.0/24, which means that all hosts on network 192.168.70.xx will be scanned. Select the "Unknown"Unknown group, which will be used to contain the devices you detectdetected in that group.group, the Manual interval, and the default Discovery Server. From now on, we will generically call the devices managed and/or monitored by Pandora FMS "agents". Move on to the next step; by default, it will show simple scanning:
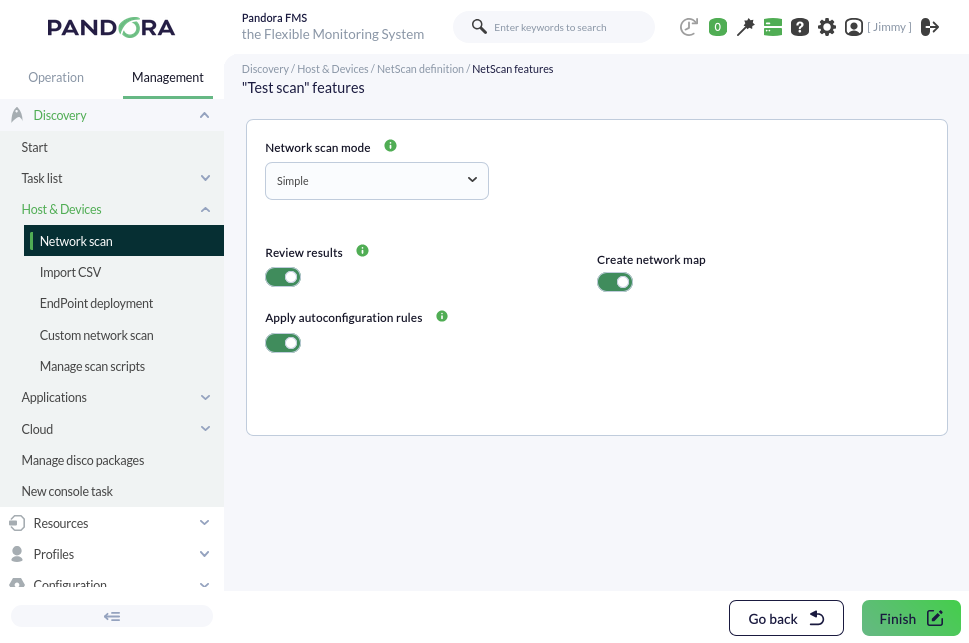
Although you can leave this option and save, it is better to specify a network to reduce the workload since, by default, all networks to which the PFMS Server has access will be calledscanned. "agents".To do this, choose the Advanced option.
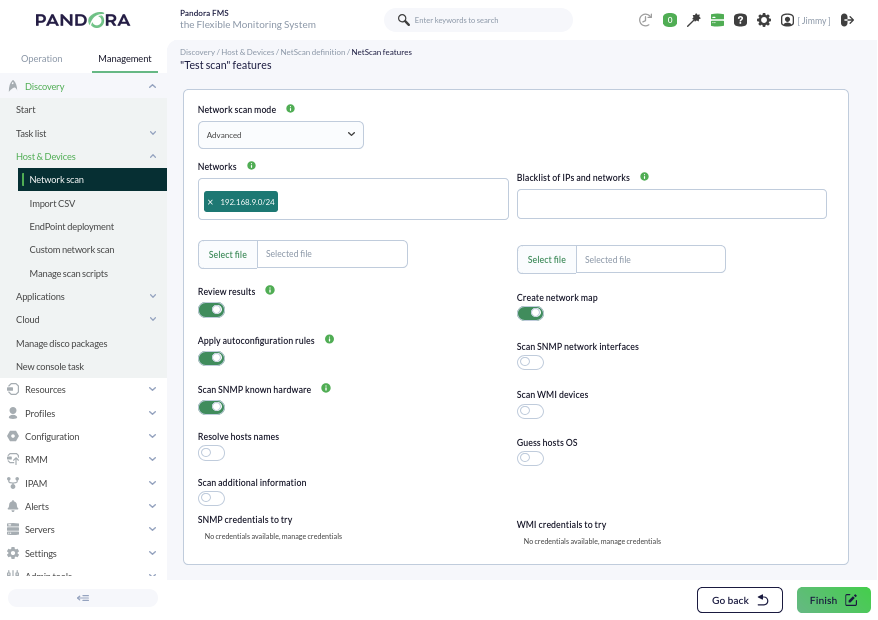
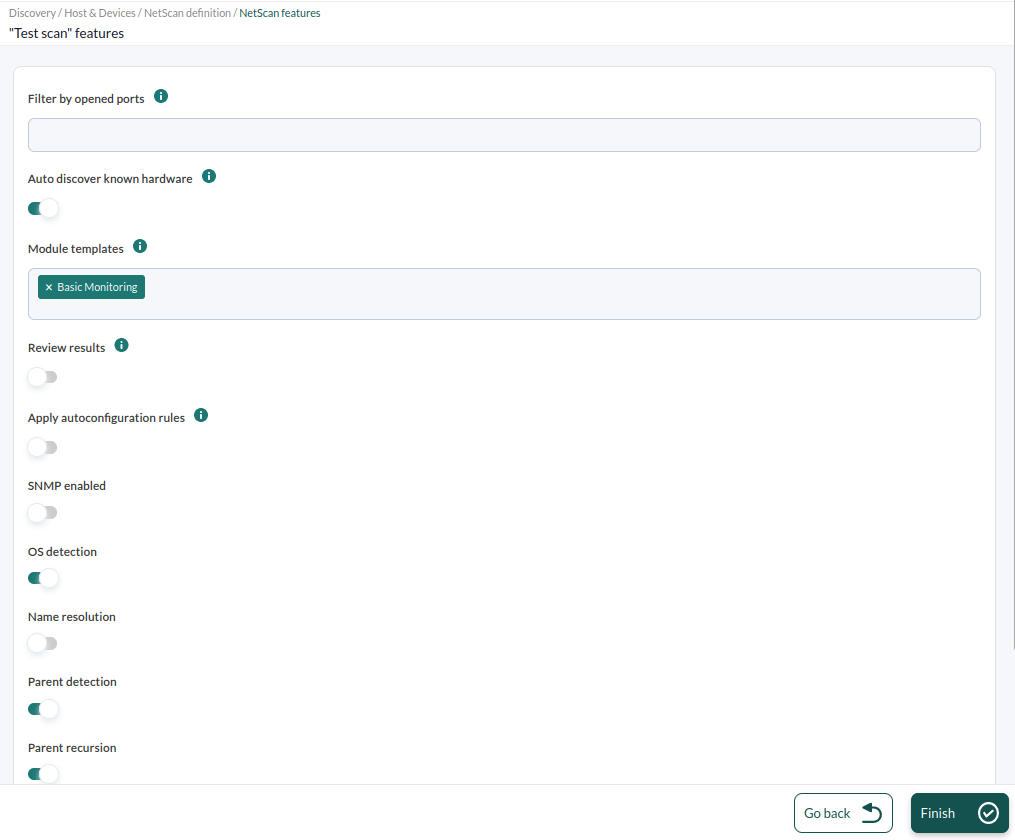
YouWe maycan select different aspects of the initial monitoring that will be applied to the discovered devices. YouBy maydefault, definethe differentoption pre-configuredto templates,apply autoconfiguration rules (Apply autoconfiguration rules) is enabled as you may seeseen in the image. ChooseWe the option "BASIC MONITORING" andwill leave the Review results option "Reviewchecked. results"There unchecked.
Once the recognitionreconnaissance task is created, assince it was created with a manual interval, startit itmust be started manually. ForTo that,do force its executionthis, in the discovery task list:list, force its execution:
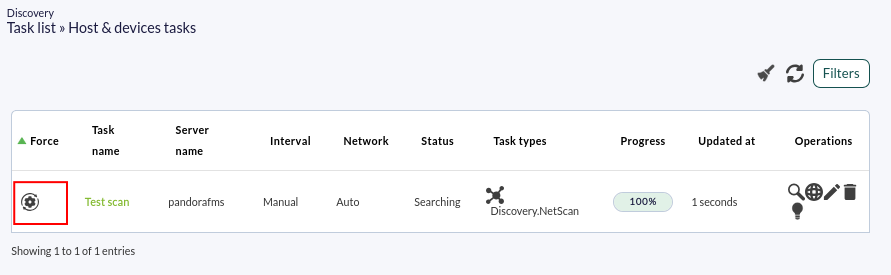
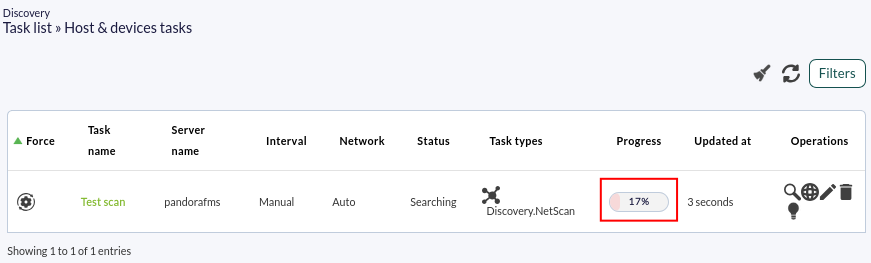
Its progress will be updated:updated over time:
![]()
At any time, youwe maycan click on the magnifying glass icon to see the task details:
![]()
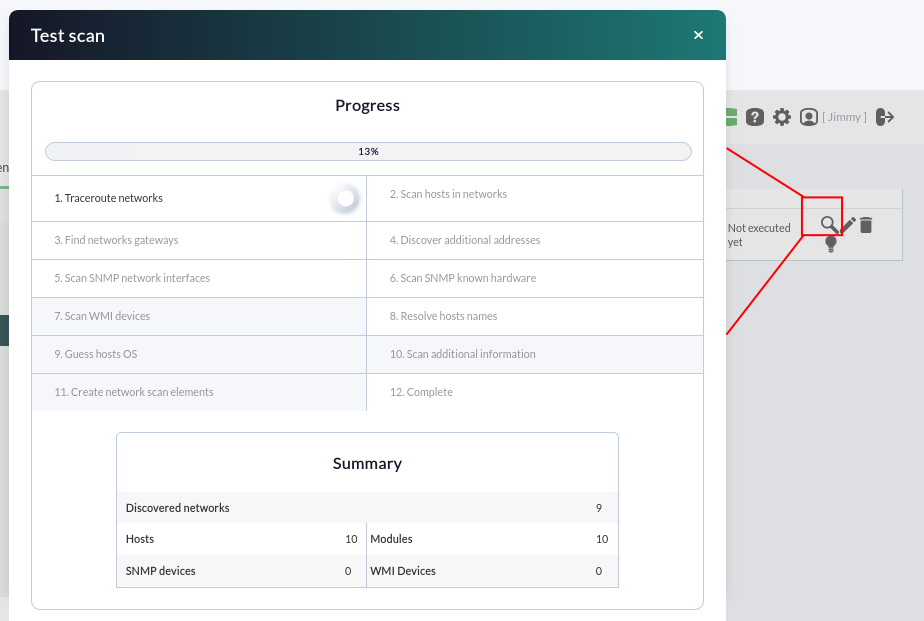
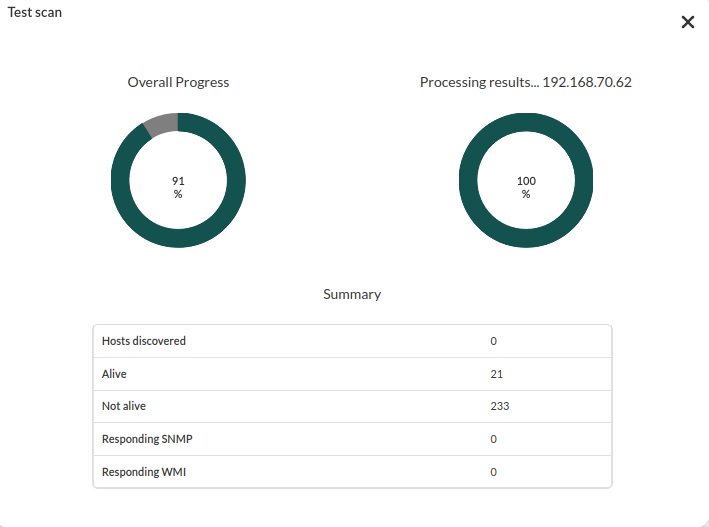
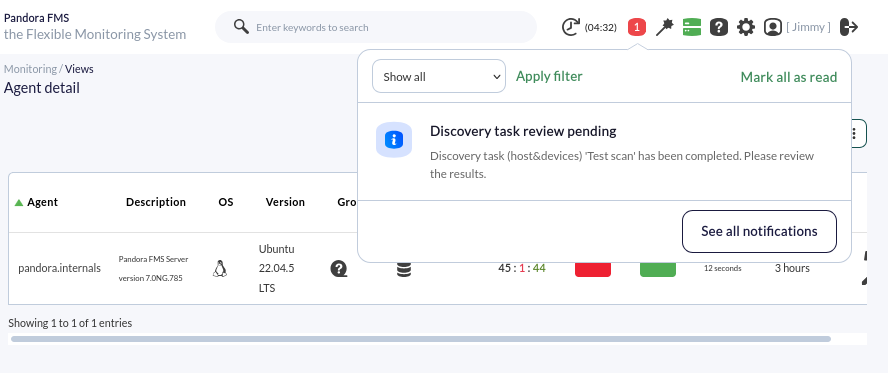
At this point, it is betterbest to wait until the wholeentire network ishas scanned.been Whendetected.
Even isif finished,other gotasks toare performed during the agentscan, detailand viewsince towe see allleft the detected"Review systems.results" Menuoption "Monitoring"checked, >if "Views"we >have "Agentthe detail",notification assystem seenenabled, we will be notified in thea image:timely manner:
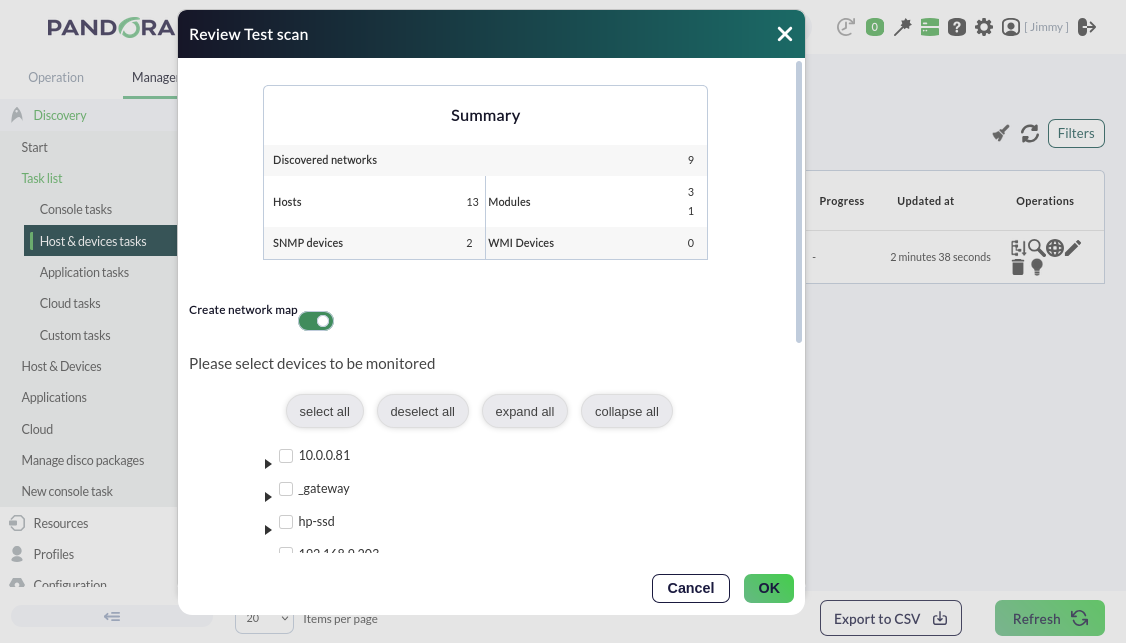
A
summaryof what has been collected will be presented. You will see several systems that werehave been detected. In some cases, the system name of the system will have been solvedresolved (if it was possible byvia DNS) and in others, it will have detected the type of Operating System will have been detected,System, according to the options selected in the network scan carried outperformed with Discovery. ClickingEach onelement will have its selection box to include those considered necessary:
The basic checks are of the nameICMP will lead you to the agent detail view, which will show all the system information. In this case, the agent has only one module,type: the "Host alive" module, a check that verifies whether the machine is "alive" and respondsresponding from the network, and the "Host LatencyLatency"" module, which calculates the time it takes for the server takes to communicate with the machine:machine. Select some of them, along with other elements you consider of interest. When you press OK, another pop-up window will appear with the selected elements:
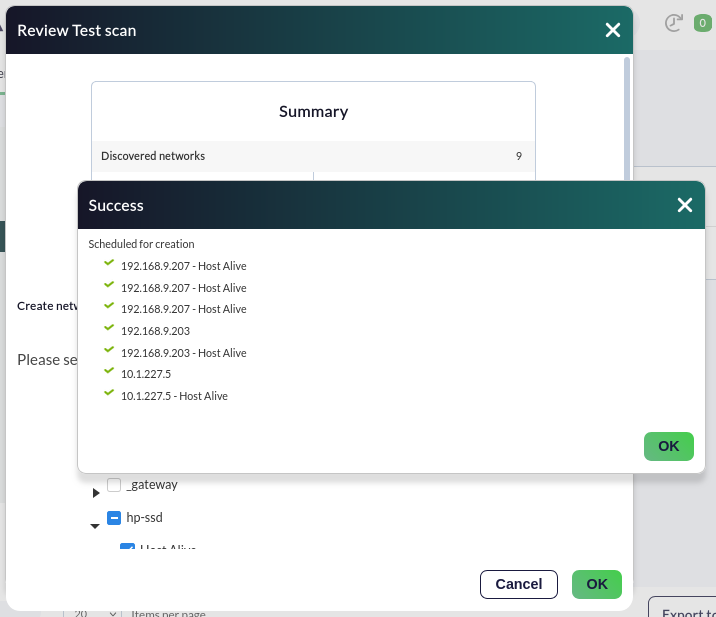
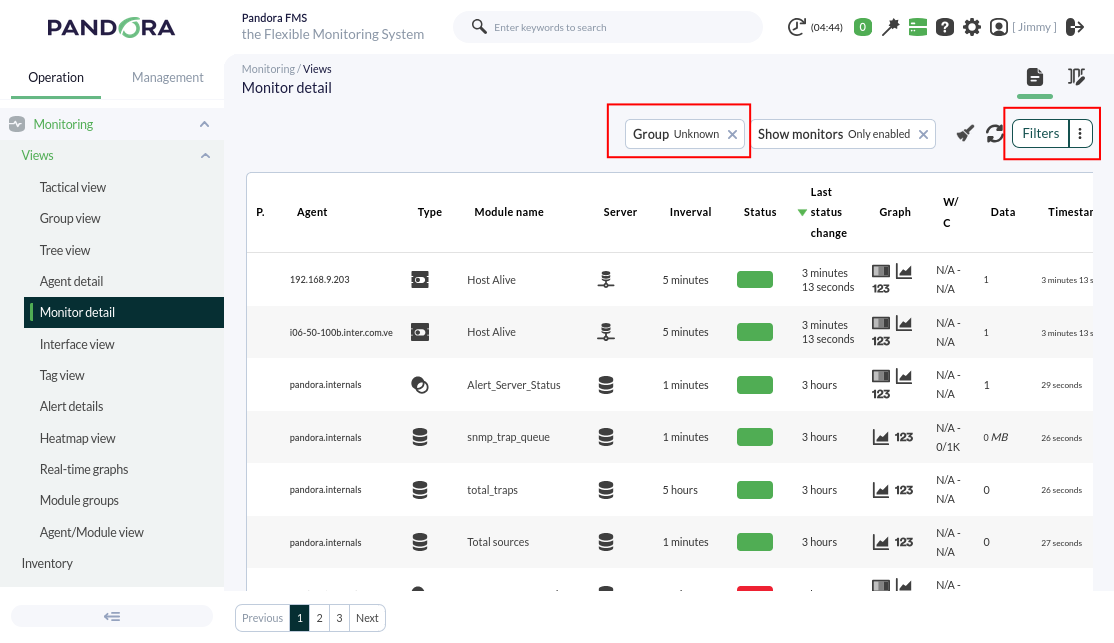
When finished, you will access the agent detail view to see all the detected and selected systems.
Menu Operation → Monitoring → Views → Monitor detail, filtering by the Unknown group:

If you do not need morefurther monitoring or configuration, golet's move on to metric alerting here. Are the metricresults alertexplained here.
Didthe youchapter not getbeing achieved? Access the expected results? Go to help or support sections.
section.