
Discovery
This plugin can be integrated with Pandora FMS Discovery.
To do this, you must upload the ".disco" package, which can be downloaded from the Pandora FMS library:
https://pandorafms.com/library/
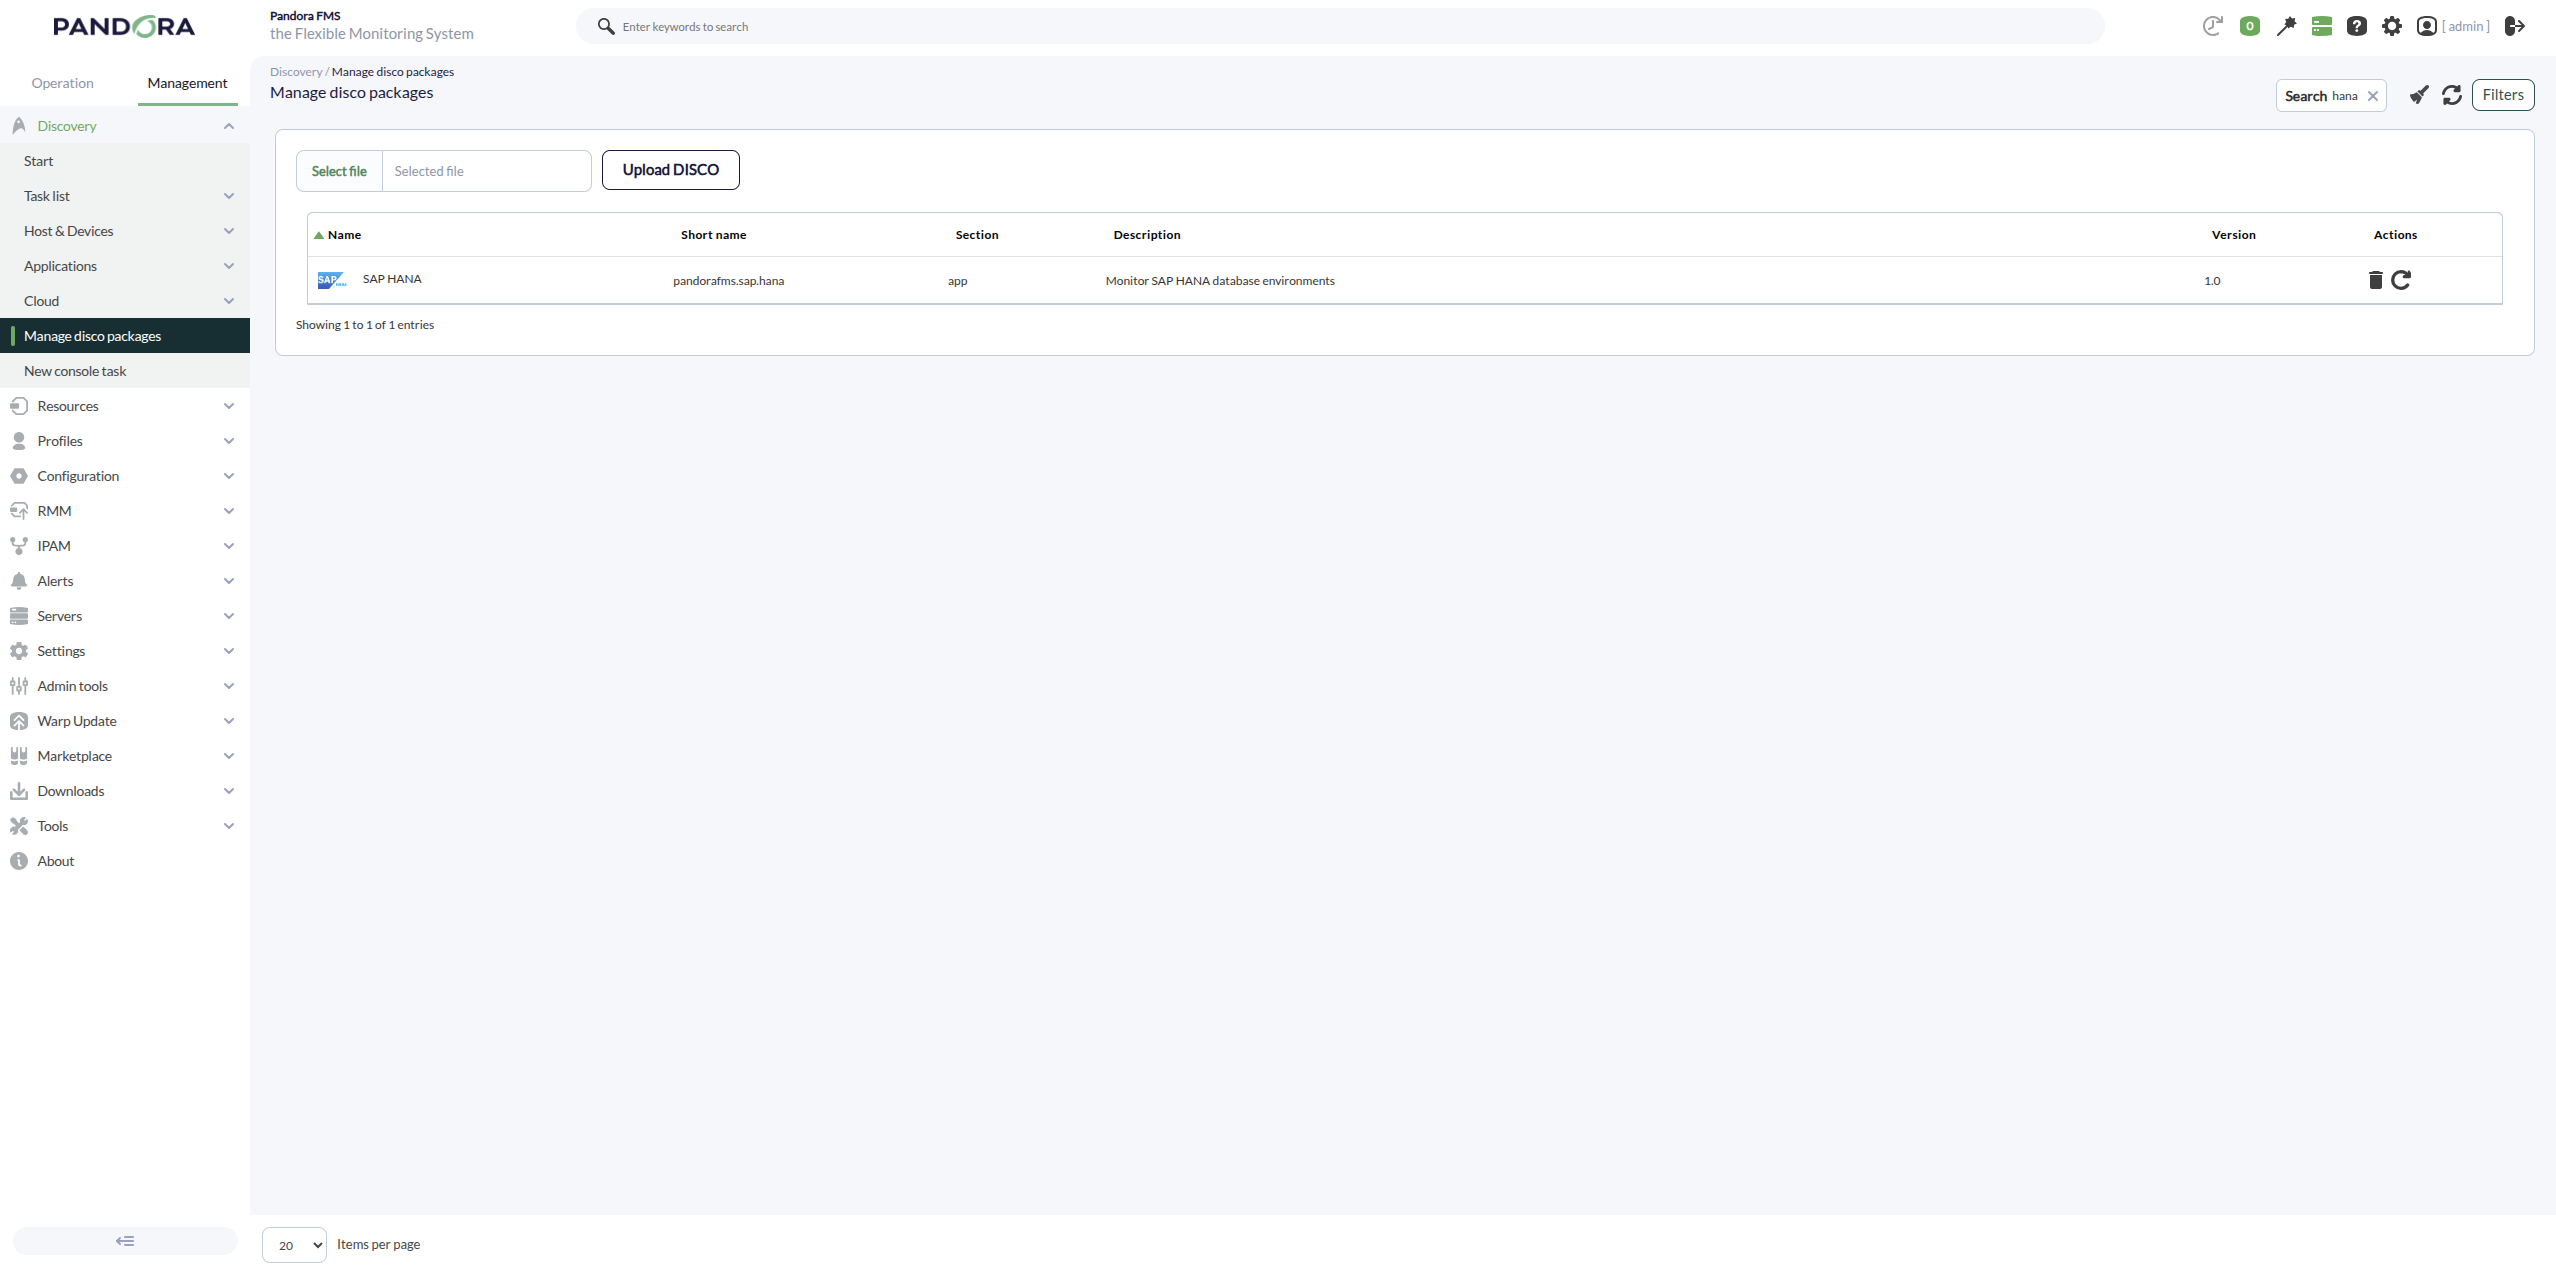
Once uploaded, SAP HANA environments can be monitored by creating Discovery tasks from the Management > Discovery > Applications section.

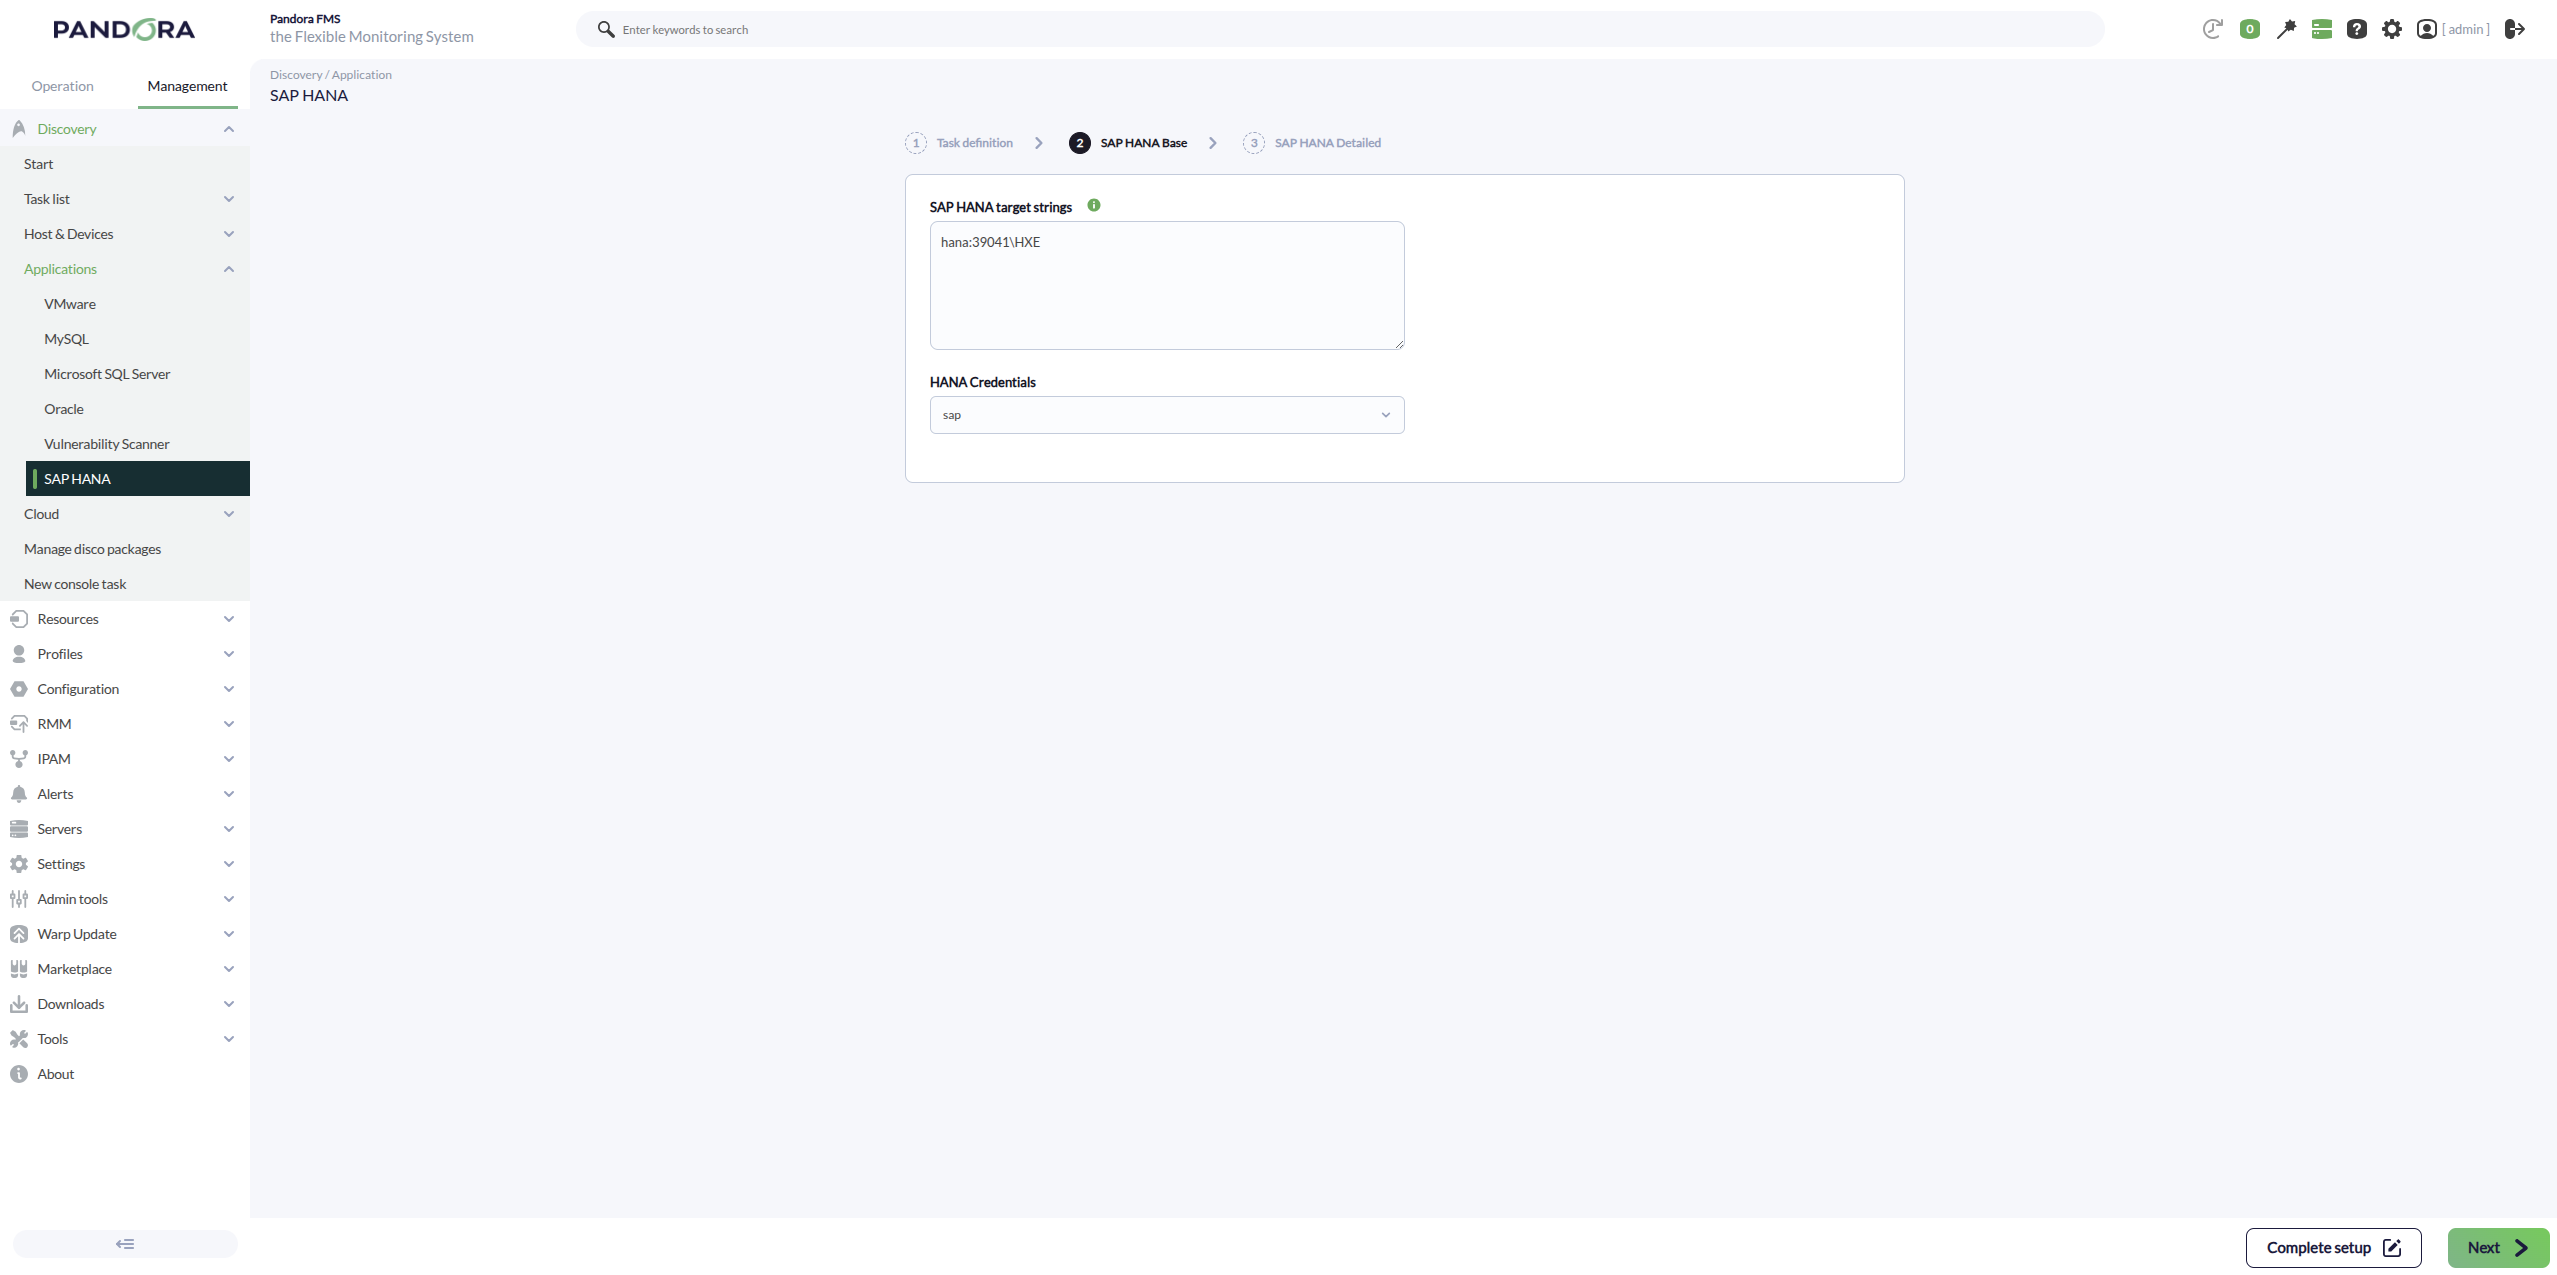
For each task, the following minimum parameters will be required:
- SAP HANA target string: IP address of the host with SAP HANA, port, and database instance
- Credentials: Custom-type username and password. For this, a new credential must be created in the Management > Configuration > Credential store section.
It will also be possible to adjust the task configuration to customize the desired monitoring:
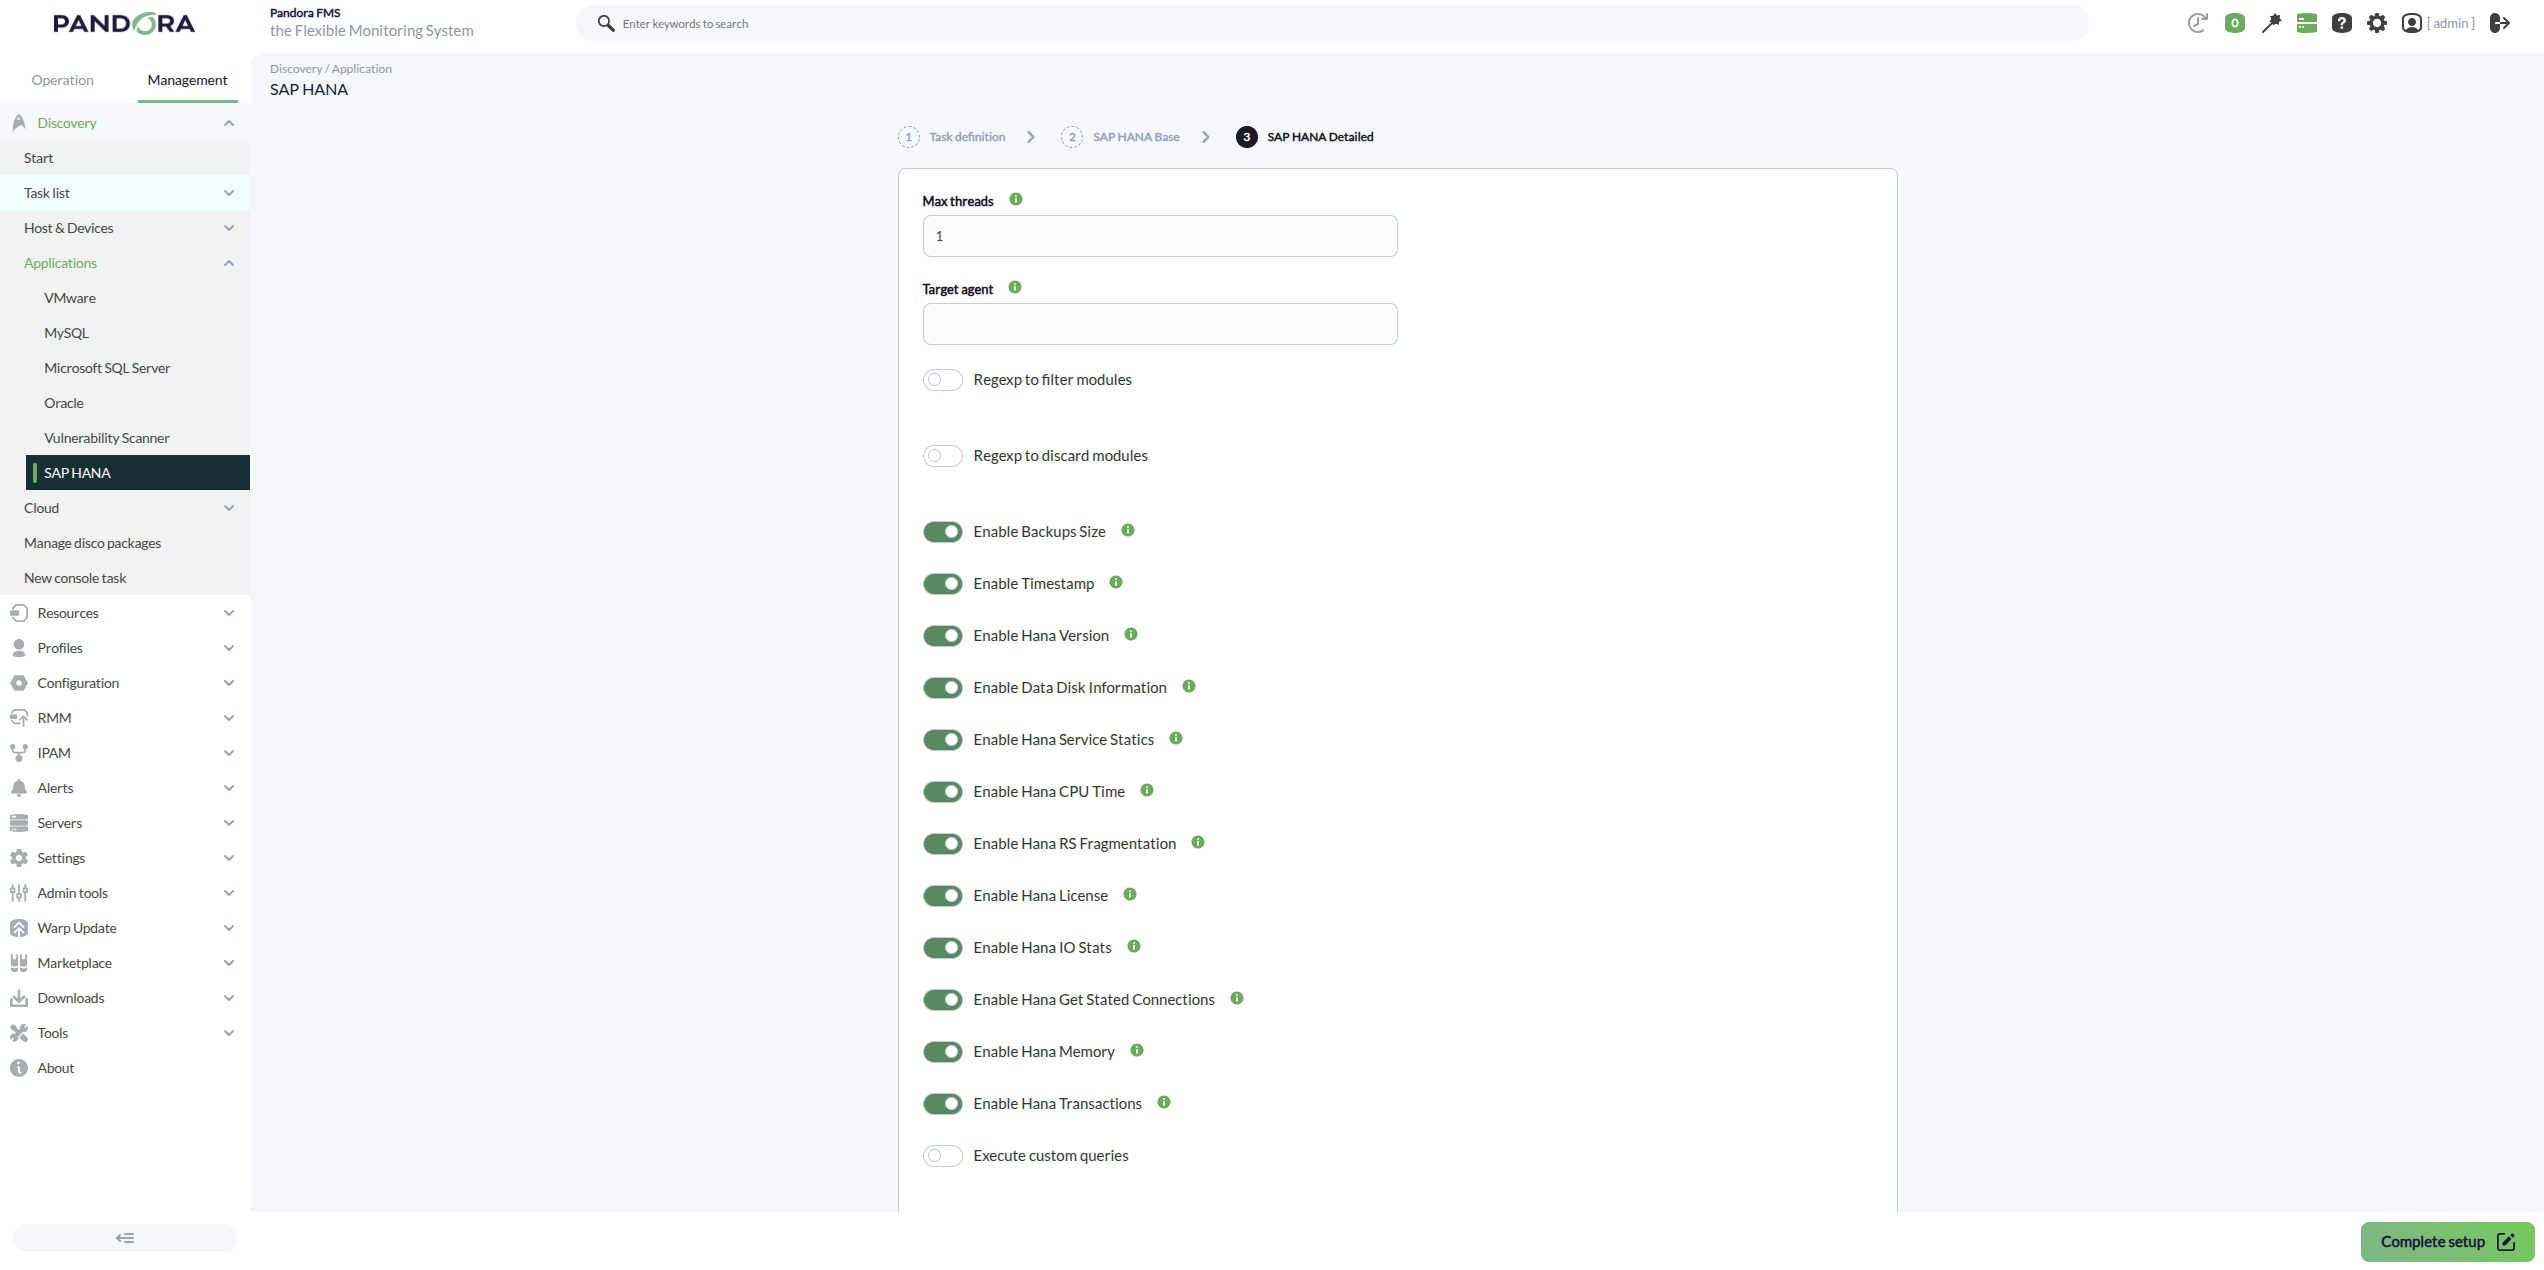
- Backups Size: Creates modules with metrics on the estimated size of database backups.
- Timestamp: Creates a module with the database time to check for time drift.
- Hana Version: Creates a module with the installed SAP HANA version.
- Data Disk Information: Creates modules with basic information about HANA data volumes/disks.
- Hana Service Statics: Creates modules with general metrics of HANA services (status and resources).
- Hana CPU Time: Creates modules with the accumulated CPU usage reported by the services.
- Hana RS Fragmentation: Creates modules with Row Store fragmentation indicators.
- Hana License: Creates modules with information about the HANA license status.
- Hana IO Stats: Creates modules with read/write metrics and I/O time on volumes.
- Hana Get Stated Connections: Creates modules with the number of connections and their status.
- Hana Memory: Creates modules with memory usage and configured allocation limits.
- Hana Transactions: Creates modules with metrics of open transactions and blocked transactions.
- Custom Queries: Allows creating multiple modules with the desired types and values.
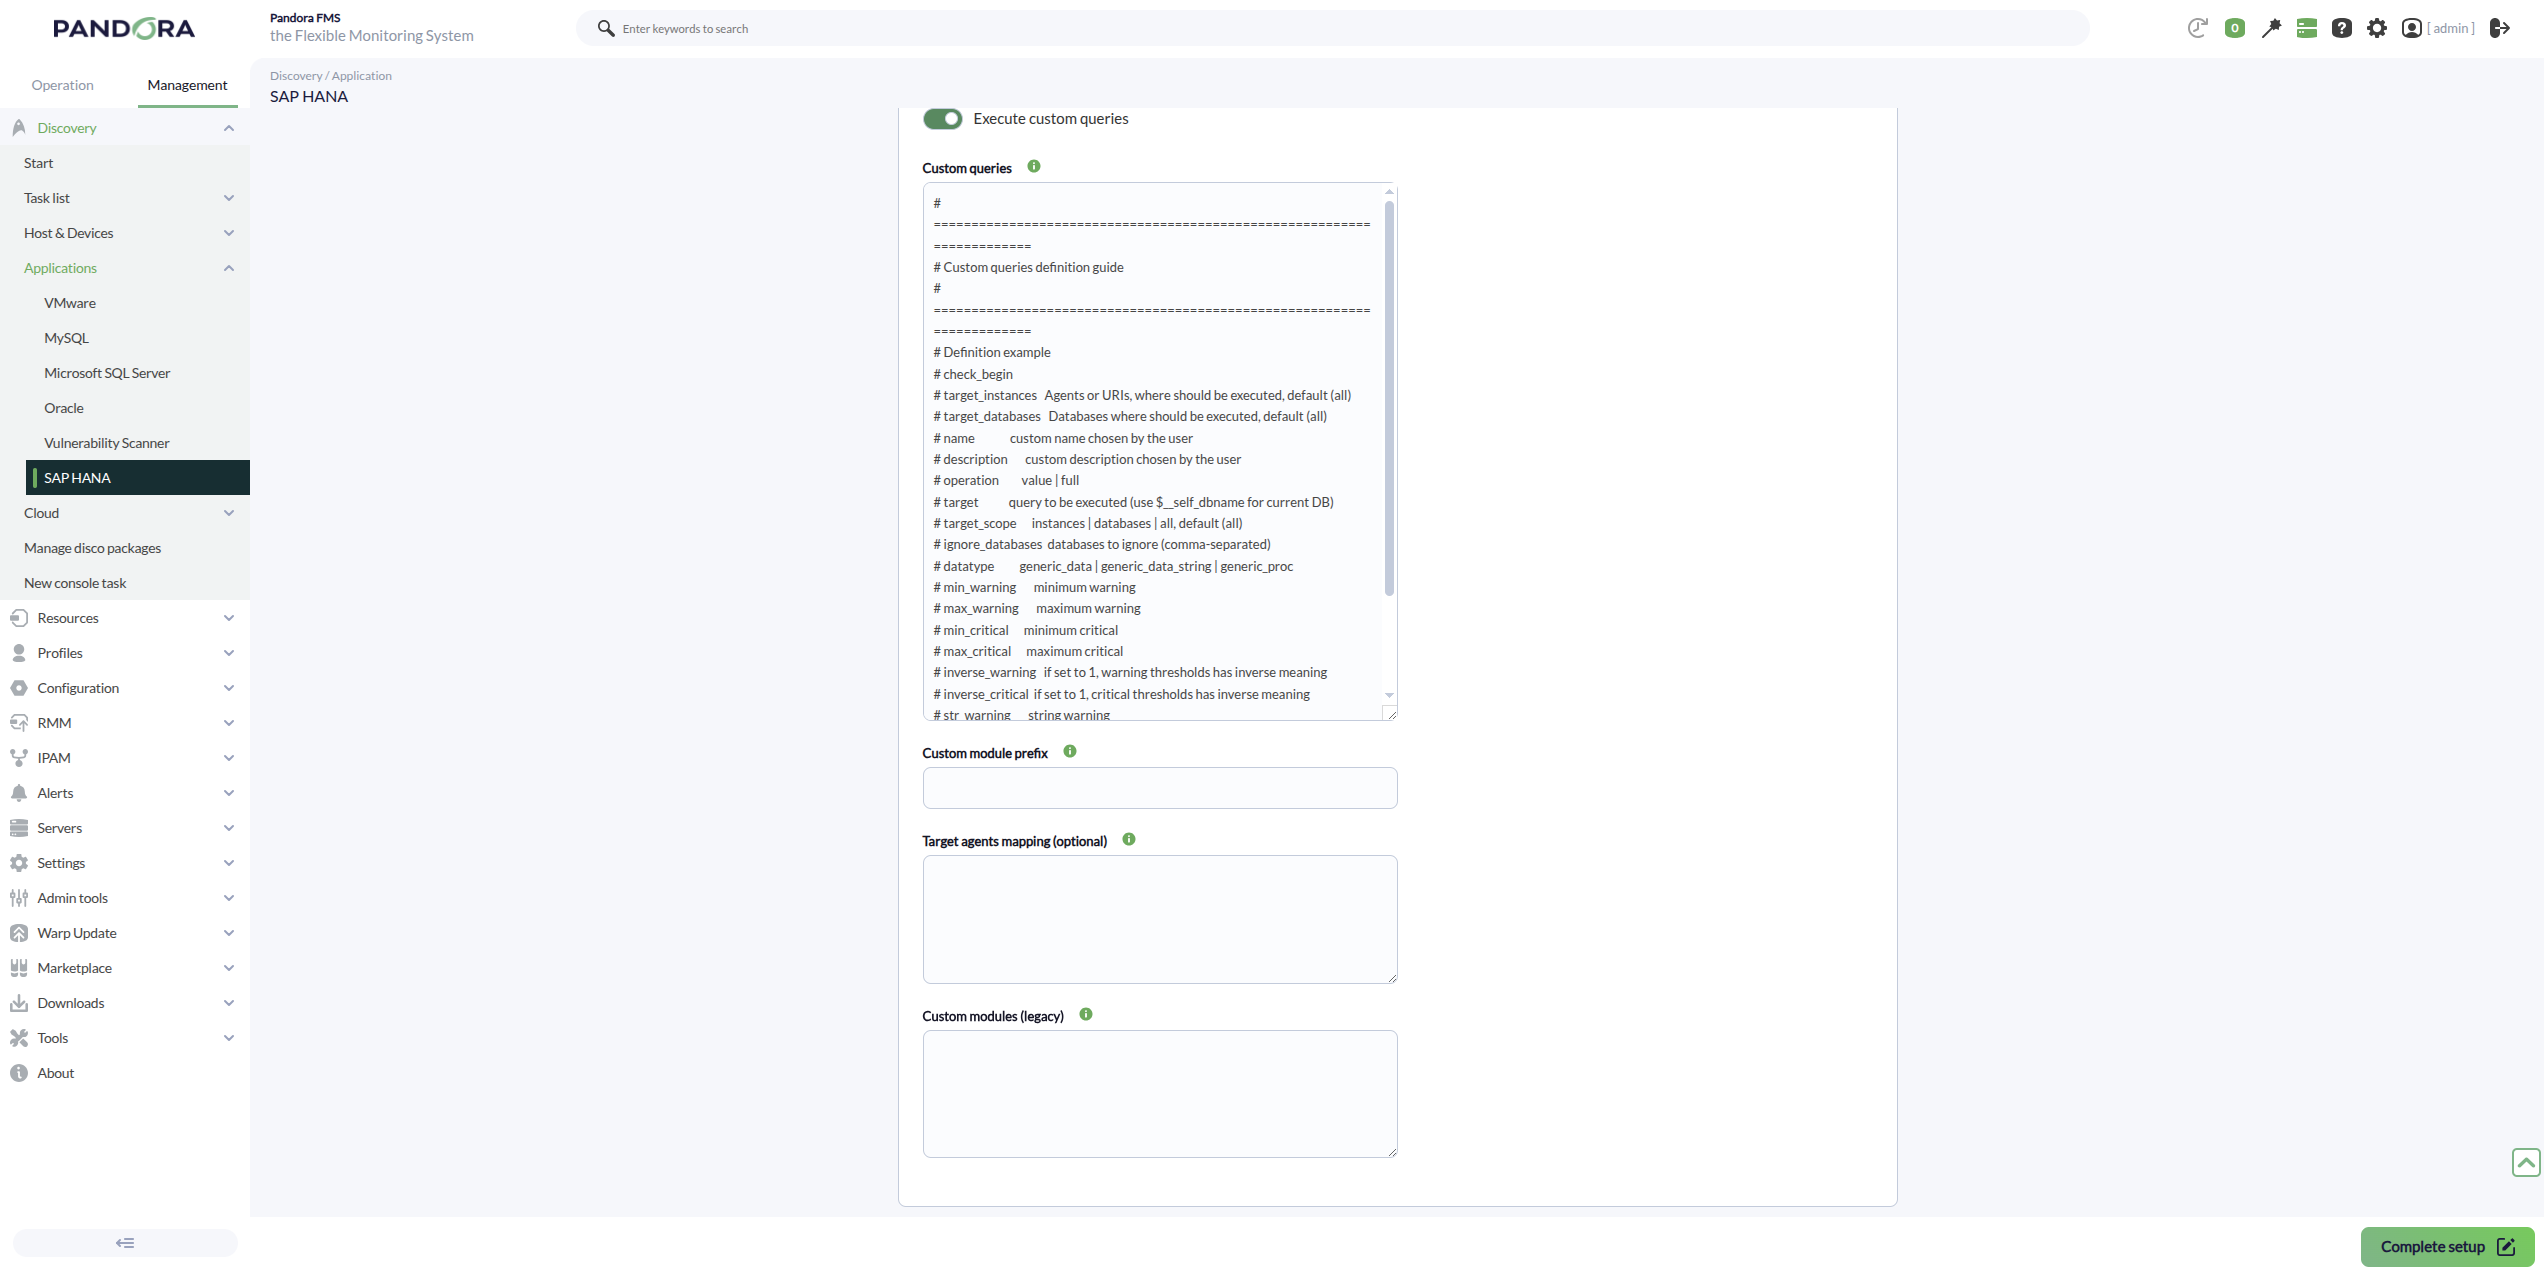
Examples of custom queries:
# =======================================================================
# Custom queries (SAP HANA HXE)
# =======================================================================

check_begin
name connections_total
description Conexiones totales (SYS.M_CONNECTIONS)
operation value
target SELECT COUNT(*) FROM SYS.M_CONNECTIONS
datatype generic_data
unit conns
check_end

check_begin
name connections_active
description Conexiones activas RUNNING (SYS.M_CONNECTIONS)
operation value
target SELECT COUNT(*) FROM SYS.M_CONNECTIONS WHERE CONNECTION_STATUS = 'RUNNING'
datatype generic_data
unit conns
check_end

check_begin
name memory_used_bytes
description Memoria usada total (INSTANCE_TOTAL_MEMORY_USED_SIZE)
operation value
target SELECT COALESCE(SUM(INSTANCE_TOTAL_MEMORY_USED_SIZE),0) FROM SYS.M_HOST_RESOURCE_UTILIZATION
datatype generic_data
unit bytes
check_end

check_begin
name memory_allocation_limit_bytes
description Limite de asignacion de memoria (ALLOCATION_LIMIT)
operation value
target SELECT COALESCE(SUM(ALLOCATION_LIMIT),0) FROM SYS.M_HOST_RESOURCE_UTILIZATION
datatype generic_data
unit bytes
check_end

check_begin
name cpu_total_time_ms
description CPU total time agregado (TOTAL_CPU_TIME)
operation value
target SELECT COALESCE(SUM(TOTAL_CPU_TIME),0) FROM SYS.M_SERVICE_STATISTICS
datatype generic_data
unit ms
check_end

check_begin
name cpu_process_time_ms
description CPU process time agregado (PROCESS_CPU_TIME)
operation value
target SELECT COALESCE(SUM(PROCESS_CPU_TIME),0) FROM SYS.M_SERVICE_STATISTICS
datatype generic_data
unit ms
check_end

check_begin
name service_total_memory_bytes
description Memoria total agregada por servicios (TOTAL_MEMORY)
operation value
target SELECT COALESCE(SUM(TOTAL_MEMORY),0) FROM SYS.M_SERVICE_STATISTICS
datatype generic_data
unit bytes
check_end

check_begin
name service_available_memory_bytes
description Memoria disponible agregada (AVAILABLE_MEMORY)
operation value
target SELECT COALESCE(SUM(AVAILABLE_MEMORY),0) FROM SYS.M_SERVICE_STATISTICS
datatype generic_data
unit bytes
check_end

check_begin
name io_total_read_bytes
description IO total leido acumulado (TOTAL_READ_SIZE)
operation value
target SELECT COALESCE(SUM(TOTAL_READ_SIZE),0) FROM SYS.M_VOLUME_IO_TOTAL_STATISTICS
datatype generic_data
unit bytes
check_end

check_begin
name io_total_write_bytes
description IO total escrito acumulado (TOTAL_WRITE_SIZE)
operation value
target SELECT COALESCE(SUM(TOTAL_WRITE_SIZE),0) FROM SYS.M_VOLUME_IO_TOTAL_STATISTICS
datatype generic_data
unit bytes
check_end

check_begin
name io_total_time_ms
description Tiempo total de IO acumulado (TOTAL_IO_TIME)
operation value
target SELECT COALESCE(SUM(TOTAL_IO_TIME),0) FROM SYS.M_VOLUME_IO_TOTAL_STATISTICS
datatype generic_data
unit ms
check_end

check_begin
name rowstore_free_pct
description Rowstore porcentaje libre (FREE_SIZE/ALLOCATED_SIZE)
operation value
target SELECT CASE WHEN SUM(ALLOCATED_SIZE)=0 THEN 0 ELSE ROUND(SUM(FREE_SIZE)*100.0/SUM(ALLOCATED_SIZE),2) END FROM SYS.M_RS_MEMORY
datatype generic_data
unit %
min_warning 40
min_critical 20
inverse_warning 1
inverse_critical 1
check_end

check_begin
name hana_time_utc
description Timestamp UTC de la BD
operation value
target SELECT TO_VARCHAR(CURRENT_UTCTIMESTAMP) FROM DUMMY
datatype generic_data_string
check_end

check_begin
name hana_services_running
description Numero de servicios activos (ACTIVE_STATUS='YES')
operation value
target SELECT COUNT(*) FROM SYS.M_SERVICE_STATISTICS WHERE ACTIVE_STATUS = 'YES'
datatype generic_data
unit services
check_end