Discovery
This plugin can be integrated with Pandora FMS Discovery.
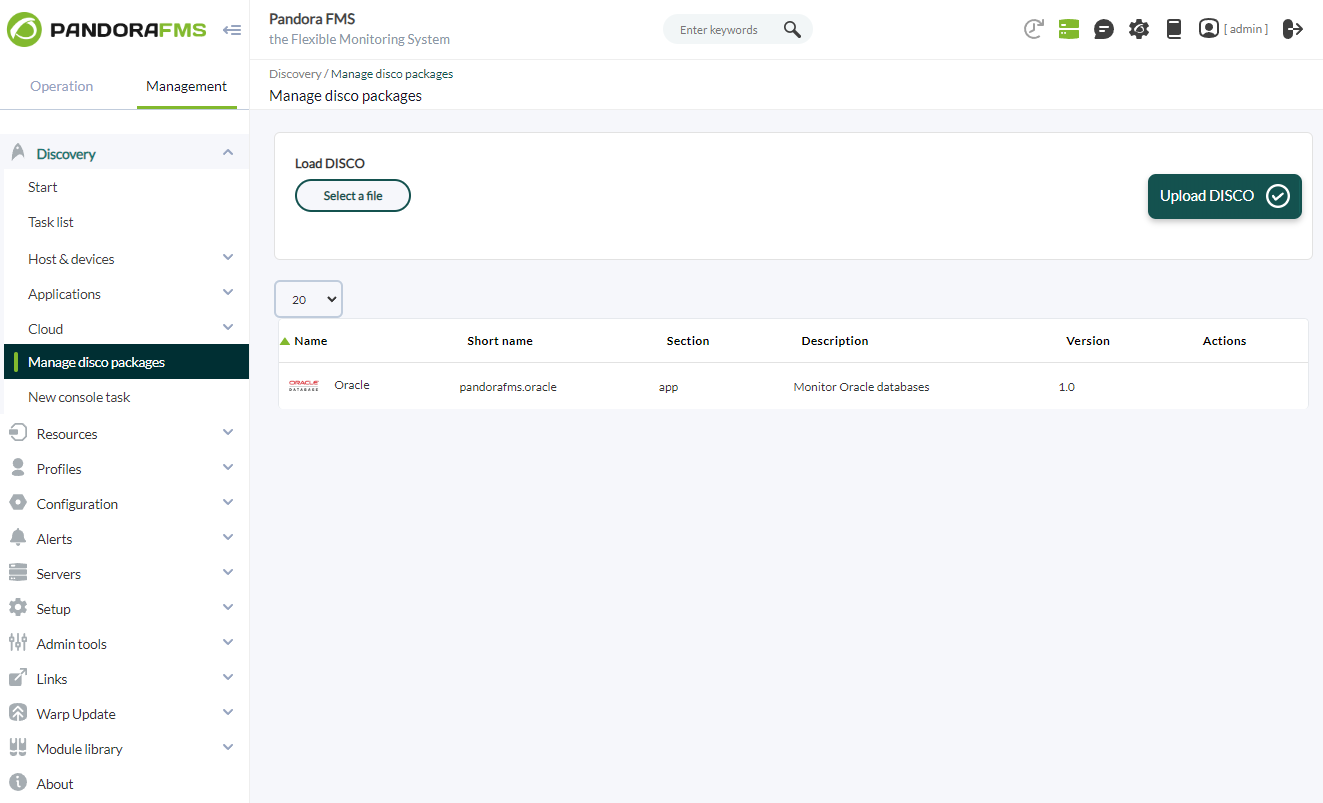
To do this, you must load the ".disco" package that you can download from the Pandora FMS library:
https://pandorafms.com/library/
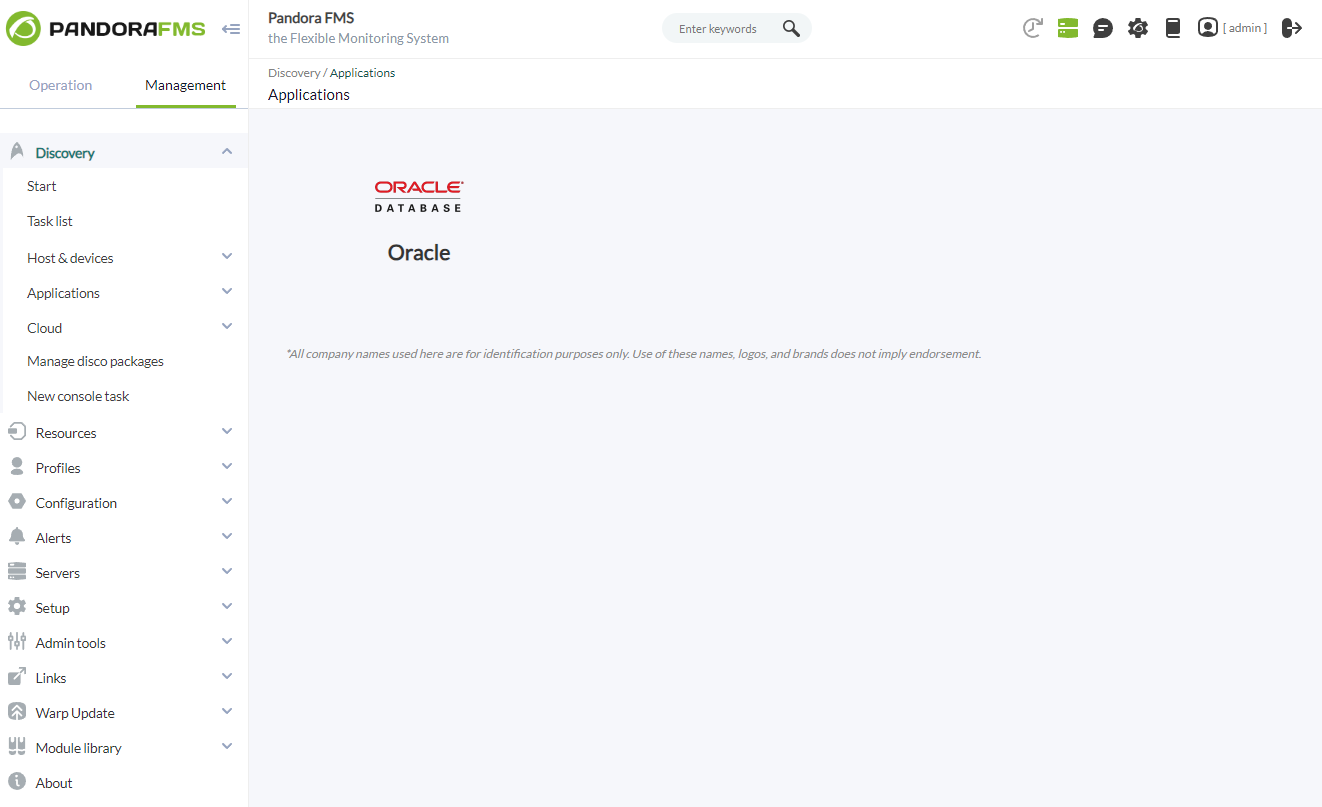
Once loaded, Oracle environments can be monitored by creating Discovery tasks from the Management > Discovery > Applications section.
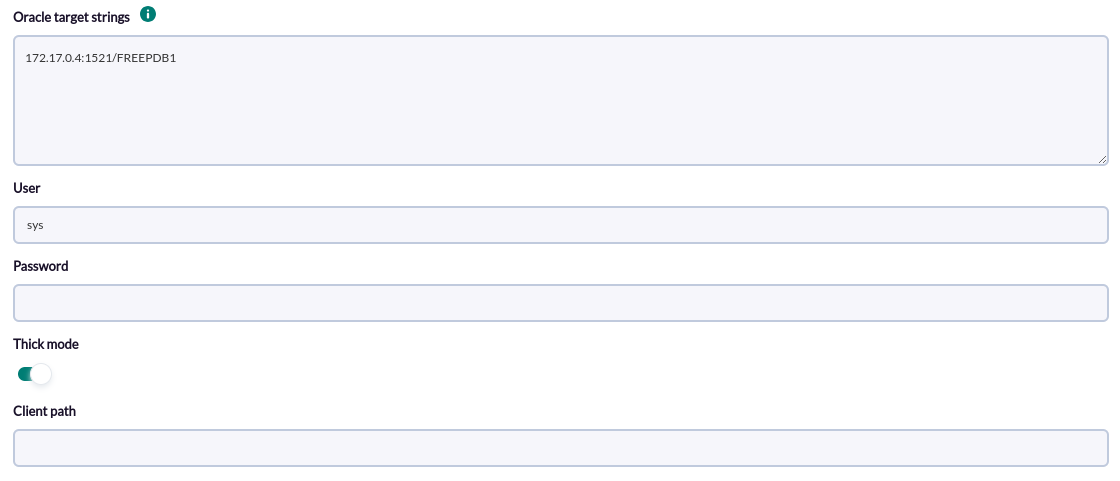
For each task, the following minimum data will be requested:
- Oracle target string: List of Oracle targets to be monitored by the task. It will be a list separated by commas or by lines. Each target database can be defined with the format IP:PORT/SID or IP/SID.
- User: Connection user to the target databases.
- Password: Password of the indicated user.
- Thick mode: To enable the "thick mode". This type of connection is only necessary in oracle databases with version 11 or earlier.
- Client path: Path of the oracle client. It is only necessary in case of enabling the "thick mode". La instalación standard de instant client 19.8 se hace en la ruta /usr/lib/oracle/19.8/client64/lib
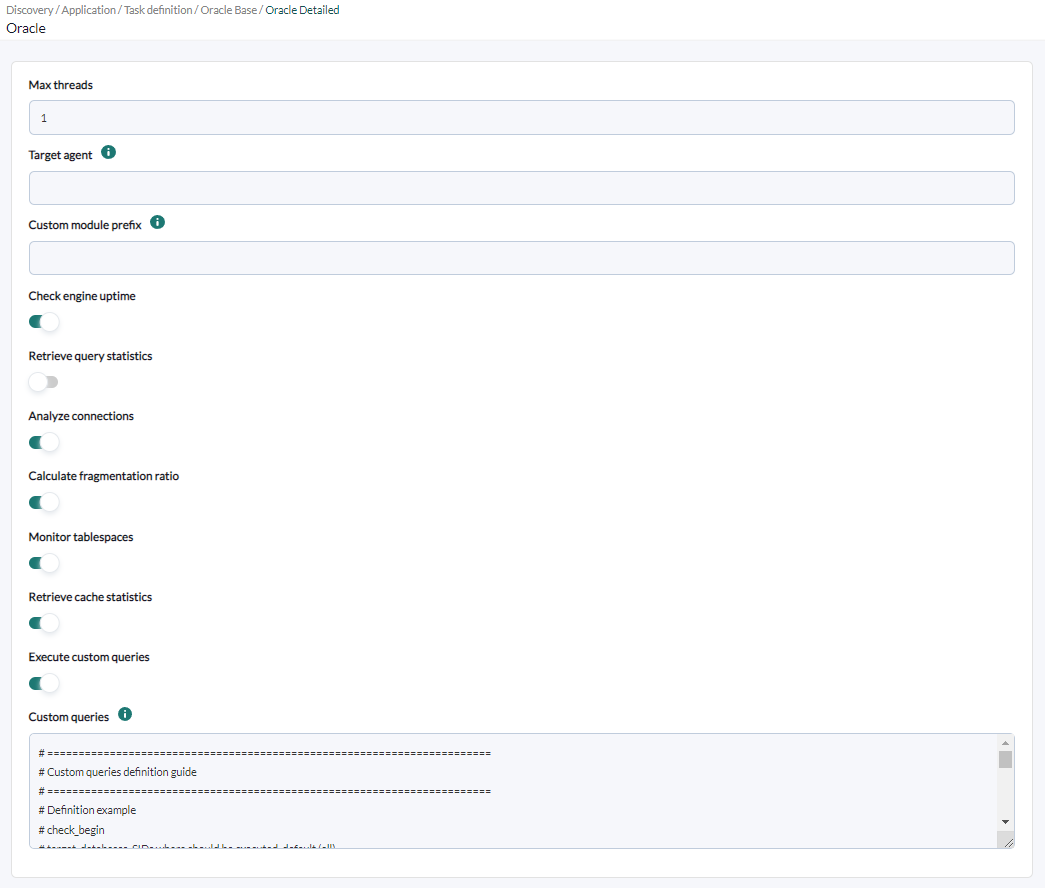
Task settings can also be adjusted to customize the desired monitoring:
- Max threads: To optimize the execution time, multiple threads can be configured to monitor the agents of the task. Keep in mind that setting up multiple threads can increase the CPU usage of the task.
- Target agent: List of target agents for the Oracle targets to monitor. That is, the names with which the agents of each objective defined in the task will be generated. It will be a list separated by commas or by lines. The position of the names in the list should match the position of the Oracle targets in your list, ie the first name will be used for the first target and so on. If the list is separated by lines, blank lines will be ignored. If an agent name is not specified for a target, its IP or FQDN will be used as the agent name.
- Custom module prefix: Text included as a prefix for all generated module names. It is useful to locate the modules generated by the task or distinguish them from others.
- Check engine uptime: If activated, it will monitor the uptime of the objectives.
- Retrieve query statistics: If enabled, it will monitor query statistics.
- Analyze connections: If activated, it will monitor the connections.
- Calculate fragmentation ratio: If activated it will monitor the fragmentation ratio.
- Monitor tablespaces: If activated it will monitor the tablespaces.
- Retrieve cache statistics: If enabled, it will monitor cache statistics.
- Execute custom queries: If activated, it will allow you to execute custom queries for each Oracle target.
- Custom queries: Configuration block to define the custom queries to be executed. Each query will generate a new module for each agent in the task.
Tasks that are successfully completed will have an execution summary with the following information:
- Total Agents: Total agents generated by the task.
- Targets up: Total number of targets that could be connected to.
- Destinations down: Total number of destinations that could not be connected.
The tasks that are not completed successfully will have an execution summary recording the errors produced.


