
Discovery
This plugin can be integrated with Pandora FMS Discovery.
To do so, you must install the ".disco" package, which you can download from the Pandora FMS repository:
https://pandorafms.com/library/
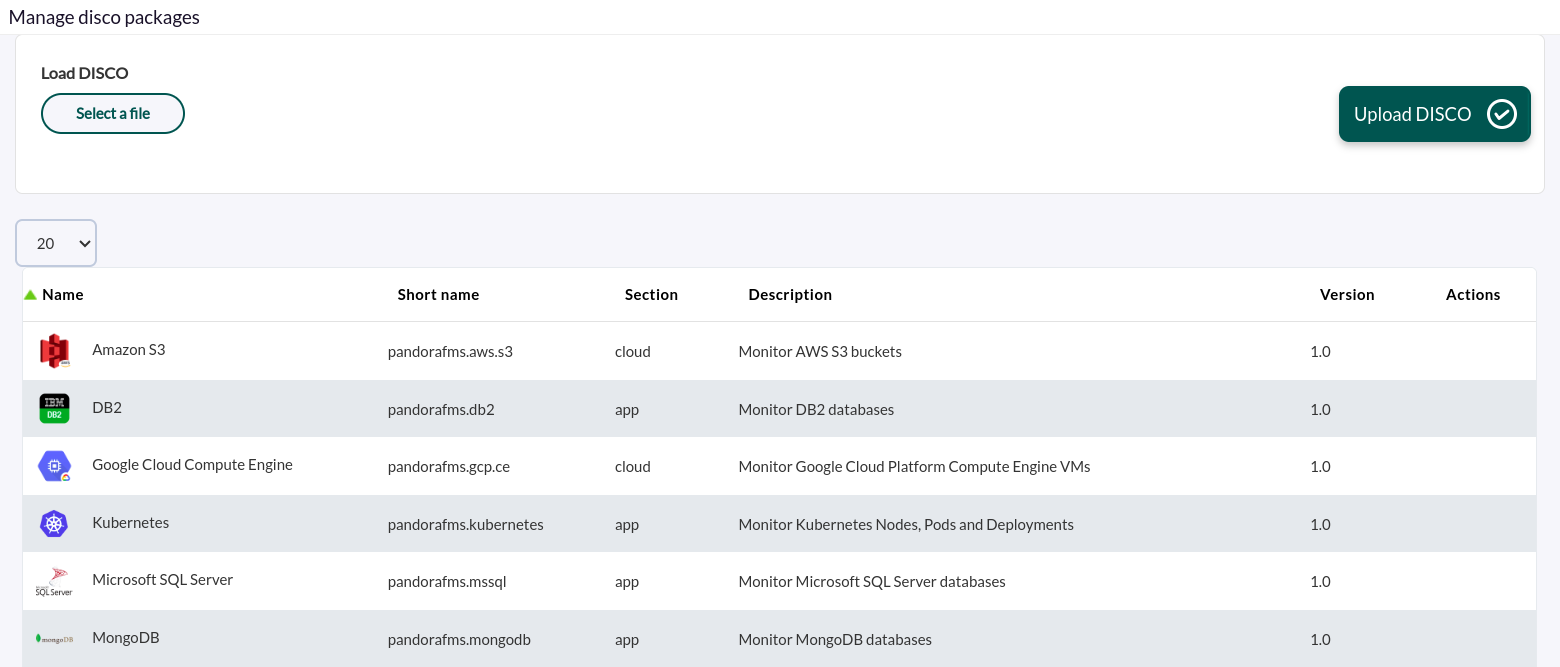
Once loaded, you can monitor MongoDB environments by creating Discovery tasks from the Management > Discovery > Applications section.
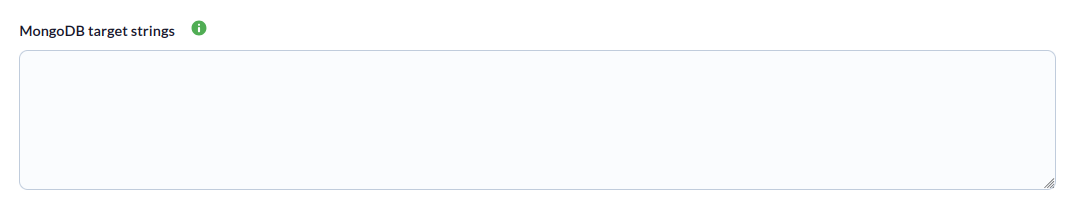
For each task, the following minimum information will be required:
- MongoDB target strings : List of target instances, separated by commas or new lines. You must specify the connection URI for each one. Example: mongodb://172.17.0.2:27017 or mongodb://monitor_user:s3cur3P@[email protected]:27017/monitoring?authSource=admin.
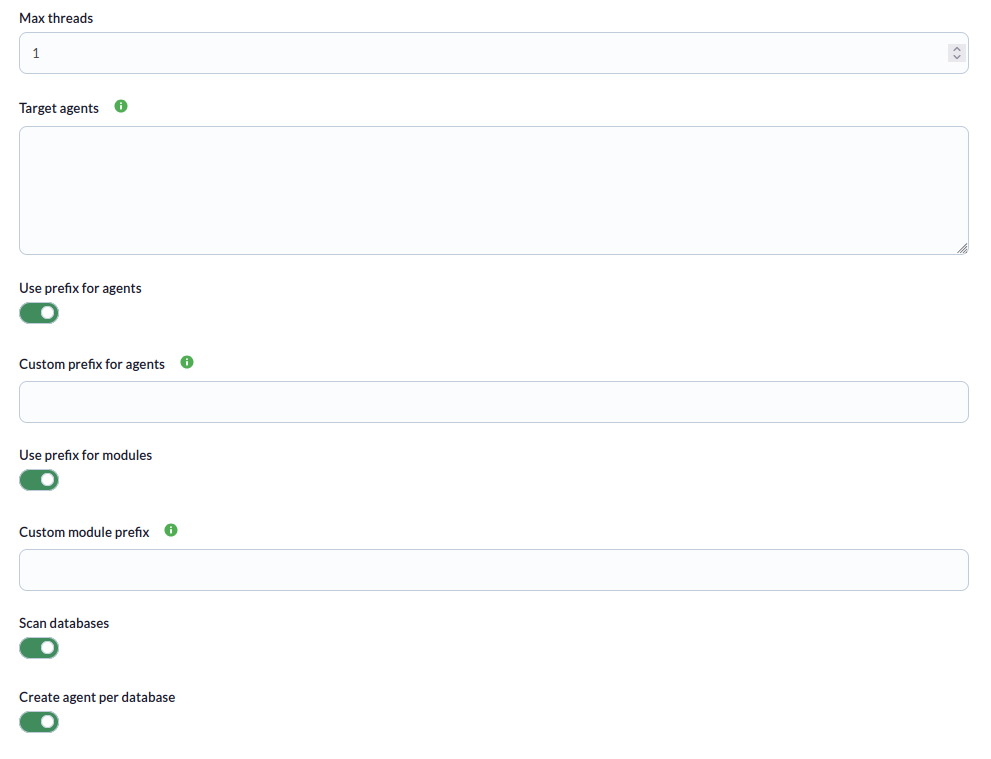
You can also adjust the task settings to customize the monitoring as desired:
- Max threads: To optimize execution time, multiple threads can be configured to monitor the task's agents. Note that configuring multiple threads may increase the task's CPU usage.
- Target agent: List of target agents for the MongoDB targets to be monitored. These are the names that will be used to generate the agents for each target defined in the task. This will be a comma-separated or line-separated list. The position of the names in the list must match the position of the MongoDB targets in their respective lists; that is, the first name will be used for the first target, and so on. If the list is line-separated, blank lines will be ignored. If no agent name is specified for a target, its name will be used as the agent name.
- Use prefix for agents: Enable this token to specify a custom prefix for the created agents.
- Custom prefix for agents: Prefix for the created database agents.
- Use prefix for modules: Enable this token to be able to specify a custom prefix for the created modules.
- Custom prefix for modules: Prefix for created modules.
- Scan databases: Enable this token to monitor the databases of the configured instances.
- Create agent per database: Enable this token to generate one agent for each database generated.
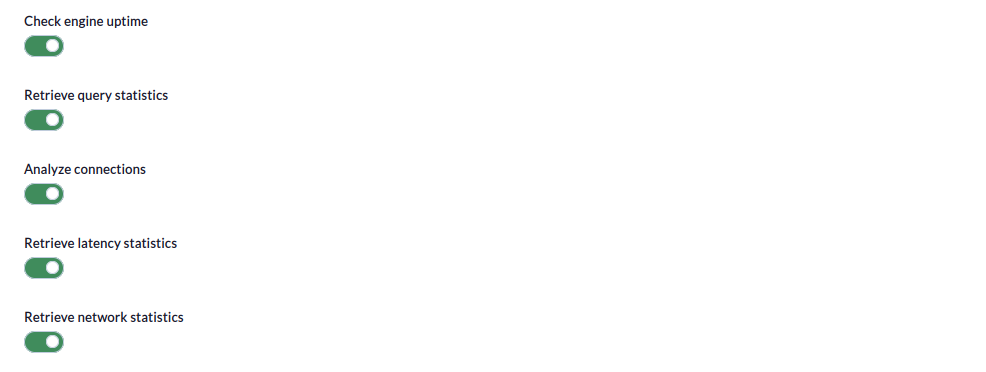
- Check engine uptime: Si se activa monitorizará el uptime de los objetivos.
- Retrieve query statistics: Si se activa monitorizará las estadísticas de consultas.
- Analyze connections: Si se activa monitorizará las conexiones.
- Retrieve latency statistics: Si se activa monitorizará la latencia.
- Retrieve network statistics: Si se activa monitorizará las redes.
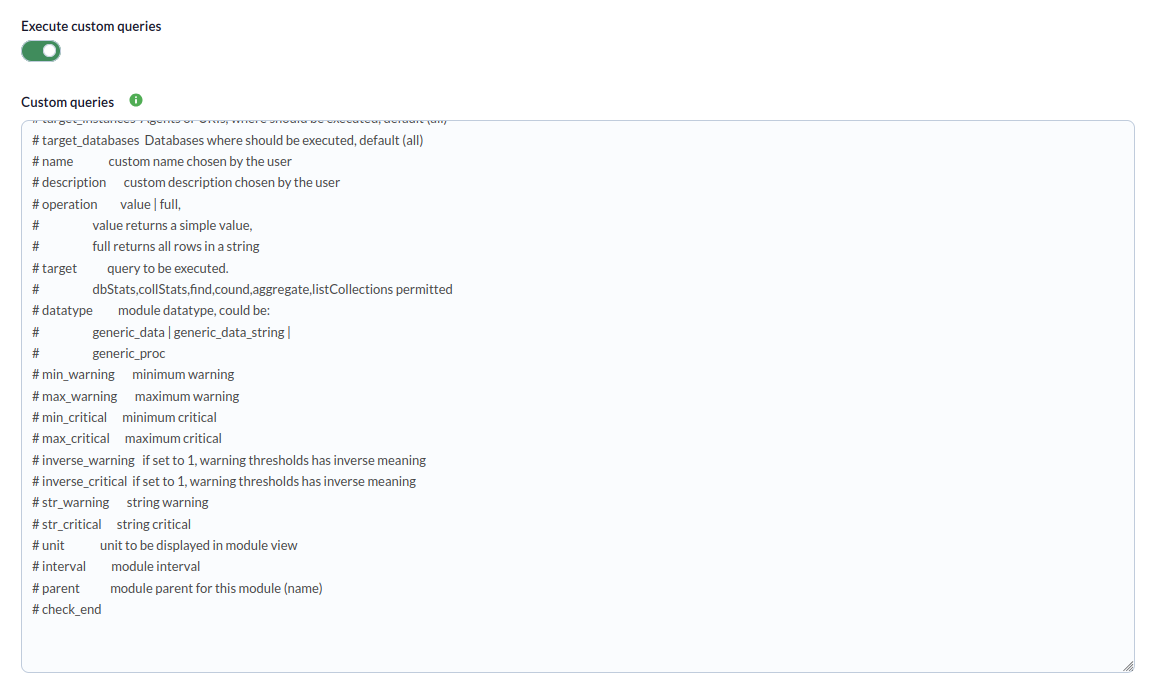
Por ultimo, se podrá configurar consultas personalizadas en el ultimo paso de la tarea (opcional).
- Execute custom queries: Si se activa habilitaras la posibilidad de ejecutar custom queries.
- Custom queries: En esta ventana se pueden especificar los módulos personalizados con las custom queries deseadas (ver apartado Parámetros para entender la sintaxis de configuración correcta)
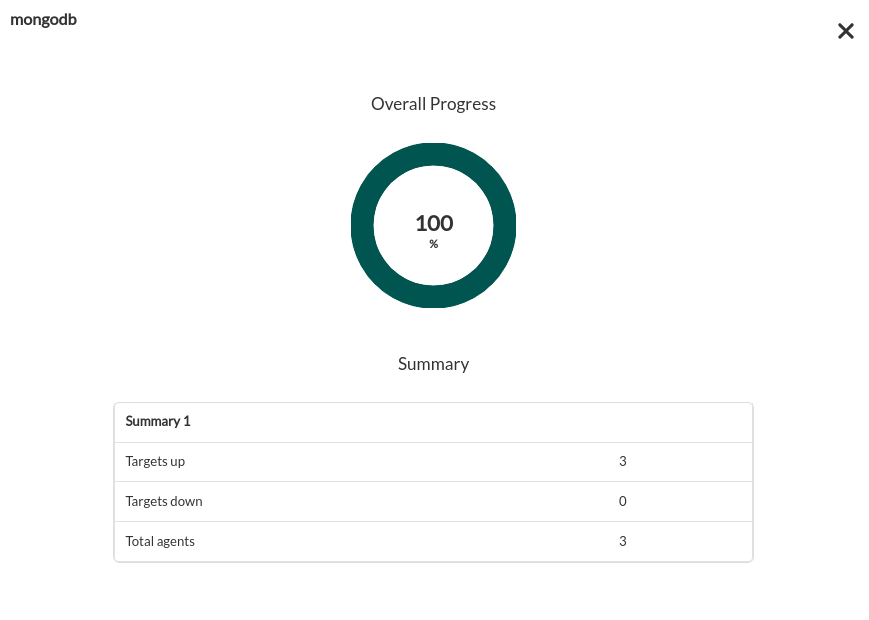
Las tareas que se completen exitosamente dispondrán de un sumario de ejecución con la siguiente información:
- Total agents: Total de agentes generados por la tarea.
- Targets up: Total de objetivos a los que ha sido posible conectar.
- Targets down: Total de objetivos a los que no ha sido posible conectar.
Las tareas que no se completen exitósamente dispondrán de un sumario de ejecución registrando los errores producidos.